Footprint Charts:
What Drives Price Movement
See what happens inside each candle: actual volumes and the initiative of buyers and sellers at every price level
Try for free
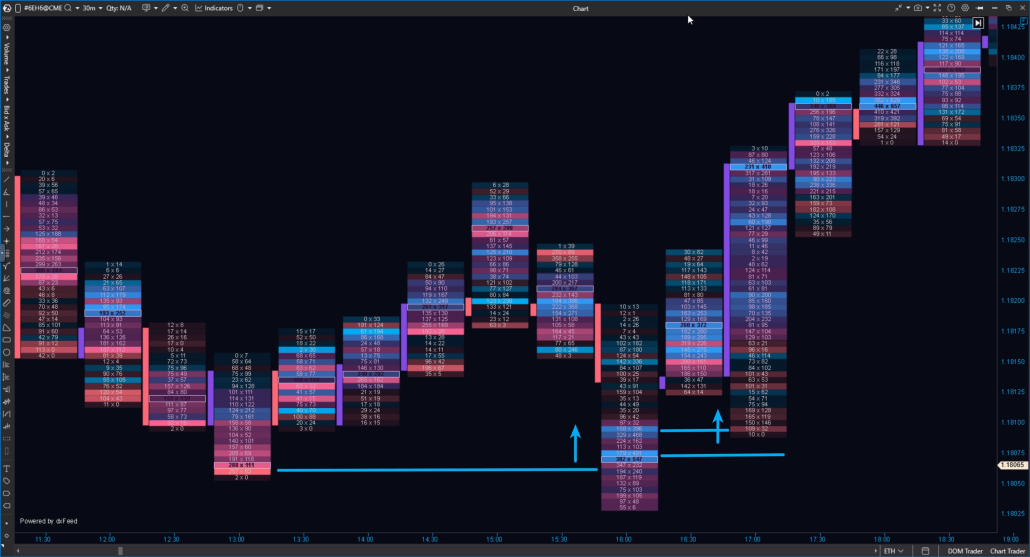
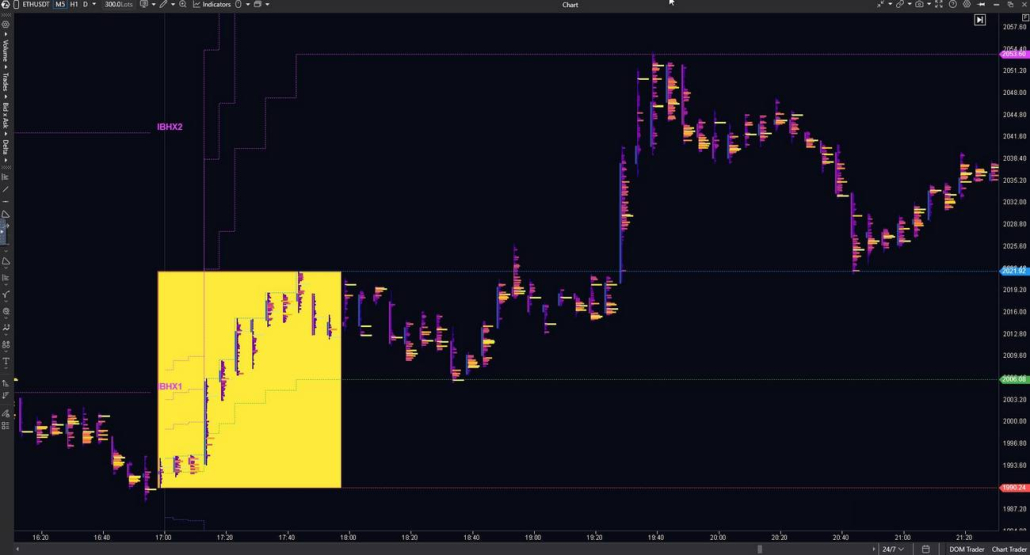
Footprint analytics is the foundation of volume analysis — a specialized chart that reveals how buy and sell orders are distributed at each price level.
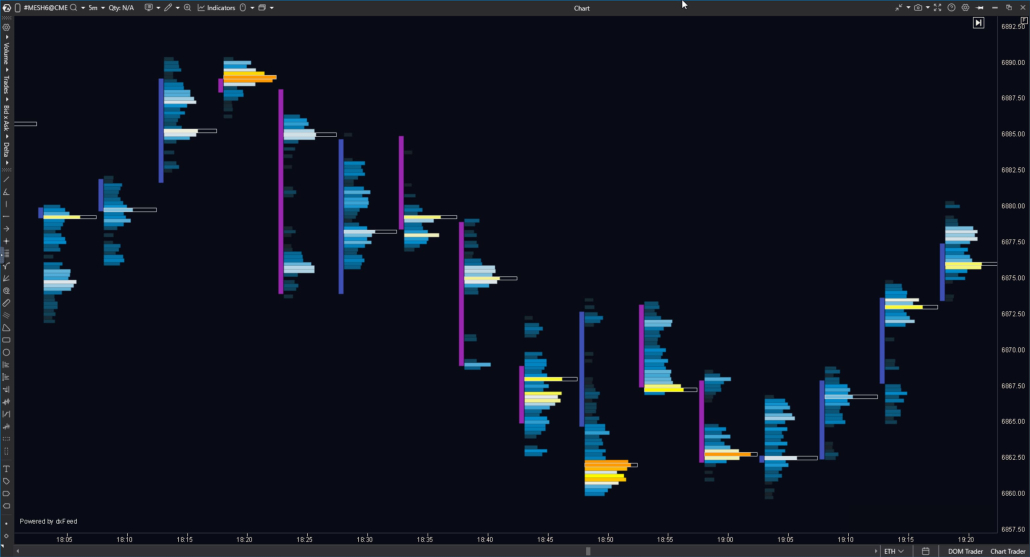
While classic candlestick charts only show price direction. The Footprint, however, breaks down each candle into individual price levels and shows the detailed processes behind this movement:
ATAS is specialized footprint chart software that makes the market transparent. Footprint charts display market structure in detail, allowing you to analyze price movement based on actual data rather than visual assumptions.
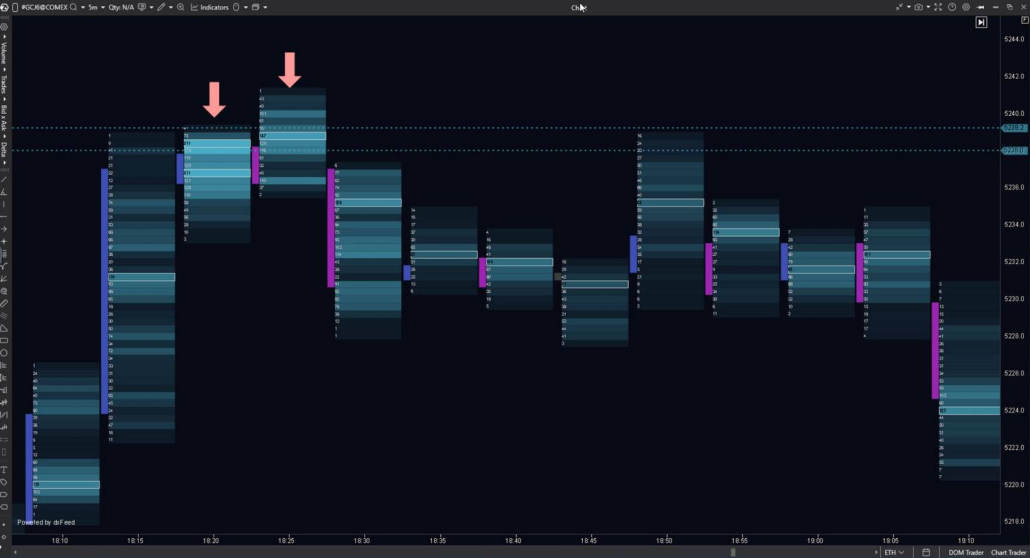
ATAS uses tick-by-tick exchange data to build footprint charts. This data includes the price, volume, and execution direction of each trade.
The information comes directly from exchanges and market data providers. It’s aggregated by price levels within each candle as numerical clusters.
You get:
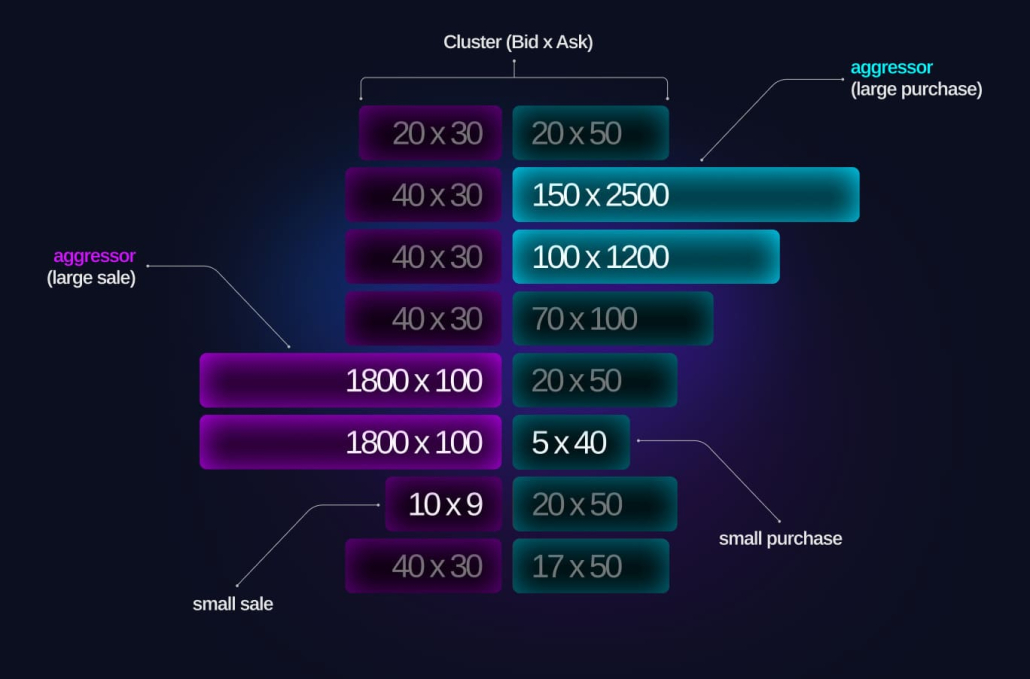
On the left — market sell orders matched with limit buy orders. On the right — market buy orders matched with limit sell orders.
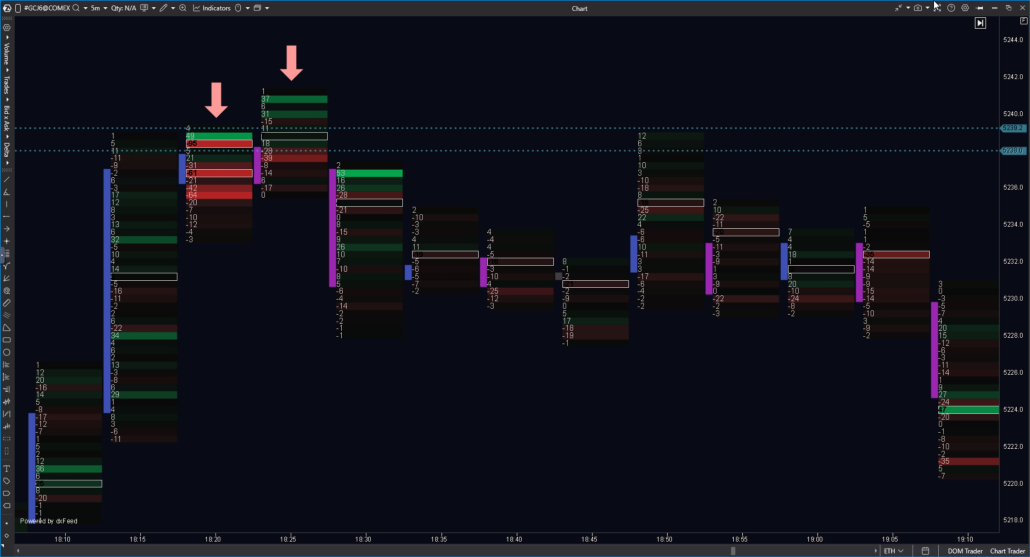
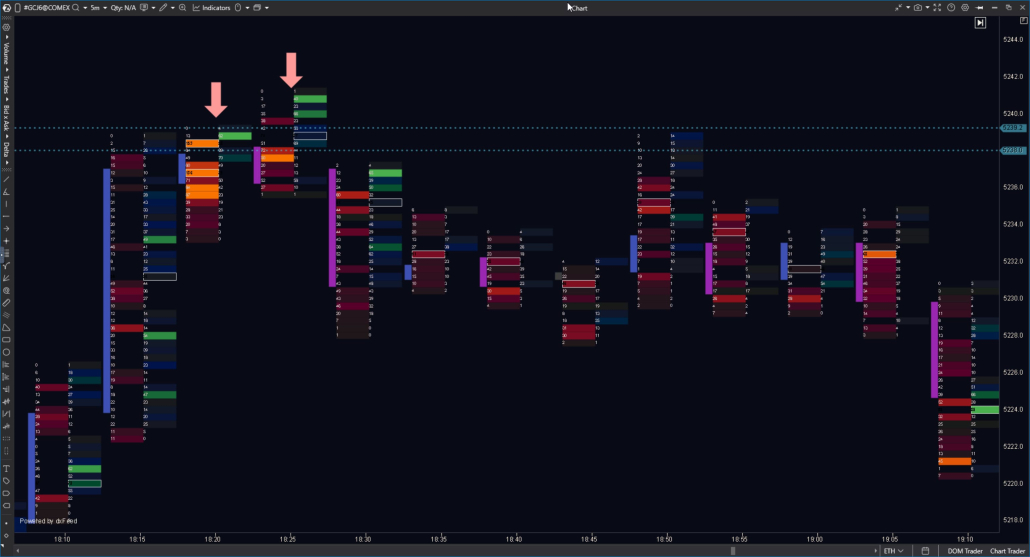
ATAS offers more than 400 footprint variations, positioning it among the best footprint chart software tools available.
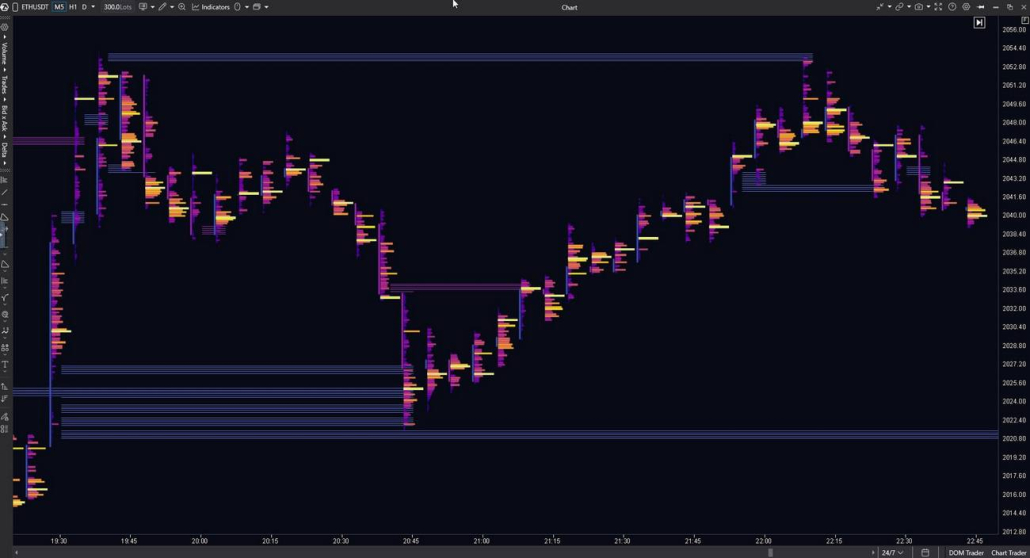
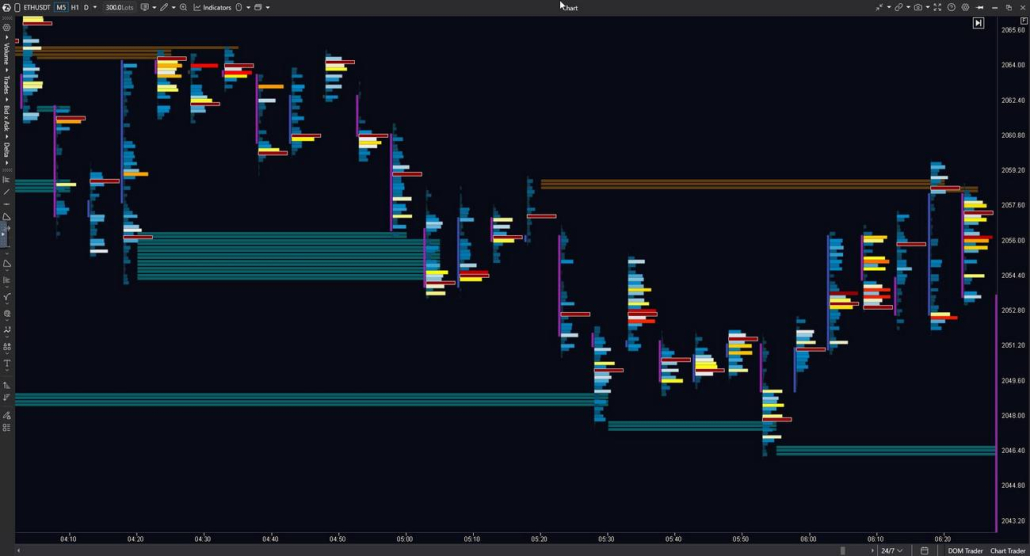
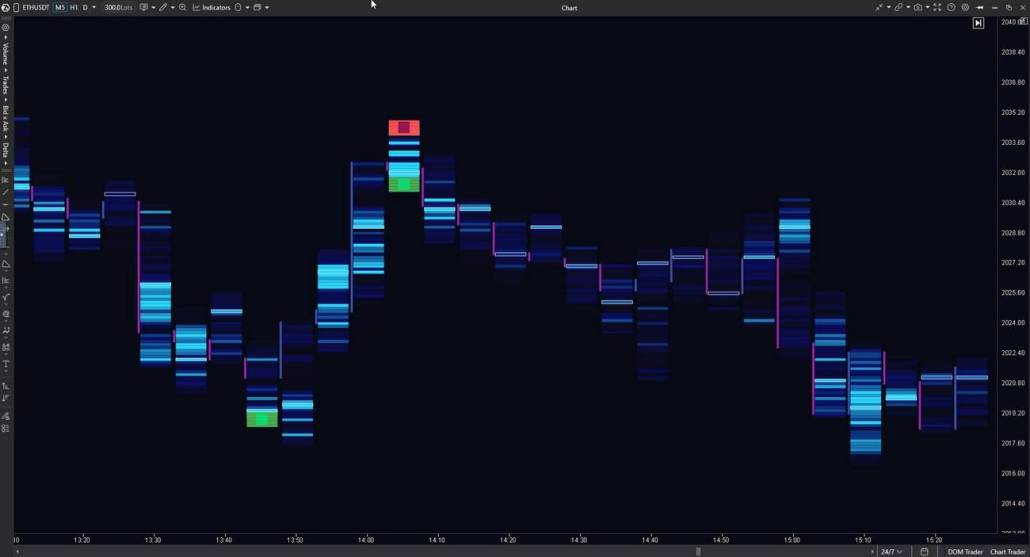
The footprint type determines what data appears inside each candle: Volume, Trades, Bid × Ask, and Delta. Each type offers multiple visualization modes, letting you customize the chart to fit your specific analysis needs.
A footprint tool that complements the main chart, allowing you to analyze multiple data representations within a single candle:
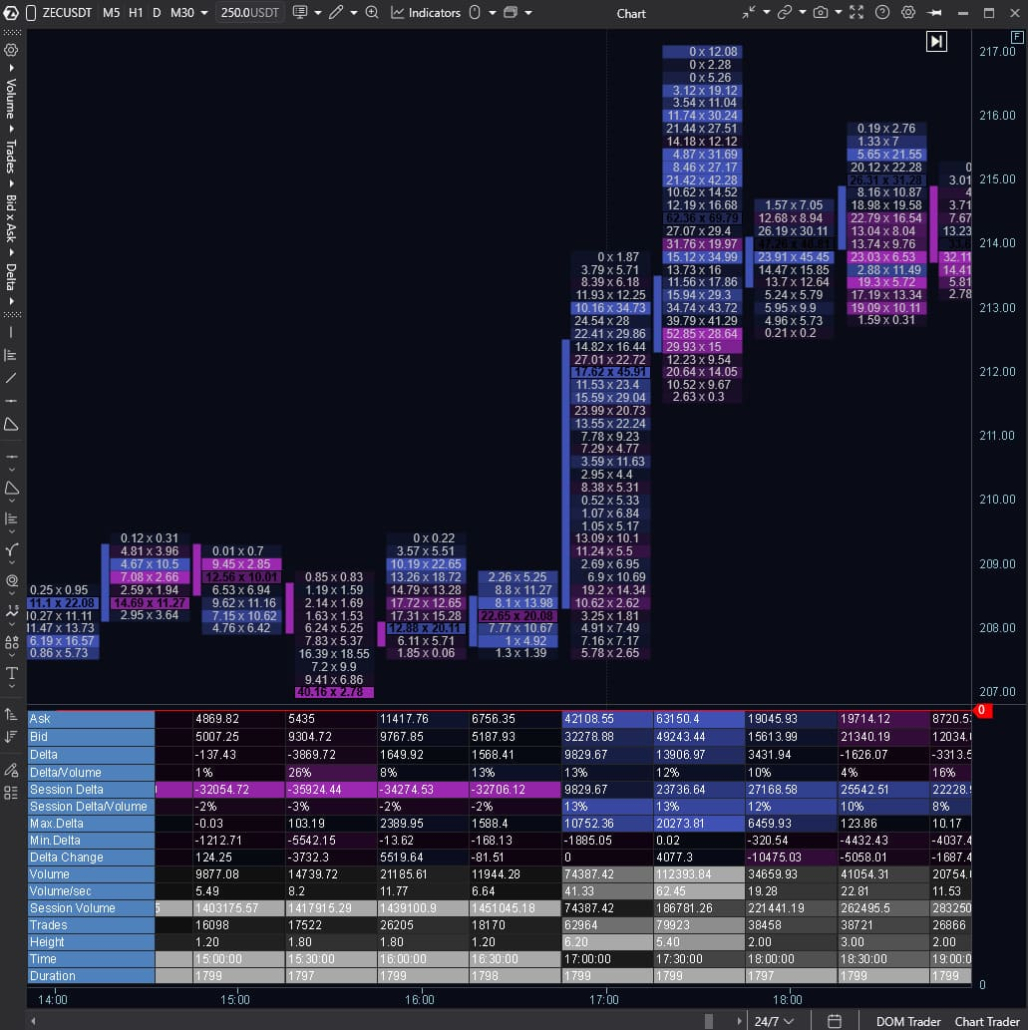
Cluster Statistics is an indicator that complements footprint analysis with precise vertical volume data.
It displays detailed statistics for each candle in a table below the chart.
Indicator capabilities:
In practice, the indicator acts as a numerical confirmation layer: while the footprint shows how activity is distributed across price levels, Cluster Statistics provides a summary of activity for the entire bar.
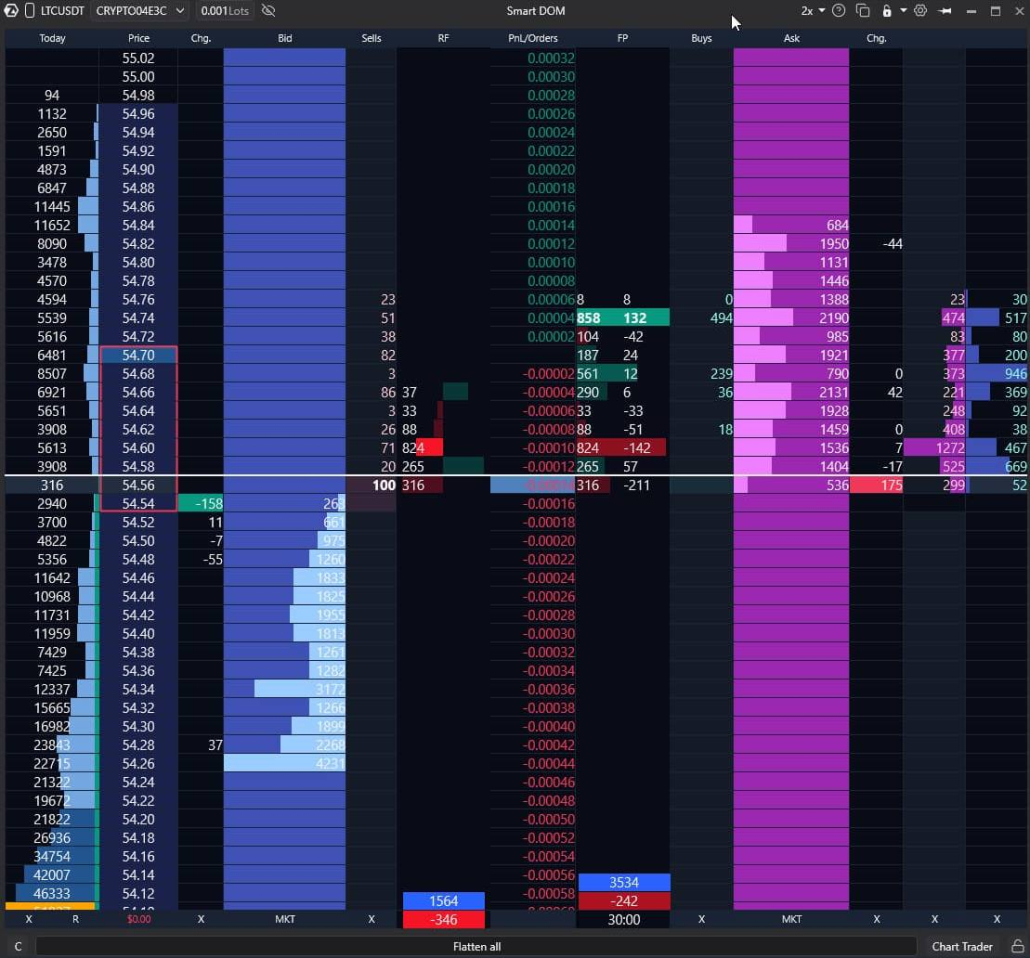
Unlike most analytical tools, ATAS allows you to analyze footprint data directly inside Smart DOM. This is especially useful when you need to monitor activity at specific price levels and within short time intervals without switching to a chart.
The feature is implemented as dedicated columns in the DOM:
Footprint — displays time-based clusters with buy and sell data at each price level. Flexible timeframes, visualization modes, and color settings allow for detailed analysis.
Rolling Footprint — a live footprint that continuously updates and shows activity over the last N seconds. It lets you observe changes in volume and initiative in real time. Tools like this are rarely available in other market analysis software.
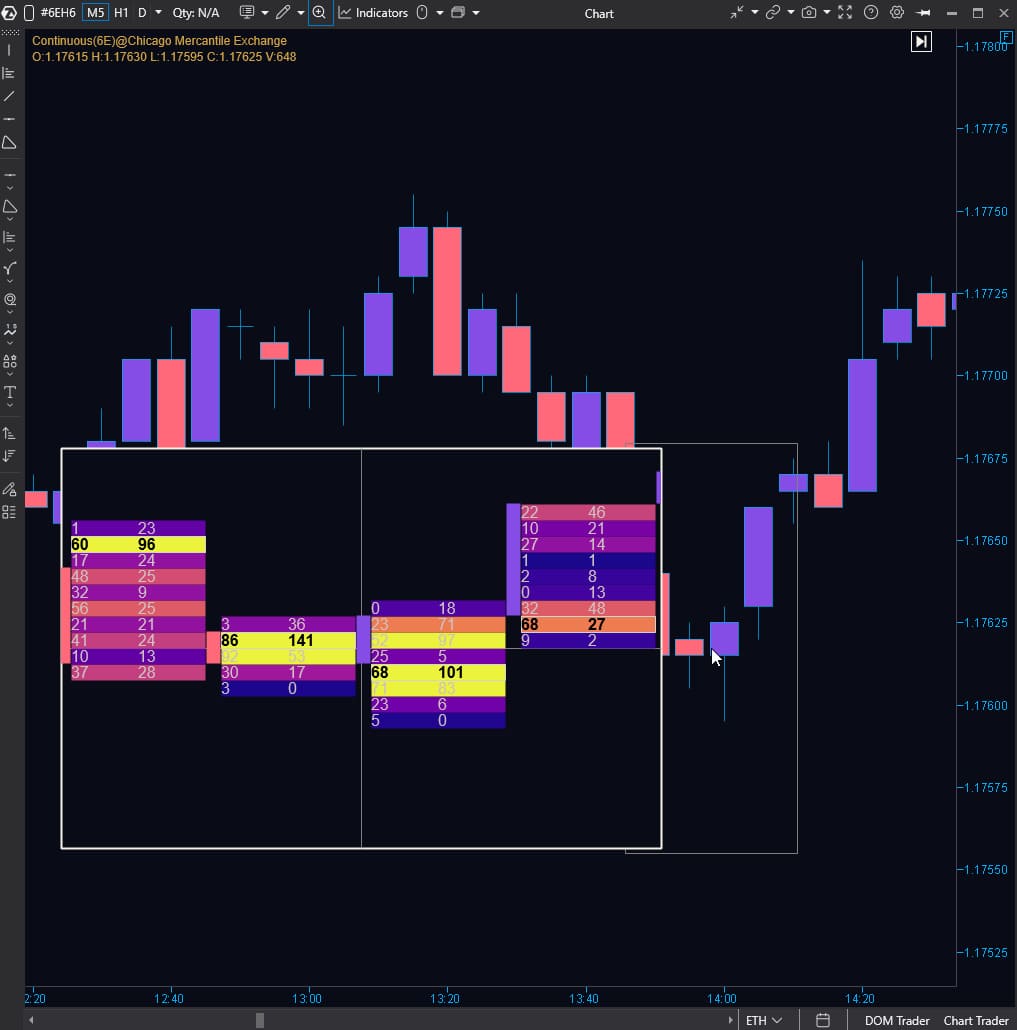
Sometimes you need to quickly understand what happened inside a specific candle, but switching the chart to footprint mode isn’t convenient. For such cases, ATAS includes Magnifier — a tool that displays footprint data for a selected area directly on a standard candlestick chart.
With Magnifier, you can:
API for Customizing Footprint Analysis
If standard tools aren’t enough, build custom solutions in C# using the ATAS API.
All footprint data is available out of the box. You don’t need to manually collect clusters from ticks, hunt for data sources, or set up storage like on other platforms.
Focus on ideas, not infrastructure:
Don’t have time to code? Order custom development of any complexity on our marketplace.
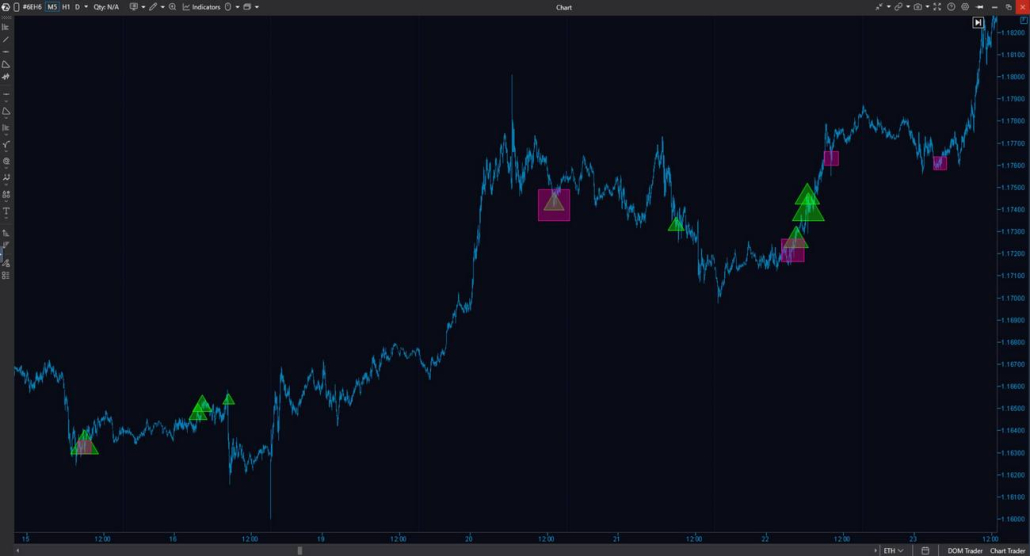
Footprint patterns are regularities in the structure of footprint data that recur across markets and provide additional context.
By observing patterns, you can:
Manual pattern search requires expertise and focus.
In addition to advanced footprint chart software, ATAS offers a comprehensive set of tools to simplify this process.
ATAS is designed as professional order flow footprint software, allowing you to use footprint charts for free — with no time limits — on the Start plan. This lets you explore footprint charts at your own pace and expand your toolkit as your needs grow.
When you’re ready to enhance your analysis with unique timeframes that filter market noise (Renko, Reversal, Range X, XV, Z, US) and advanced indicators (Big Trades, Adaptive Big Trades, CVD Pro, CVD Pro Multi, Tape Patterns, OI Analyzer), simply activate a paid plan.
ATAS builds charts using exchange data — information about trades, volumes, and execution direction.
For footprint crypto analysis, simply connect your Binance, Bybit, Kraken, or other exchange account via API.
For futures and stocks analysis, connect a broker (NinjaTrader, Interactive Brokers, Exante, CapTrader, etc.) or market data provider (Rithmic, CQG, dxFeed, etc.). To work with futures and stocks, you’ll also need to activate a paid subscription plan.
Yes! ATAS offers several ways to work with charts without executing trades on a live account:
Footprint analysis takes time and practice. ATAS provides a complete educational ecosystem to help you master it:
Experience the advantages firsthand. Analyze volume, delta, and market structure with professional tools in a single professional environment
Video title
Enter your email address and we’ll send you a link to create a new password.