
In this article we will speak about High-Frequency Trading (HFT):
- what is considered to be HFT;
- studies of HFT;
- HFT influence on liquidity;
- quoting of financial instruments;
- HFT influence on volatility.
There is a lot of information on the Internet about HFT influence on financial markets and instruments. It has a lot of empty talk and little of authority. We would base our material on the official studies of the CB of RF.
What is considered to be high-frequency trading
There is no generally accepted definition of HFT. That is why we would see what criteria the CB uses to identify high-frequency trades for its study:
- the average time of staying of the trade participant orders in a queue of all orders is less than 100 milliseconds (0.1 second). Such a participant manages to post and cancel orders in a very short period of time;
- the average difference in time between posting and cancelling orders from one trading account is less than 100 milliseconds;
- the number of orders posted from one trading account is more than 500 for 10 days. This value is identified using the expert method and 10 days is the time during which they monitored trading during the study;
- the number of active trading days of each account for 10 days.
Some sources also specify ‘collocation’ as a criterion of high-frequency trades because the high speed of posting and cancelling orders is only possible if the servers of participants are located directly near the exchange data processing centers but the CB doesn’t specify this parameter separately.
It becomes clear from the above criteria that a regular trader cannot do high-frequency trading from his home computer due to purely technical reasons.
HFT studies
The following instruments and markets of the Moscow Exchange for 10 trading sessions in a row from January 30, 2017, until February 10, 2017, were selected for the study:
- RTS Index futures, because this is the most liquid stock index futures on the Moscow Exchange;
- Gazprom stock futures – for the same reason of liquidity;
- Sberbank stock futures – for the same reason of liquidity;
- the USB/RUB currency pair with settlements today and tomorrow;
- common Gazprom stock since it takes the biggest weight in the Moscow Exchange Index;
- common Sberbank stock since it also takes a significant weight in the Moscow Exchange Index.
Thus, the CB covered all Moscow Exchange sections – stock, forward and currency markets. This is how the result by the above criteria looks like:
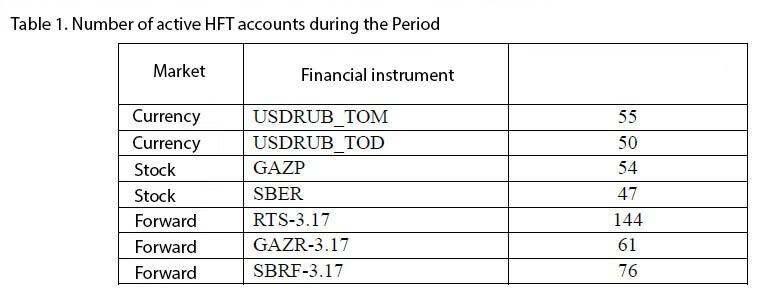
The main problem, which is connected with the high-frequency trading, is decrease of liquidity. Limit orders provide liquidity on the exchange. Limit orders are also called passive while market orders – aggressive.
A trade is executed when market and limit orders meet. We wrote about it in detail in the article about order matching.
If there were a small number of limit orders or they were distributed unevenly, the spreads between the demand and supply would have been very wide and instruments non-liquid.
Traders that trade with the help of limit orders increase or provide liquidity, while traders that trade with the help of market orders decrease or withdraw liquidity.
HFT influence on liquidity
It is necessary to divide HFT participants by types of their orders in order to identify how HFT influences liquidity and how big the share of HFT trades on the Moscow Exchange is. Maybe, their number is so small that they cannot influence anything.
You can find answers in the following table.
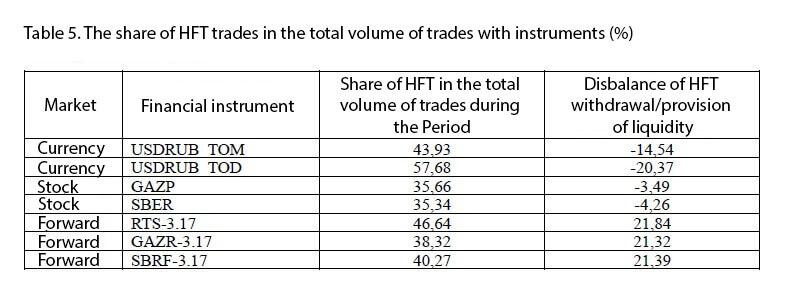
HFT participants execute from 35% to 57% of all trades on the Moscow Exchange, which means that their actions should be taken into account.
Disbalance is the difference between the provided and withdrawn liquidity in respect of the total volume of trades. In fact, it means the following:
- HFT participants mostly withdrawn liquidity in the currency market, that is they worked with market orders. For example, liquidity was withdrawn by 14.54% more than provided on USDRUB_TOM;
- HFT participants provided liquidity in the forward market, that is they worked with limit orders. For example, liquidity was provided by 21.84% more than withdrawn on the RTS Index futures.
The authors show it graphically as follows:
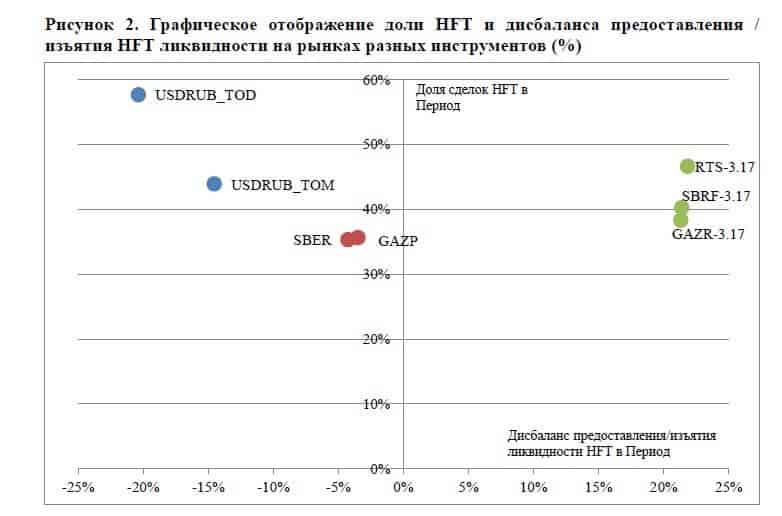
However, you cannot draw a conclusion from these data whether actions of HFT participants positively or negatively influence trades.
The following assumptions arise due to non-uniformity of their actions:
- perhaps, the share of HFT trades is insignificant for the considered instrument;
- perhaps, an HFT participant posts, apart from market orders, limit orders in a queue near the prices of a better spread. Such actions are called the financial instrument quoting and they increase efficiency. In other words an HFT participant could both withdraw and provide liquidity simultaneously;
- perhaps, the market efficiency increases when the liquidity decreases. It sounds strange but the CB gives the following example – liquidity decreases when news are published but the price quickly reaches a new fair value due to it;
- indicators of influence of similar instruments on liquidity in different markets are very different. We speak here about the stock and forward markets. For example, HFT participants withdrawn more liquidity for the Sberbank stock and provided more liquidity for the Sberbank stock futures.
How participants of HFT trade are divided?
The authors of the study divided HFT participants into groups in order to still try to understand the high-frequency trading influence on liquidity:
- HFT-directional;
- HFT-maker;
- HFT-taker;
- HFT-mixed.
Let’s consider them in detail.
HFT-directional – трейдеры, которые в течение сессии торгуют однонаправленно.
HFT-directional are traders who trade in one direction during one trading session. For example, they can accumulate big blocks of securities in the stock market.

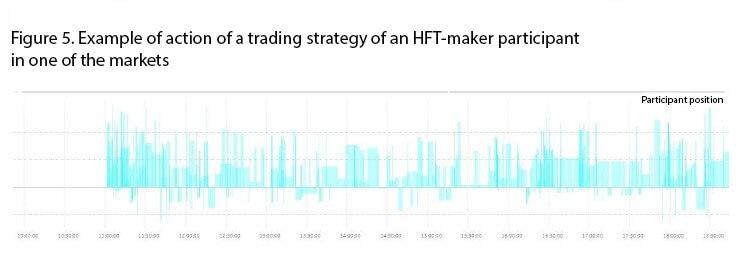
HFT-maker are liquidity suppliers. WLI-ratio of withdrawn liquidity was calculated for such participants. It is identified as a relation of the withdrawn liquidity to the total number of trades. If WLI<40% during 70% of the considered trading sessions, the participant was referred to the liquidity suppliers.
HFT-taker are traders who withdraw liquidity. If WLI>60% during 70% of the considered trading sessions, the participant was referred to this category.
HFT-mixed are traders who both withdraw and provide liquidity. All participants that didn’t fall in one of the previous categories fell into this one.
Here’s what we have in the end:
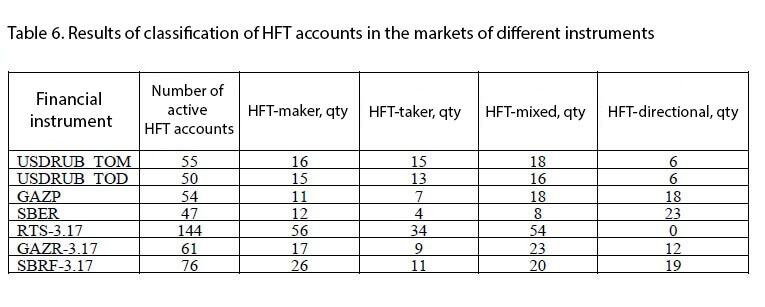
A conclusion could be drawn from this table that HFT participants have different trading strategies in different markets. They are not inclined to only withdraw or provide liquidity. Besides, the behaviour of certain HFT categories didn’t change significantly, except for HFT-directional, during different trading days.
Financial instrument quoting
The next step of the study has to do with financial instrument quoting. When a trader posts his limit orders close to the spread, it increases liquidity. The authors calculated the ‘instant liquidity’ PLI indicator in order to take this influence into account.
PLI is an aggregate volume of orders, posted in a queue, which are 0.1%, 0.25%, 0.5% and 1% from the middle between the best demand and supply prices. In simple words: the closer a limit order to the middle of the spread and the longer it stays there, the higher the liquidity is. The closer the queue of limit orders to the spread, the less the probability of the ability of a big market order to sharply move the price is.
The general indicator of the instant liquidity is a sum of indicators of the instant liquidity from the demand side and supply side. The higher the PLI, the more resistant the market to big market orders is. It is also true that the higher the PLI, the more liquid the market is.
PLI could be calculated not only for a market, but also for an HFT participant. The conclusions will be similar: the higher the indicator, the more strongly actions of this participant would influence liquidity.
After lengthy calculations, the authors show results separately by markets and by instruments. These results are also non-uniform.
- As regards the currency market instruments, HFT participants provide about 50% of liquidity within 0.1% from the middle of the spread.
- As regards the stock market instruments, HFT participants provide not more than 35% of liquidity within 0.1% from the middle of the spread.
- As regards the forward market, the data differ depending on an instrument. As regards an RTS Index futures, HFT participants provide about 40% liquidity within 0.1% from the middle of the spread. As regards the stock futures, this indicator is only 16-25%. Moreover, the liquidity vanishes during an intermediary clearing from 14:00 until 14:05. Which means that HFT participants remove limit orders just to be on the safe side.
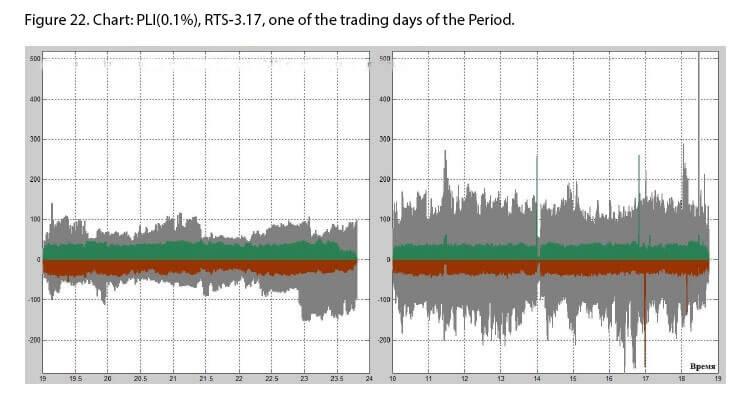
- The green chart is the chart of the indicator of instant liquidity from the supply side. In other words, these are limit sell orders.
- The red chart is the chart of the indicator of instant liquidity from the demand side. In other words, these are limit buy orders.
- The grey charts are the charts of the aggregate volume of sell and buy orders of all HFT participants within 0.1% from the middle of the spread.
There cannot be negative values in this case, the chart has just been built in such a way for better visual perception.
HFT influence on volatility
The authors consider influence of HFT participants on volatility in the second part of the study.
Volatility is closely connected with liquidity since the higher the liquidity, the lower the volatility is. Very volatile markets and instruments do not attract investors but attract speculators instead.
To calculate the volatility, the authors analyzed 2-, 5- and 10-minute intervals of each financial instrument for a trading session during the period of 10 days. We will not present complex formulas and calculations here. The authors wanted to find time intervals with higher volatility in every instrument and connect them with actions of HFT participants by volume and direction of trades during these periods.
Apart from the higher volatility, the authors also specify the downtrend or uptrend which coincides with the periods of volatility:
- Trades towards the trend increase the short-term volatility;
- trades against the trend decrease the short-term volatility.
If we check what different categories of HFT participants do during volatility splashes, we’ll get the following table:
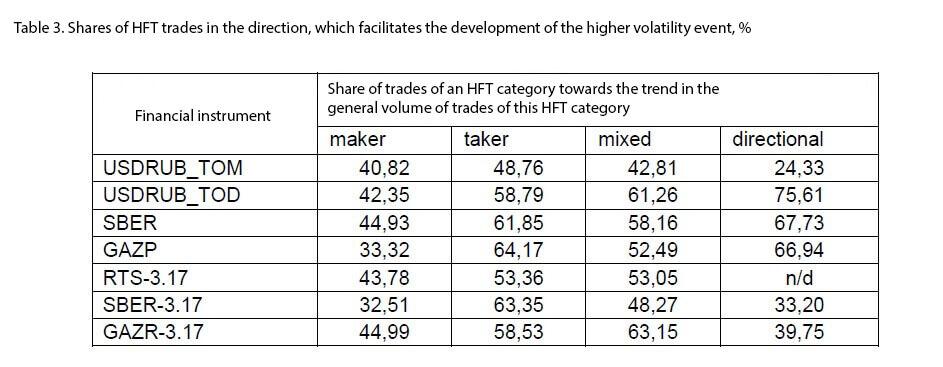
Actions of HFT participants are non-uniform as it was in the situation with liquidity. For example, HFT-maker (liquidity suppliers) in all instruments mostly open trades against a trend since their limit orders are close to the spread on the way of the trend development. The table shows actions ‘along the trend’. In order to calculate the percentage of actions ‘against the trend’, you just need to subtract the ‘along the trend’ trades from 100%.
The authors write that it is impossible to make a firm conclusion about an aggregate influence of HFT participants on the market volatility. But it has to do with the limit orders only.
And what if HFT participants work with market orders during the periods of higher volatility?
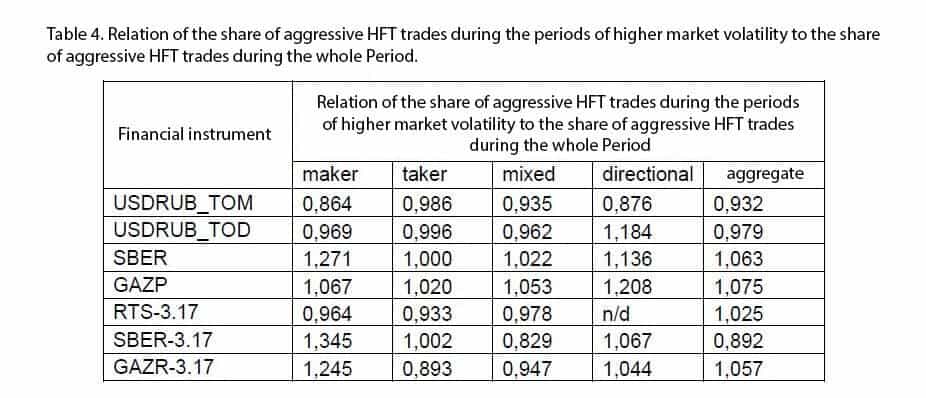
If the value is above 1, it means that this category of HFT participants executes more trades with market orders during the period of higher volatility than during regular volatility. We can also see a non-uniform behaviour of various HFT traders in this table, which means that we cannot make a firm conclusion that HFT increases volatility.
Basic conclusions
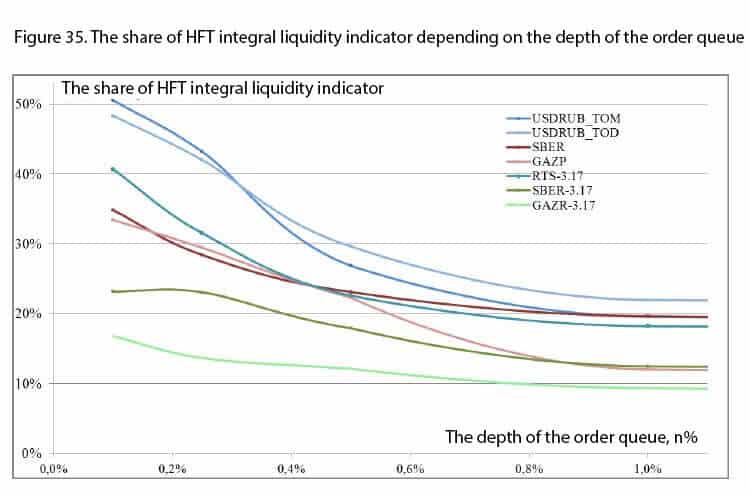
- HFT participants provide non-uniform liquidity in different markets and with different instruments. The major part of liquidity is located closer to the spread (shown in the picture above).
- A significant volume of trades falls on HFT participants in the Russian market.
- If major HFT participants cease to provide liquidity, it will have a negative impact on the markets.
- The ‘fastest’ HFT participants are inclined to post orders closer to the spread. Participants with less technical capabilities post orders farther from the spread to be able to cancel or replace them.
- HFT traders influence volatility, but their actions are non-uniform.

