Trading futures on S&P 500, NASDAQ, Dow Jones, DAX and RTS indices is very popular. For example, only in one market E-mini ES is traded from 1 to 3 million contracts during one session. No wonder that CME introduced micro-contract trading with a very low entry threshold on the wave of popularity of futures on stock indices.
If you are interested in trading in these markets but you are not sure what to begin with – this article is for you. If you are an advanced trader of futures on stock indices take note of the last section.
Read in this article:
- What an index is?
- Types of indices.
- Who creates indices and who is responsible for them?
- How indices are created and calculated?
- Investment products based on indices.
- S&P 500 index and a futures on the S&P 500 index.
- RTS index and futures on the RTS index.
- Is it possible to predict the index?
What an index is and what it is for?
An index is an average selection of financial instruments from a certain market segment. For example, S&P 500 is a stock index, which includes prices of 500 stocks of American companies with the biggest value.
Indices perform the following functions:
- It is an economic indicator of health and development of the economy of a specific sector, country or even the whole world. Stock indices grow if investors buy stocks and fall if investors sell stocks.
- It is a reference point for assessment of profitability of investment products. Investors like investments which bring a higher profit than profitability of the stock index. Portfolio managers are proud of the fact that they surpassed the index in more than N times and received bonuses for it.
- It is an instrument of analysis and forecasting. For example, the indices which track spendings on healthcare are useful for civil servants. Analysts use technical analysis for studying the index behaviour during crises and rises of economy and then extrapolate historic data on the modern market.
Types of indices
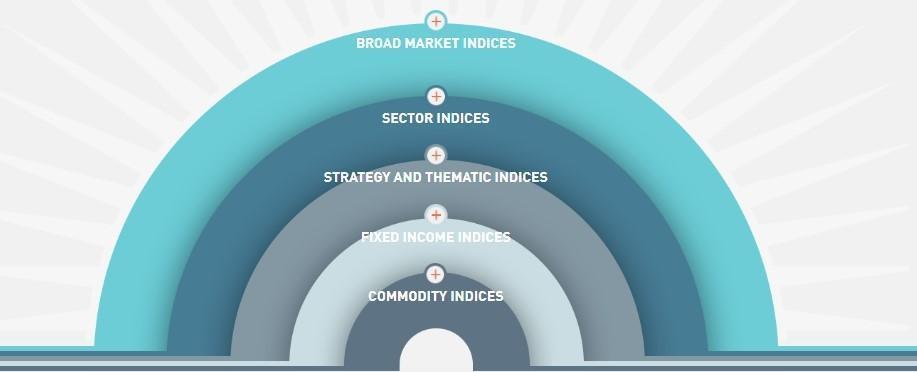
Types of indices:
- wide market indices – for example, S&P Global BMI covers approximately 10,000 stocks from 25 developed and 22 developing markets;
- branch indices – for example, MOEXTN is the transportation index of the Moscow Exchange, which covers 4 transportation companies;
- fixed profitability indices – for example, S&P U.S. Municipal Green Bond Index is the index of municipal bonds S&P;
- commodity indices – for example, Dow Jones Commodity Index Cocoa or cocoa index;
- strategy indices – dividend indices, asset distribution indices, etc.;
- economic indicators – Volatility Index S&P 500 VIX.
Why are there so many indices? In order to be able to have flexibility in monitoring and assessing the markets. For example, analysts study the most recent index data in order to identify development of both the world economy and its separate parts. Pension funds assess indices in order to invest into reliable and stable companies.
Who creates indices and who is responsible for them?
Indices are created by banks, analytical agencies and investment banks. These organizations support real-time data, rebalance the index and set the rules of its creation. For example, the Standard & Poor’s agency created the most famous S&P 500 index.
How securities are selected for the index and how the index is calculated?
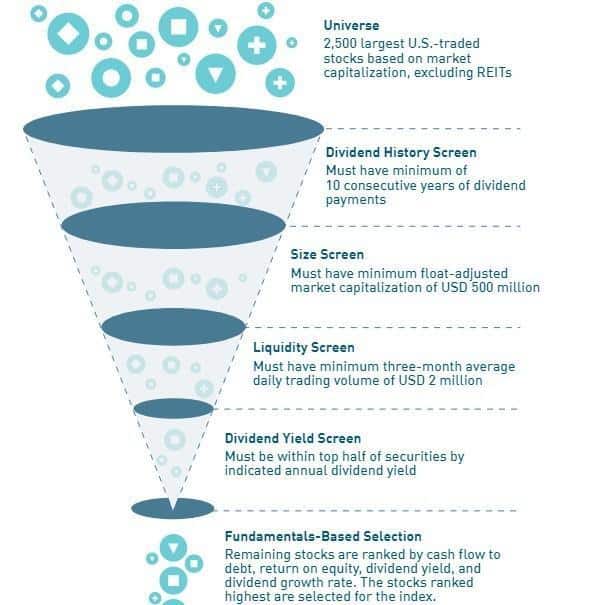
Securities are selected for the index in different ways. Most of all, the market capitalization, liquidity and financial ratios are taken into account. In some cases the criteria could be quite exotic – for example, the Shariat indices include only those companies which produce products that are allowed for muslims.
Here’s how stocks are selected for the Dow Jones US dividend 100 index.
Methods of index calculation
Stock indices are calculated by different methods. The most frequently used ones are:
- Simple arithmetic average – the prices of all stocks are put together and the sum is divided by their number. This method of calculation does not take into account the capitalization of companies and the price of the stock of a company with a big capitalization has the same influence on the index as the price of the stock of a company with a small capitalization. More expensive stocks influence the index more than the cheaper ones in this method of calculation. Any investor can calculate this index in Excel with the help of one formula, since this method is very simple. The oldest American Dow Jones index is calculated as the simple arithmetic average.
- Weighted arithmetic average – the prices of all stocks are also put together and the sum is divided, but additional parameters, such as the company capitalization, are taken into account. Thus, the Facebook or Microsoft stock prices will influence the index much more than the Analog Devices stock price. The sum is divided not on a number of stocks but on a ‘divisor’. The divisor value is selected for convenience, so that the index would equate to, for example, 100 points. It is easier for investors and analysts. The stocks could be weighted not only by capitalization but also by the stock price or by the total value of the selection.
- There are also weighted geometric average and composite geometric average. But we will not describe them since they are rarely used.
It is important for traders to understand how indices are calculated, since different methods calculate indices differently.
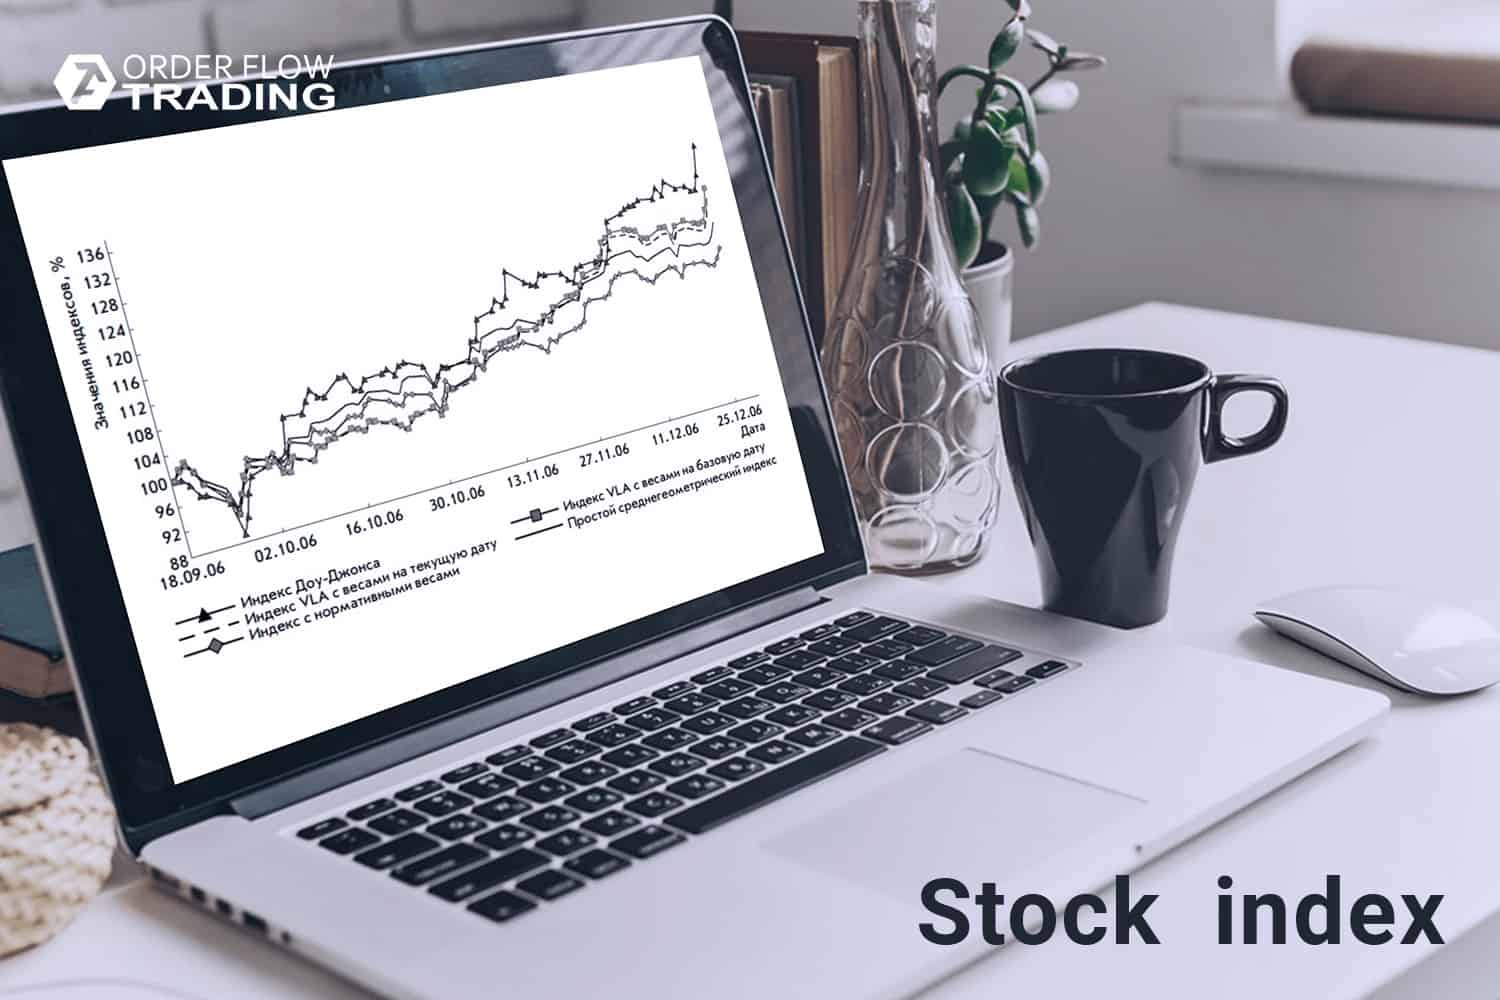
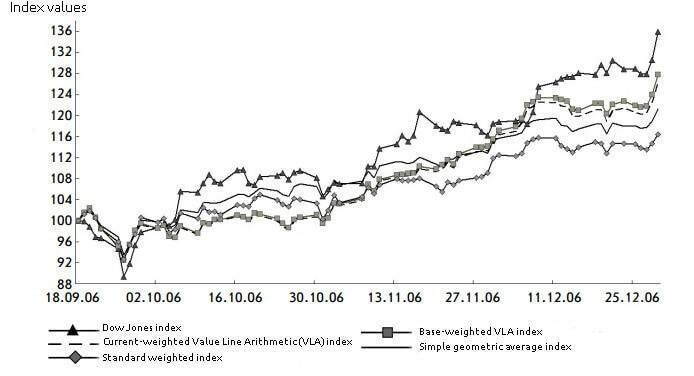
Example. In the chart below all indices started from the value of 100% but the difference between them became nearly 20% in three months because they were calculated using different methods.
S&P 500 index
It is one of the most famous indices. S&P 500 tracks leading American companies with the biggest capitalization in the leading branches of industry. The index is rebalanced after corporate changes in the companies, which stocks are included in the index. When a company goes out of the S&P 500 index, it is taken to be very bad for it. And vice versa, if the company is included into the S&P 500 index, it confirms its reliability, success and reputation.
S&P 500 is calculated with consideration of the market capitalization. In other words, the stock price is multiplied by the number of shares in circulation corrected to public placement. The bigger the stock’s market capitalization is, the more a change in the value of this stock will influence the index.
Political events, terrorist attacks and international controversies exert a big influence on the index.
Futures on the S&P 500 index and mini-futures on the S&P 500 index are traded on CME.
S&P 500 Futures represents 250 indices. The guarantee collateral as of August 2019 is USD 31,500. But if you trade during a day, the guarantee collateral by any contract is USD 500 only. One tick of a ‘big futures’ costs USD 25.
E-mini S&P 500 represents 50 indices. The guarantee collateral as of August 2019 is USD 6,300 if you transfer your position through clearing. One tick of a mini-futures is USD 12.5.
RTS index
Gazprom, Lukoil and Sberbank stocks take 43% of the whole index in aggregate out of fifty stock issuers, which are included into the index. A significant growth of any of these 3 stocks will result in the index growth, which would create speculation opportunities. For example, the movements of a futures on the RTS index and futures on the three basic stocks coincide in a weekly chart. The left grid is the cost of futures on the stock and the right grid is the cost of a futures on the RTS index. This chart shows 83% correlation between the RTS index futures and Sberbank stock futures, which is a very strong connection.
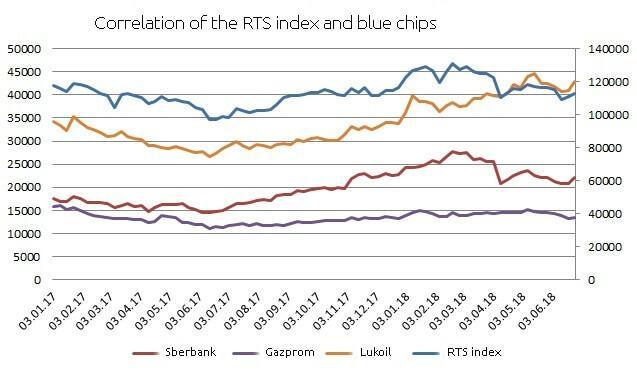
Gazprom, Lukoil and Sberbank stocks take 43% of the whole index in aggregate out of fifty stock issuers, which are included into the index. A significant growth of any of these 3 stocks will result in the index growth, which would create speculation opportunities. For example, the movements of a futures on the RTS index and futures on the three basic stocks coincide in a weekly chart. The left grid is the cost of futures on the stock and the right grid is the cost of a futures on the RTS index. This chart shows 83% correlation between the RTS index futures and Sberbank stock futures, which is a very strong connection.
An RTS index futures is traded on the Moscow Exchange. It is one of the most liquid instruments. The RIU9 guarantee collateral is RUB 20,287 and the price increment is RUB 13.17 as of August 2019.
Is it possible to predict the index?
This question is important for traders and not only traders. We studied this subject and will tell you in brief what we found about the Russian stock market.
There were attempts to predict movements of the Russian stock market in the 2000s with the help of several factors: oil price, GDP and import. The models were linear and didn’t work correctly, since external conditions changed very fast. Moreover, the markets are not efficient and the behavioural factor was not taken into account in the mathematical models.
The number of factors increased and the models became more complex in the 2010s. As of today, there are attempts to predict the stock market movement with the help of neural networks. Neural networks are widely used by foreign financial corporations and even the Central Bank, commercial banks and Taxation Service of the Russian Federation. For example, the banks predict bankruptcies with the help of neural networks.
A possible scheme of a neural network for predicting the RTS index movement could look as follows.
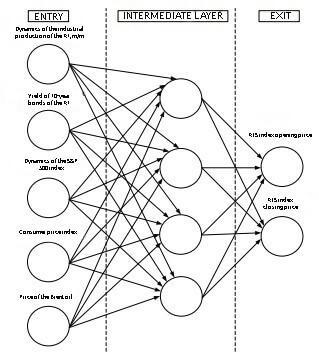
The parameters are selected by the principle of the highest correlation and influence on the Russian stock market. Enthusiasts tried to predict the Moscow Exchange index movement with the help of this neural network. Below is the resulting chart.
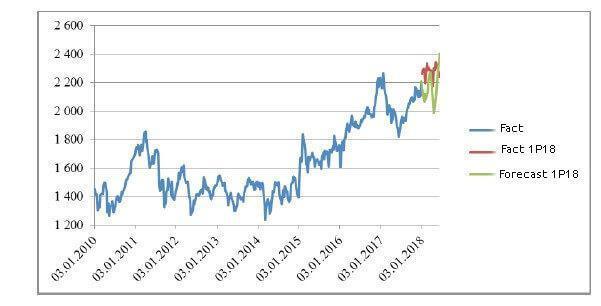
Thus, the index movement could be predicted but only with an accuracy of 1% to 10%. Perhaps, the quality of forecasts would improve with development of neural networks.
Summary
Trading futures on S&P, NASDAQ and other indices becomes more intensive every next year. Download the trading and analytical ATAS platform and check how comfortably you can organize your work in this platform.
We described several trading strategies in the Top-7 Smart DOM setups for trading article. You can find more strategies on our YouTube channel. Subscribe and press the like button. Good luck!

