Features
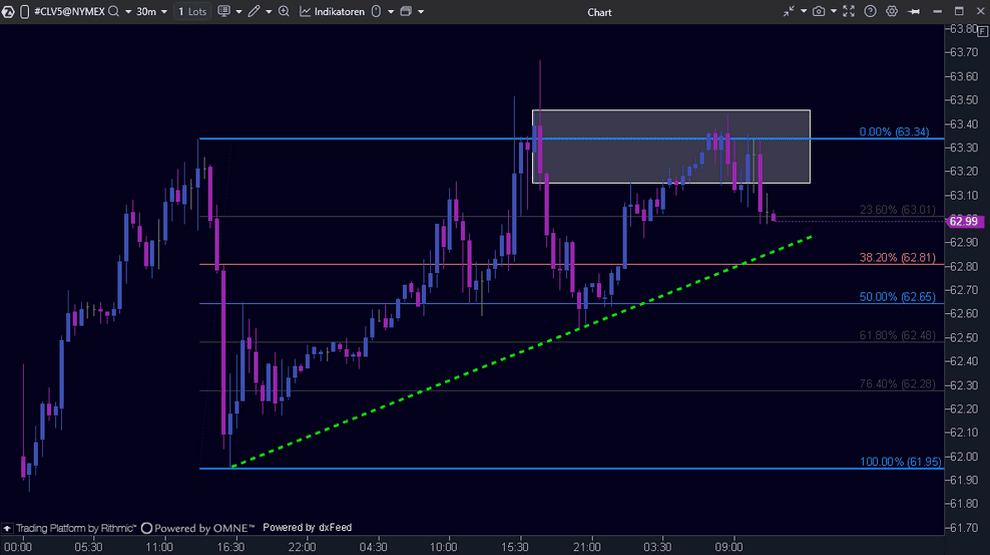
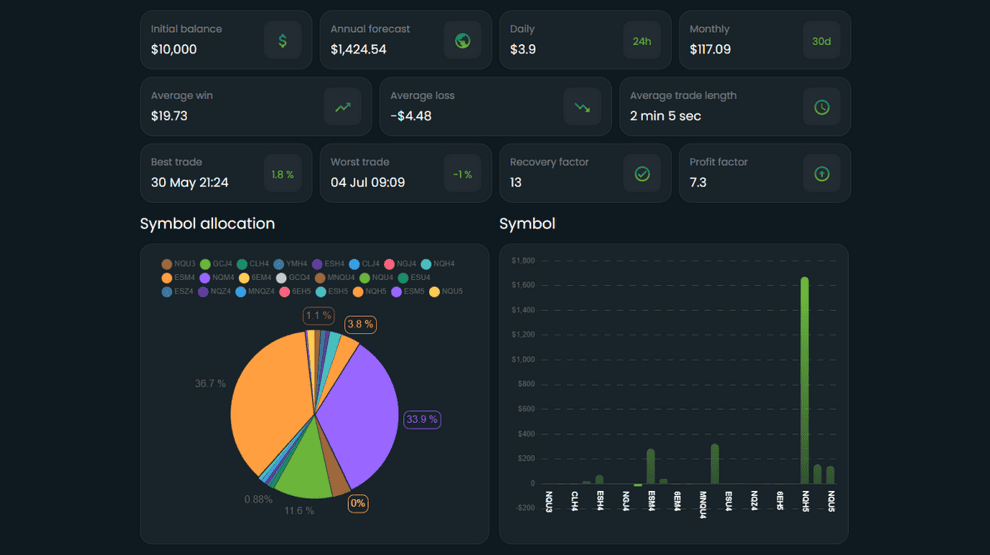
Pro charts, real-time order flow, and smart liquidity modules — everything you need for well-reasoned decisions.
Analyze the market deeper with ATAS - professional software for analyzing financial markets. Footprint charts, order flow and liquidity analysis, advanced indicators with flexible settings - everything you need to make informed decisions. Try it for free!
Available for Windows

Connect your accounts via API to leading exchanges, brokers, and data providers:
• Binance, Bybit, Bitget, OKX etc. for crypto analysis;
• NYSE, NASDAQ, CME, Eurex, etc. for stocks and futures;
• dxFeed, IQFeed, Rithmic, CQG for real-time quotes.

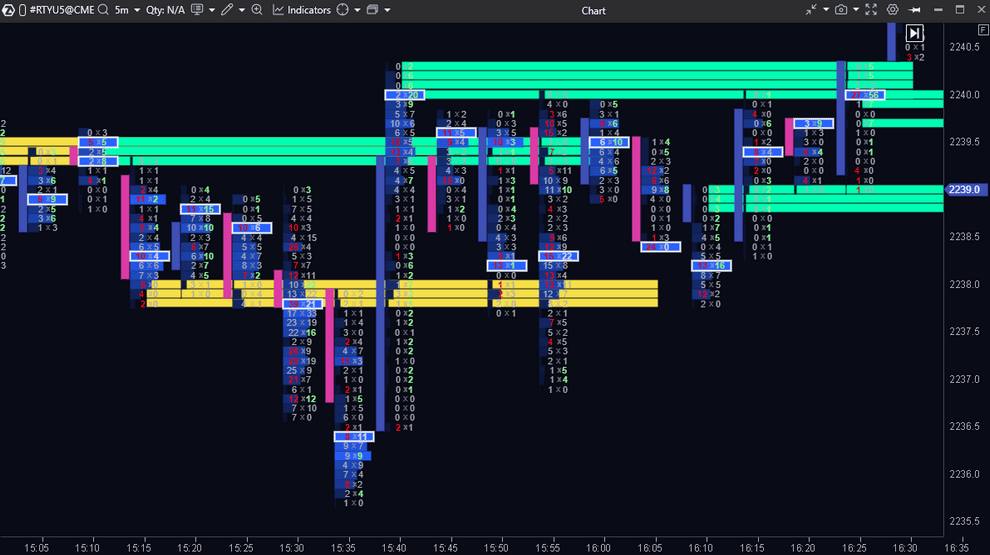
• 400 footprint variants with noise-reduction (Volume, Delta, Tick, Range X/XV/Z/US, Renko, Reversal) + standard time frames.
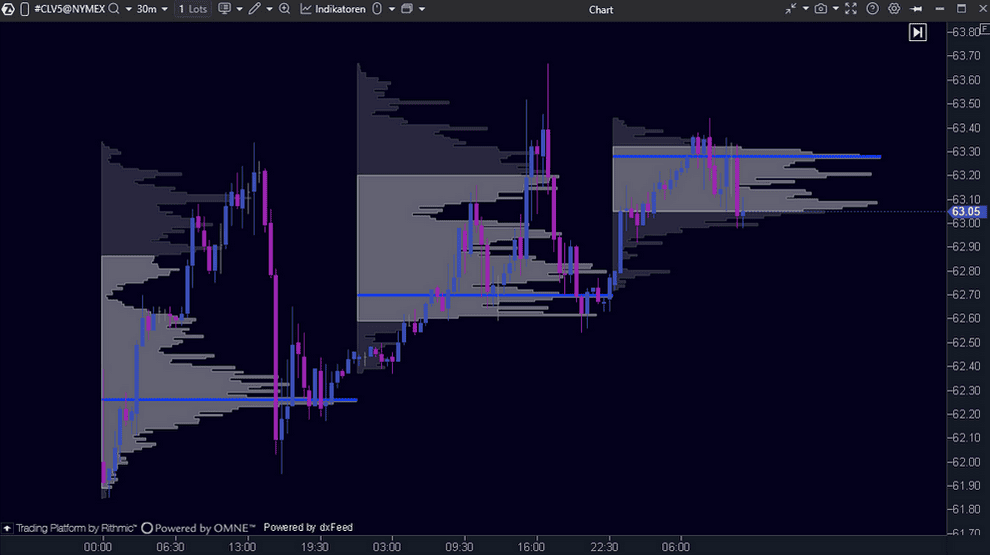
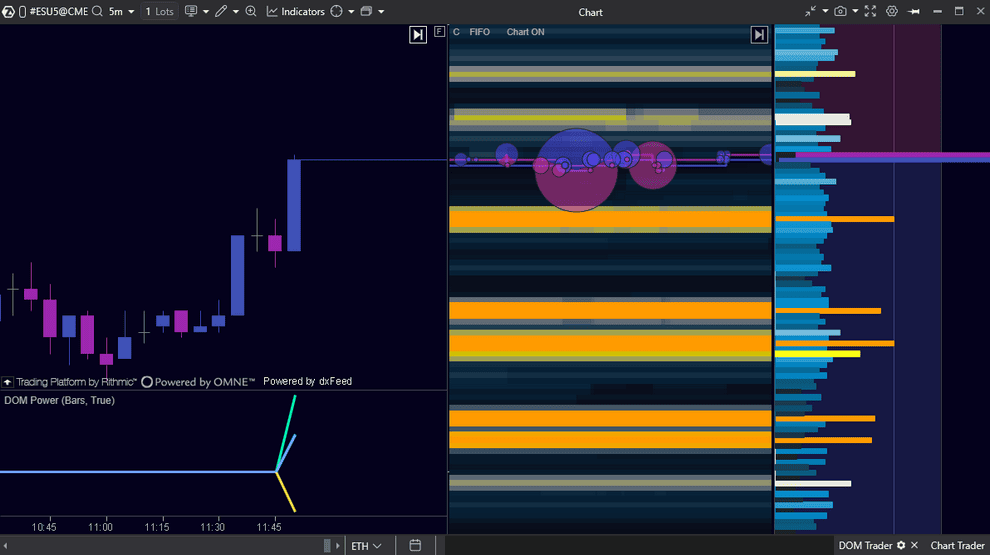
• Liquidity analysis in Smart DOM/DOM Power, Heatmap, Volume Profile, and MBO DOM.
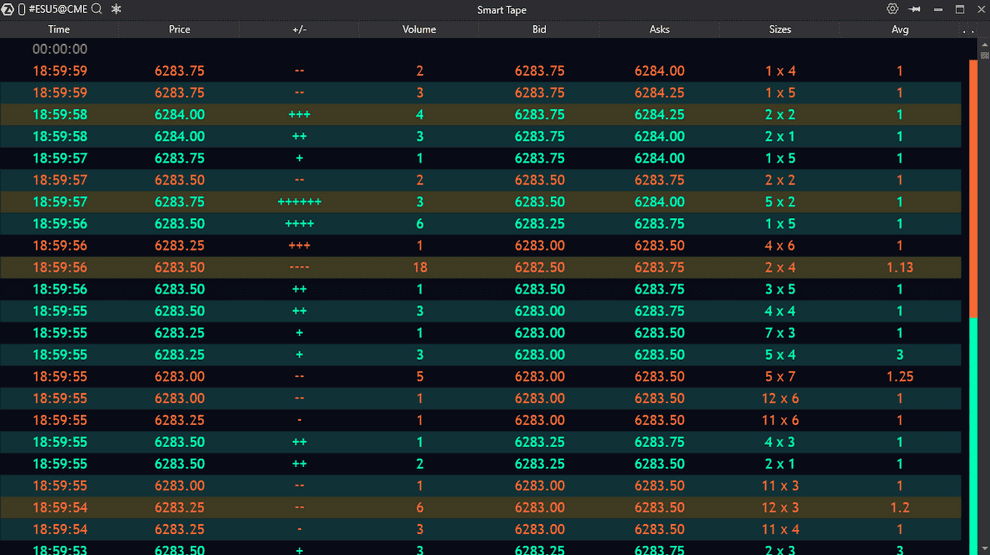
• Unique Smart Tape for a clean read of the true size of aggressive trades.

Tailor the environment to your needs:
• Workspace — your layout with selected charts and modules;
• Layouts — work layers;
• Templates — presets with ready settings.
Customize the news feed, alerts, hotkeys, chart and indicator colors, chart background and heat map gradients, light or dark theme, fonts, language and time zone.

• ‘Learn’ section — a guide to key modules and tools with a library of templates.
• ’Quick Start’ to explore settings and features.
• Webinars, marathons, Knowledge Base, and expert blog.

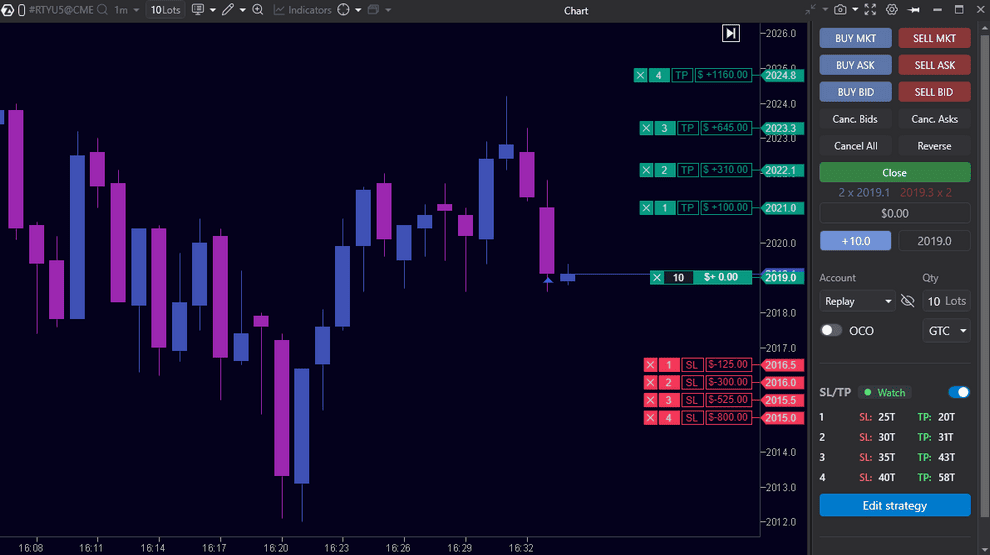
Develop and integrate custom indicators, trading bots, and exit strategies.
Pro charts, real-time order flow, and smart liquidity modules — everything you need for well-reasoned decisions.
ATAS is an advanced ecosystem for financial-market analysis where beginners and professionals feel equally confident.


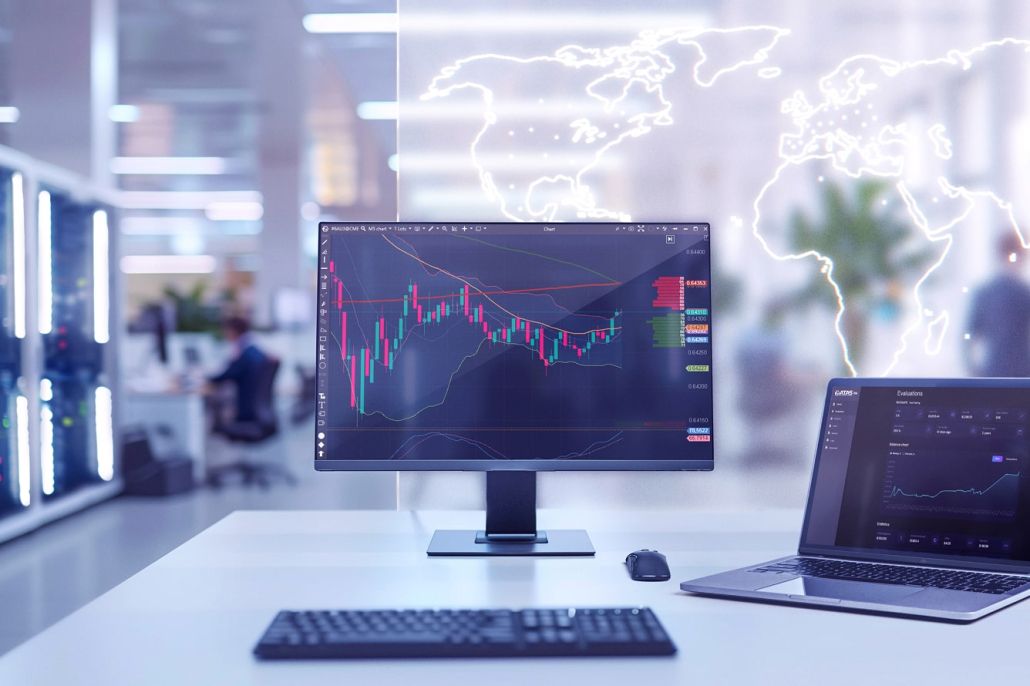
Leave basic technical analysis to beginners. See the real processes inside each candle and the volumes of major players that can influence price movement.
Video title
Enter your email address and we’ll send you a link to create a new password.