Advanced Software for Futures Traders

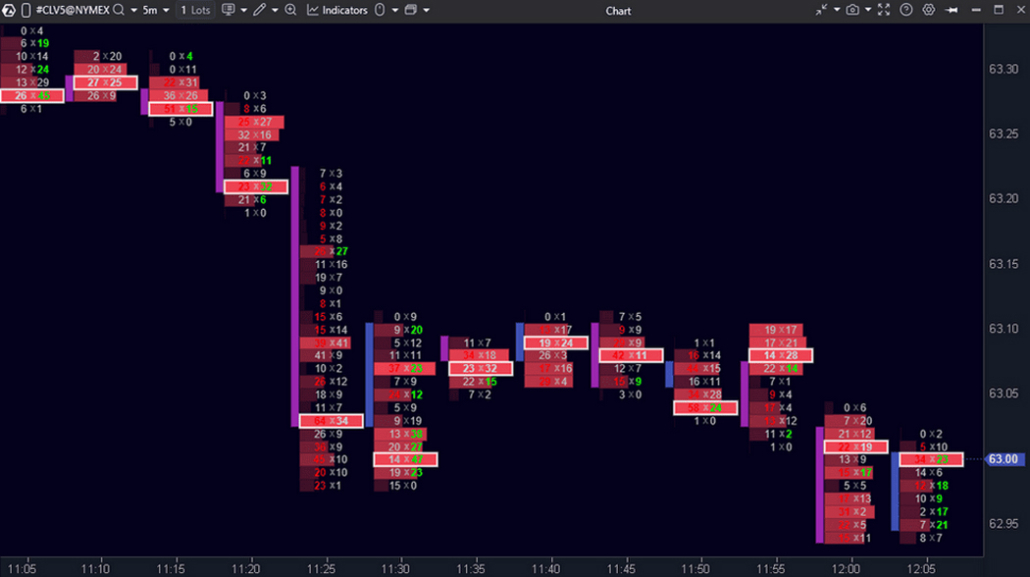
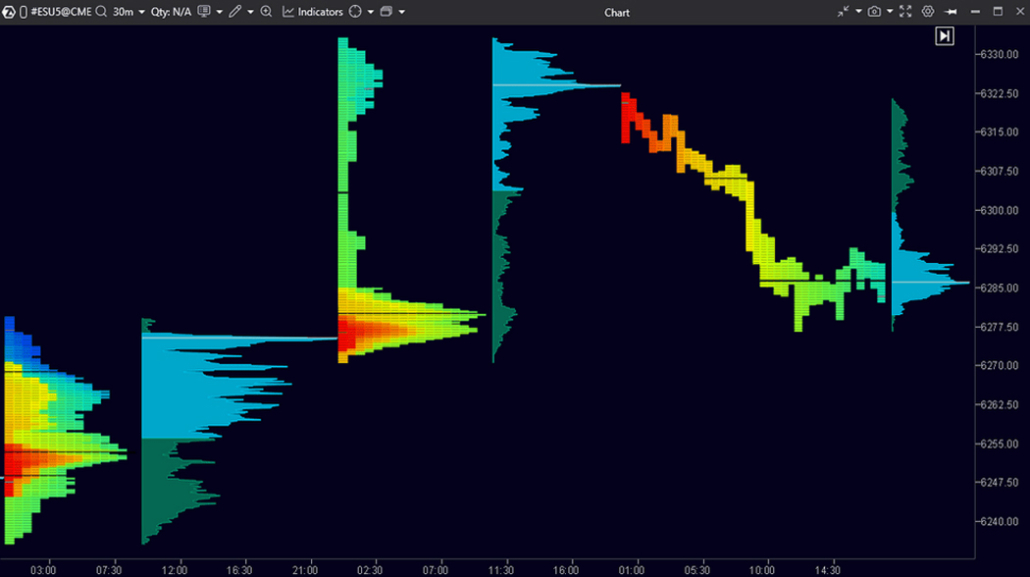
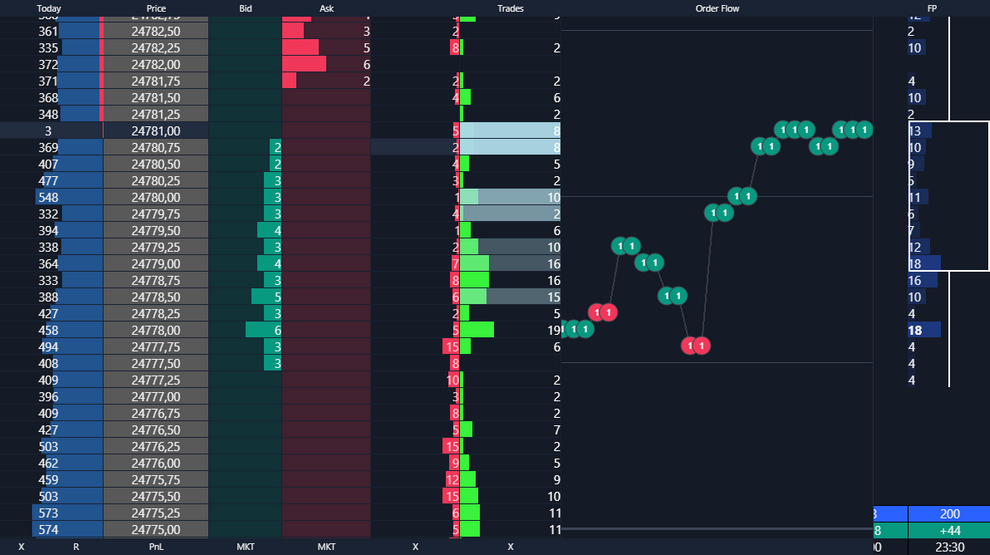
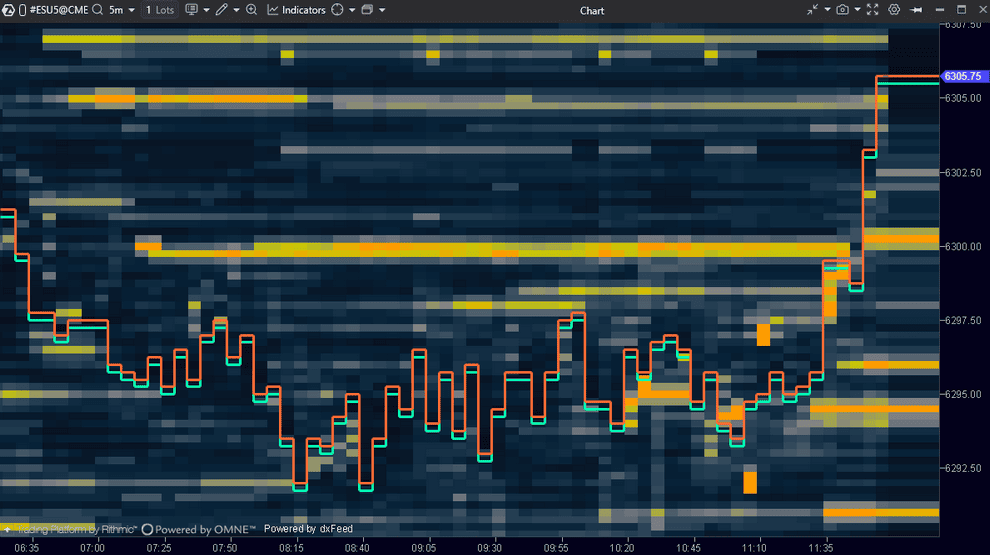
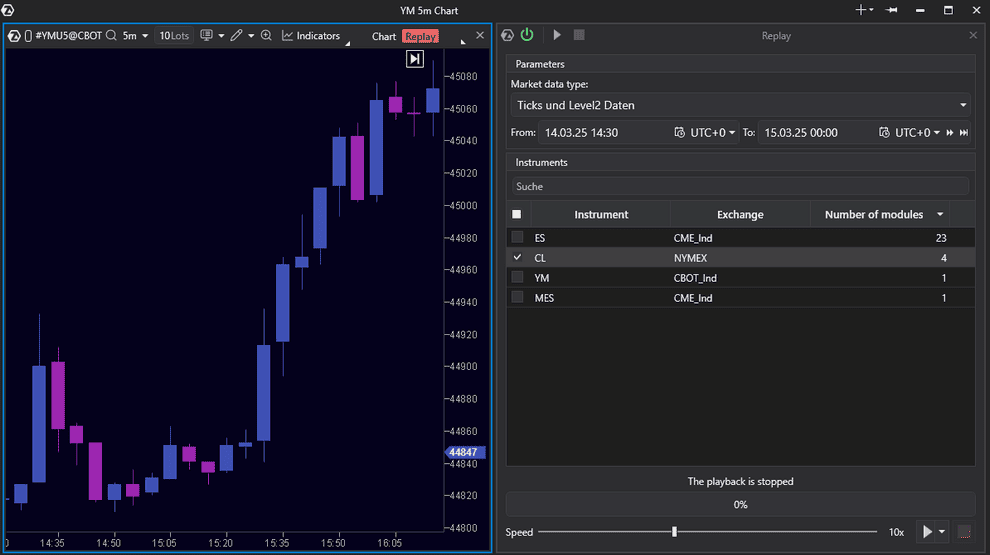
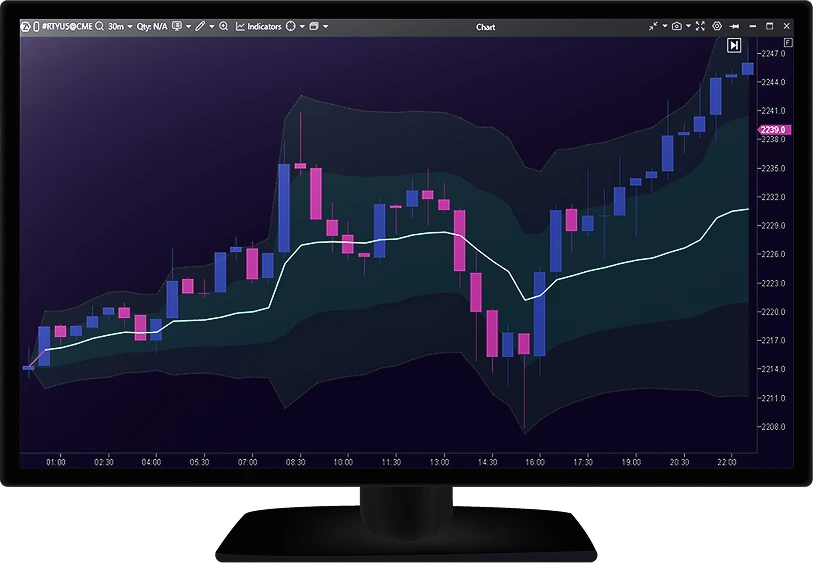
Explore the microstructure of the futures market in detail. ATAS provides advanced tools for analyzing liquidity concentrations, volume distribution across price levels, and emerging buyer-seller imbalances — enabling traders to analyze the market and make informed decisions about short- and medium-term movements.

Try it for free

Why You Need
Professional Analytical Software
for Futures Trading

Most traders only see surface price movements on candlestick or line charts. With ATAS tools, you'll start seeing the market mechanics themselves: volume, order flow, and liquidity that determine price direction. See deeper with our analytical software for the futures market:

Our advanced futures charting software delivers state-of-the-art tools for professional market analysis: Footprint charts, Level 2 data, Market Profile, VWAP, Delta, and more.

Smart Tape

Tracks aggressive trades in real-time, revealing buying vs. selling dominance and unusual activity

Smart DOM

Displays order queue volumes, liquidity levels, and potential manipulation attempts

400+ Footprint variations

Expose detailed activity and imbalances inside every candle

How Traders Get the Most Out of ATAS Futures Software

ATAS visualizes the concentration of large orders, unusual changes in the order book, and interaction patterns between buyers and sellers. This data helps you form hypotheses about major market participants' behavior and identify potential entry and exit levels. ATAS — built for professional decision-making

  • Scalping & Intraday Analysis

    Footprint charts with imbalance detection reveal aggressive buyers/sellers and absorption at key levels on liquid futures and crypto (ES, NQ, CL, BTC, ETH) —providing data for analyzing potential reversals and continuations in real-time

  • Level Analysis & Swing Setups

    Volume Profile and Market Profile & TPO analysis in futures trading highlight value areas, imbalance zones, POC, ledges, single prints, and buying/selling tails — making it easier to plan scenarios, control risk, and identify trend continuation or reversal

  • Understanding Market Drivers

    Smart Tape, Smart DOM, Bid/Ask Tape, and cluster heatmapshighlight iceberg orders, institutional activity, and stop runs, providing context for fast market shifts — showing why the price moved, not just where

Advanced
Futures Charting Software

Footprint Charts – see inside every candle

Go beyond standard candlesticks to explore how trades distribute across each price level. Footprint charts visualize buying vs. selling pressure, absorption, and stop runs — revealing shifts in market initiative. With 400+ footprint futures trading chart variations, you can adapt the view to scalping, intraday analysis, or swing trading. Each style demands a different lens on market microstructure, and ATAS delivers.

Volume Profile / Market Profile & TPO – identify value areas

Profiles reveal where the market has spent the most and least time, creating a clear map of high- and low-volume nodes (HVN/LVN). These structures help outline fair value zones, Point of Control (POC), and liquidity clusters — helping you assess balance vs. imbalance conditions and frame potential scenarios for continuation or rotation.

Smart DOM in ATAS

Smart Tape, Smart DOM, Bid/Ask Tape, MBO DOM — Real-Time Market Depth

ATAS is a powerful futures order flow software that displays how liquidity enters, exits, and shifts in real-time. Smart Tape highlights massive institutional trades, showing when market initiative changes hands. Smart DOM displays order volumes in the execution queue, liquidity levels, and unusual activity that may indicate manipulation attempts. DOM Levels Heatmap identifies liquidity changes and iceberg orders. Depth of Market indicator presents bid/ask volume as a histogram, giving you instant order book balance.

ATAS Heatmap

Heatmap – visualizing liquidity in futures markets

ATAS Heatmap displays DOM Trader and DOM Levels changes as a dynamic background over time. Bright colors indicate high volumes, revealing major participant interest. Dim areas correspond to low order book volumes. This provides instant visibility into hidden support and resistance zones and shows where supply and demand are most likely to interact with price in real-time — information impossible to obtain any other way.

ATAS Market Replay

Market Replay — practice and backtest your strategies on historical data

Replay lets you step back into previous sessions with full tick-by-tick and DOM data. Futures traders use it to study how order flow developed at key moments, refine their strategies, and experiment with execution — all without involving real capital.

240+ Indicators – combine volumetric & technical analysis for futures trading

Track market pressure

Tools like Depth of Market, Delta, CVD, Volume, and DOM Levels show how buying and selling pressure builds, shifts, or fades — connecting liquidity dynamics directly to price movement and revealing real-time supply/demand balance.

Read inside each candle

Cluster Statistics, Cluster Search, Stacked Imbalance, and Big Trades dissect activity at every price level — revealing absorption, aggressive orders, and order-flow imbalances hidden within candle structure.

Futures trading technical analysis

ATAS integrates classic tools like VWAP/TWAP, Bollinger Bands, Keltner Channels, Ichimoku, Pivots, and EMAs for a broader market context. Combined with order flow, you get complete clarity for both short-term scalping and long-term independent position management.

Volume in Futures Trading: The Institutional Footprint

ATAS is the advanced analytical platform for futures traders where volume isn't just an auxiliary metric — it's the primary language of market power. Unlike retail-dominated markets, where volume can be decentralized, futures exchanges are highly regulated, liquid, and controlled by large institutional players. This makes volume analysis critical: it reveals who's moving the market and how they're positioning.

How Volume Can Reveal Major Market Participants' Activity

Major players — banks, hedge funds, algorithmic desks — cannot completely hide their large orders; they leave volume footprints. ATAS tools are designed to highlight these critical moments

  • Accumulation and Distribution

    Volume clusters and Point of Control (POC) show where institutional capital builds long positions (accumulation) or distributes short positions

  • Liquidity Concentration

    High-volume nodes (HVNs) identified by Volume Profile mark price levels with the most trading activity — areas where major interest concentrates

  • Algorithmic Traces

    Smart Tape, Smart DOM, and Cluster Search spot footprints of high-frequency algorithms and iceberg orders, providing context for sharp price rotations

Filter False Breakouts

False breakouts are common in liquid futures markets — typically from liquidity sweeps (stop runs) or level testing. Relying on price action alone leads to poor entries. Volume gives you the filter you need:

  • Confirmation Rule

    Genuine breakouts backed by institutional conviction show significant volume and delta surges

    ATAS visualizes a full range of volumetric data in real-time, from aggressive trades and deltas to changes in the stack and liquidity concentration zones.

  • Caution indicating

    Breakouts on low or declining volume indicate weak commitment — usually a liquidity grab or fake-out

    This allows traders to better understand market dynamics, distinguish between true and false movements, and make informed trading decisions.

The Professional Trader's Advantage

Integrate volume and order flow into your analysis to move beyond basic technical indicators and gain a more substantial market advantage:

  • Enhanced Precision

    Our tools uncover volume dynamics that help traders validate their own strategies and refine decision-making

  • Deeper Context

    Gain a clearer understanding of the potential reasons behind price movements, providing insight into the dynamics of supply and demand

  • Smarter Risk Management

    ATAS helps you find hidden liquidity, which allows you to place stop-losses behind strong levels instead of random locations

FAQ

  • Combine volume and order flow with traditional technical analysis. This hybrid approach reveals institutional activity and liquidity dynamics — giving you a decisive edge over price-only traders.

  • Yes. ATAS connects to major global futures exchanges, including CME Group, Eurex, ICE Futures, and more, allowing you to analyze and execute trades independently across the full range of contracts (ES, NQ, CL, 6E, etc.). How it works

  • Technical analysis involves overlaying graphical objects and simple indicators (trend lines, channels, VWAP, EMA, etc.) on the price chart. In ATAS, one of the best charting software for futures trading analysis, you can enhance classical technical analysis tools with advanced indicators and modules for analyzing volumes and order flow (Delta, CVD, Volume Profile, etc.)—gaining more information to build trading hypotheses.

  • ATAS provides 240+ indicators combining classic technical tools (VWAP, EMA, Bollinger Bands) with proprietary volume analysis. Essential for futures traders: Depth of Market, Delta, Cluster Statistics (Footprint), Stacked Imbalance, and Big Trades — all designed to dissect order flow and volume at every price level.

  • Yes, we offer a 14-day free trial with full access to all features and tools. Please note: To view real-time futures data during the trial, you must connect your account with a supported broker or data provider (Rithmic, CQG, etc.) from whom you obtain the necessary market data subscription.

  • The Market Replay module lets you download and replay historical sessions tick-by-tick, including full DOM (Depth of Market) data. This enables backtesting strategies and practicing execution under real market conditions — without envolving your capital.

  • ATAS offers four subscription levels:

    Start – free with a 15-minute delay of futures data;
    Plus – for working with cryptocurrency futures:
    Pro and Ultra – for advanced real-time analysis of traditional futures (CME, Eurex, ICE, etc.).

Ready to Analyse Markets with an Institutional Edge?

Stop relying on basic price charts. Unlock the microstructure of the futures market with ATAS and see the forces of supply and demand in action. Start your free trial now for immediate access to Footprint Charts, Smart DOM, Volume Profile, and 240+ advanced analytical tools.