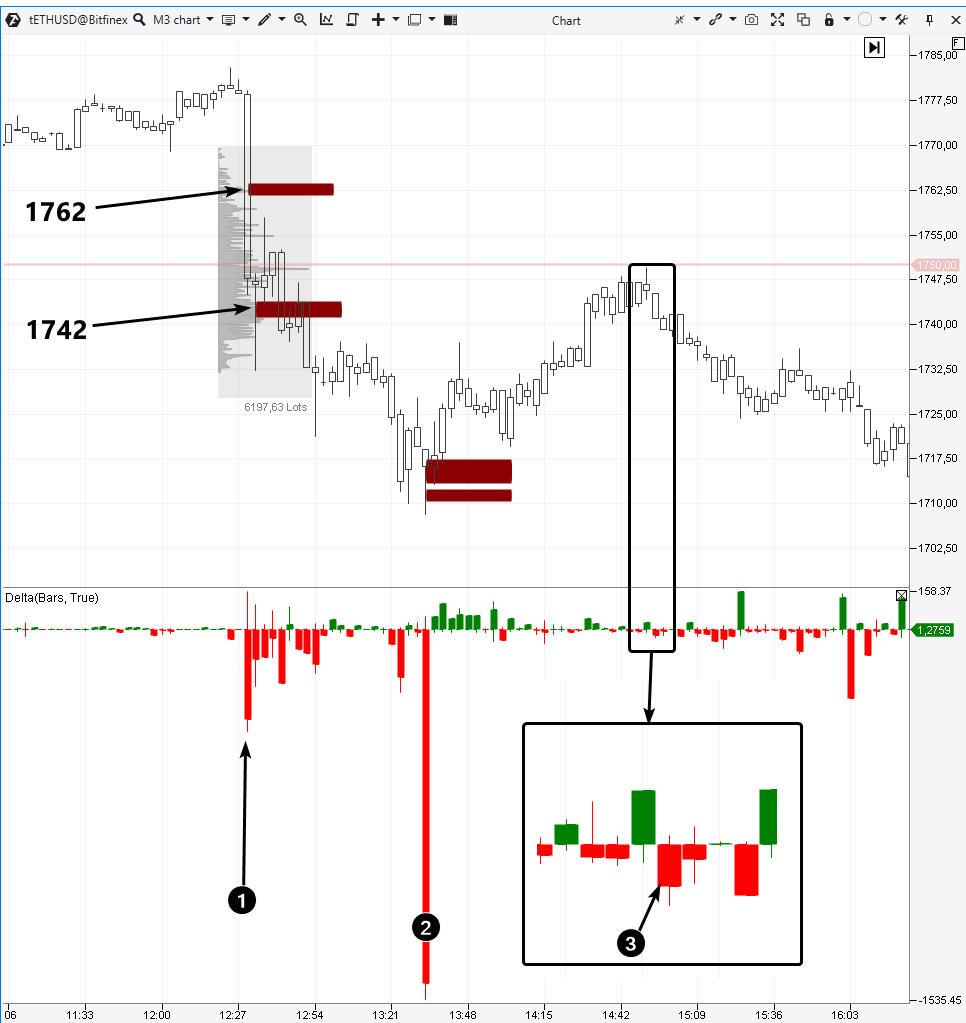
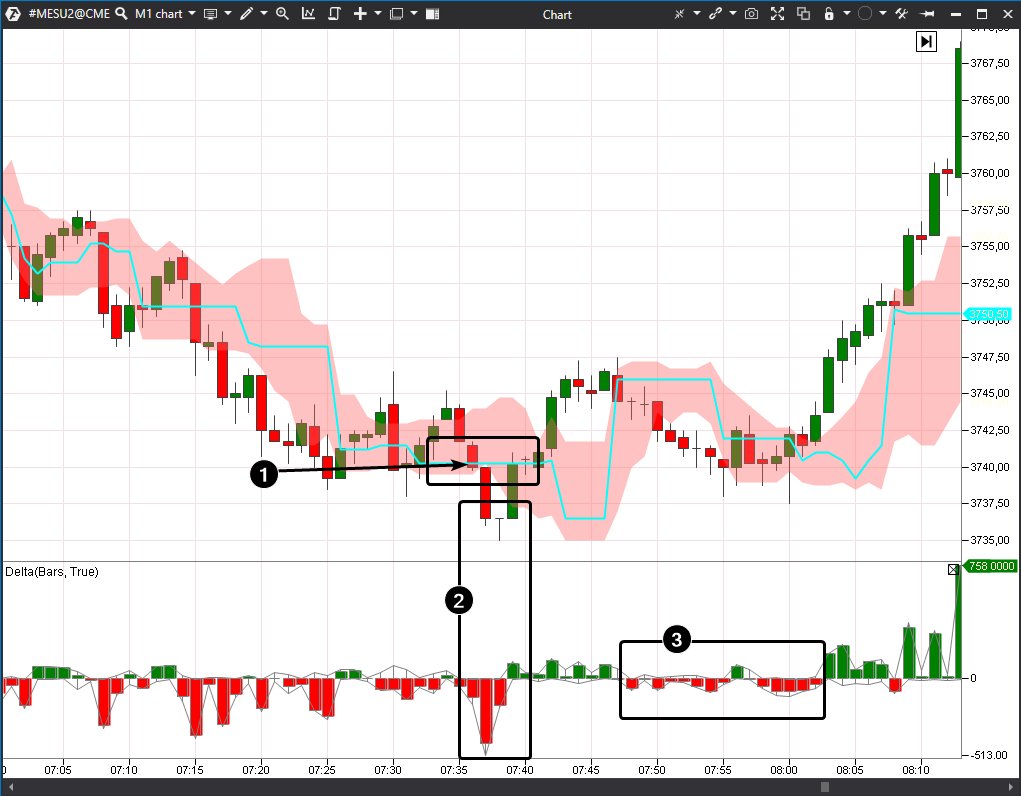
A sharp spike in the negative delta shows that sellers are highly active. A wide bearish candle is forming on the price chart with a close below the 1750 level. The imbalance indicator shows a significant predominance of the sellers at the 1762 level. The signal of the imbalance indicator at the 1742 level most likely indicates that the price has fallen into the accumulation of buyers’ stop losses which were set under reliable support of 1750.
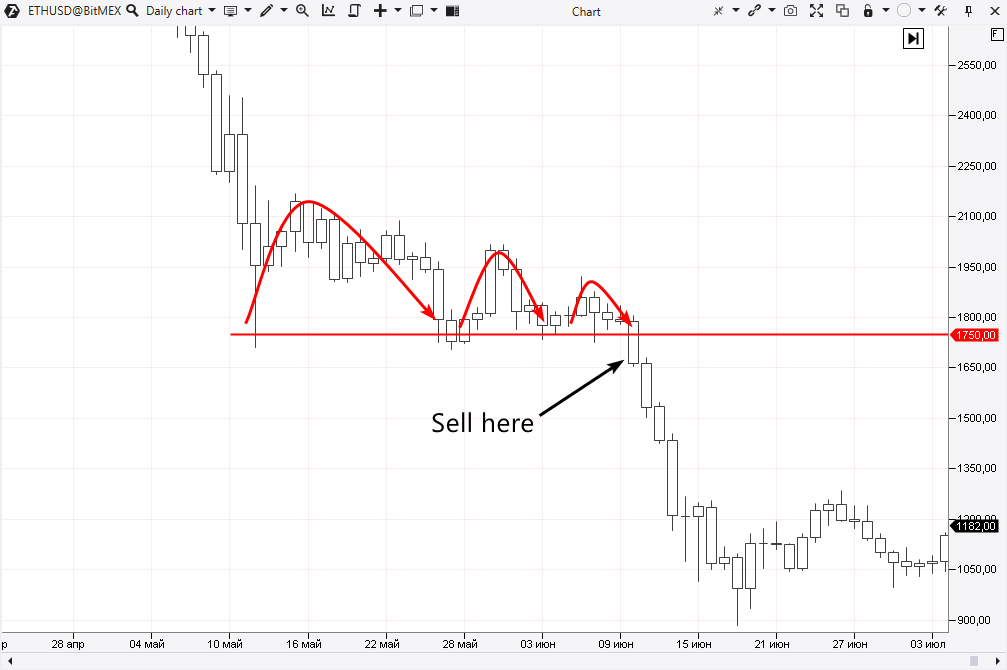
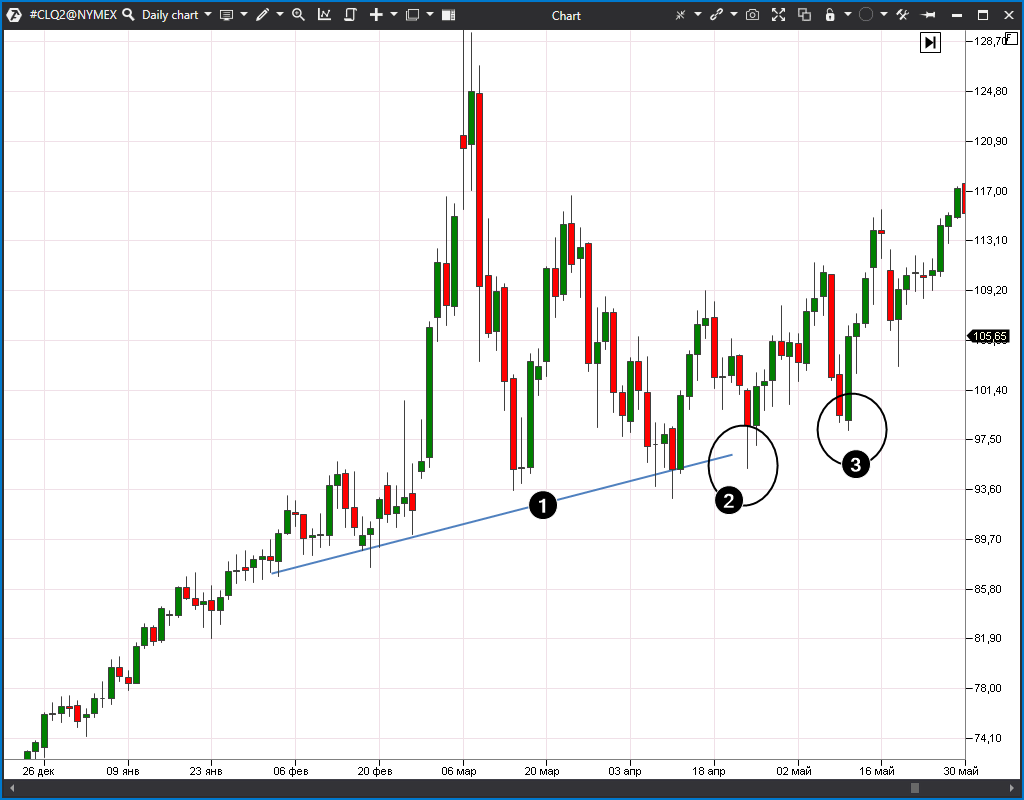
Seeing this situation and keeping in mind the dead cat pattern on the daily chart, you can open short market positions. By doing so, you will act in harmony with the market sentiment which is clearly bearish (you do not even need to know the news that caused the selling wave, although such movements are not always caused by the news). There are compelling reasons to set a protective stop-loss above 1762.
Later, there is an intraday panic indicated by a huge negative delta (2). Note that it is followed by several consecutive positive delta candles, which shows a change in the market sentiment to bullish. This change was the start of a short-term corrective rally.
Let’s say you did not enter a short market position directly during the breakout. You get a chance when the price rises above the 1742 level. Notice that the price rise is quite unstable when it approaches the psychological 1750 mark. Now this level, which worked as support, should create resistance to rising prices (more details in the article about Mirror Levels).
In the context of the article about bounces, it should be mentioned that we are talking about entering a short position on a bearish bounce off a resistance line.
- If you act according to the first approach (forestalling), you open a position seeing how the price rises in an unstable way to the resistance level, but you still do not have facts indicating that a bounce has occurred.
- If you act according to the second approach, you need confirmation. The very first appears on the delta indicator (we zoomed it so that you can see this moment better). The indicator shows a sharp change from positive to negative delta (3). The price acts accordingly and declines from the open to the close. This small increase of sellers’ activity was the beginning of a new wave that lowered the price of ETH to 1660 on the same day.

