How to find strong intraday levels for successful trading
This article raises the issue of the significance of dynamic trading systems, which independently adapt to the market. How to develop them?
We will try to demonstrate it with the use of 2 indicators. The Dynamic Levels indicator will find strong dynamic intraday levels, while the Cluster Search indicator will show traps for sellers and buyers. In the event when their signals coincide, it points to a prospective entry into a position.
Read in the article:
- What a dynamic market is.
- Well-ordered market in the Range US chart.
- Dynamic levels with the Dynamic Levels indicator.
- Traps for buyers and sellers with the Cluster Search indicator.
- How to trade intraday levels with traps for buyers and sellers?
- Conclusions. What to do in practice?
Dynamic market
Let’s start with an example from sports. A soccer coach puts players at certain positions, however, he replaces players in the course of the game, changes their positions and adjusts his tactical scheme. If a coach doesn’t adapt to an ever-changing situation in the field, it will be difficult to win the title.
Financial markets are also an ever-changing dynamic system and a trader should act as a good soccer coach acts. He should analyse the current market and adapt his trading systems to endless changes.
It is good if a trader takes this issue into account immediately when creating trading systems. In such a case they will be dynamic and will adapt to the changing market volatility and dynamics.
Trading systems with strict parameters will hardly work in a stable manner for a long time. For example, a fixed stop loss in ticks can work properly in a low-volatility market, but will be activated too often when volatility increases.
That is why a dynamic market requires dynamic trading systems. How to build them?
Well-ordered market in the Range US chart
The trading and analytical ATAS platform contains many useful indicators and trading exchange chart types, which allow working more efficiently in the ever-evolving market.
The first instrument, which will help you to see the dynamic market structure better, is the Range US chart. The goal of the range charts is to remove insignificant price fluctuations and to show important movements only. Main tendencies of the current market are better seen in the range charts. That is why, the range charts can be good assistants during intraday trading.
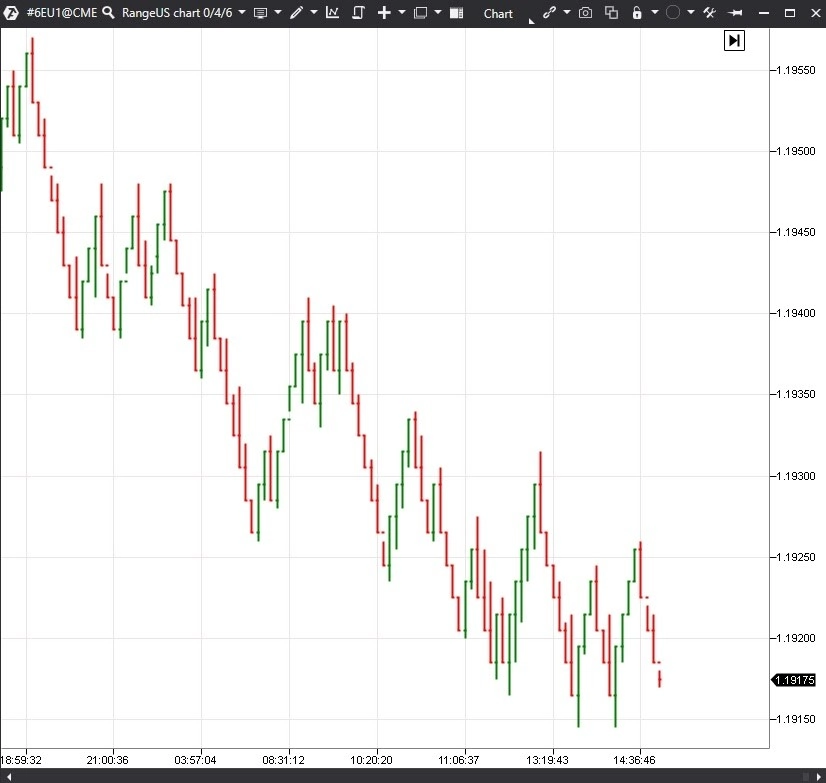
Let’s consider one example of the Euro futures (6E) from the CME (Range US chart 0/4/6):
The range chart removed excess market noise and showed the down movement more clearly.
Trading by a trend is always more efficient due to a big trading potential, and the range charts can properly show dynamics of a trend change in the market. That is why we will use this chart type in this article for analysing the dynamically changing market.
Dynamic levels with the Dynamic Levels indicator
A dynamic trading system requires an indicator, which can build dynamic levels in the automatic mode. The Dynamic Levels indicator, which builds the maximum volume level and value area for a set period in the dynamic mode, will be good for this purpose.
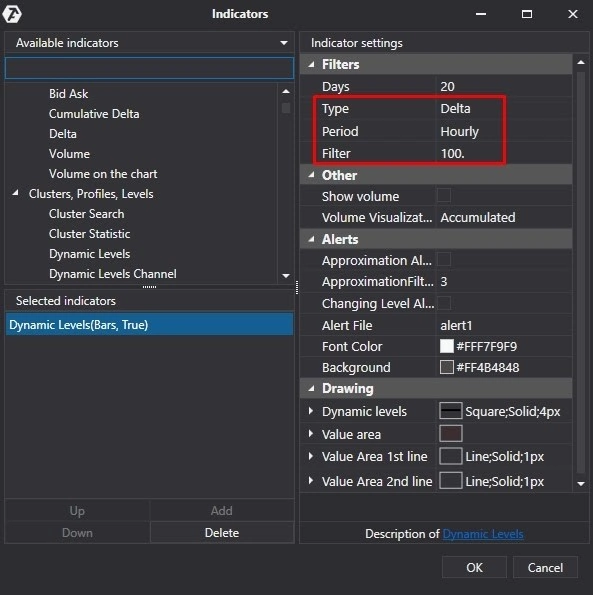
This indicator has interesting filters, which will help to adapt our trading system to the market even more efficiently. Let’s consider some of them:
- You can select Delta in the Type section to see predominance of buyers over sellers or vice versa.
- You can select Hourly in the Period section to build intraday levels.
- You can set 100 in the Filter section to see only the levels of significant predominance by Delta.
- You can remove the Value Area levels and the Value Area itself and mark only the Dynamic Levels indicator level.
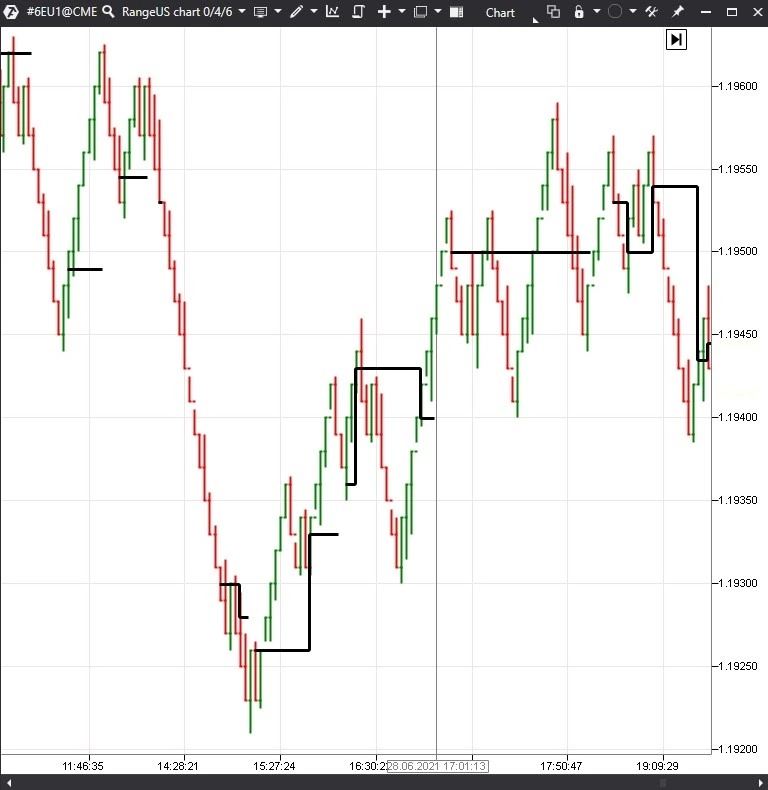
In the result we will get the following picture in the Range US chart:
The Dynamic Levels indicator with these filters showed significant intraday levels, which can be used in trading. Weak levels have been excluded.
In order to find optimum entry points, let’s consider so-called traps for sellers and buyers, after which interesting movement may take place.
Traps for buyers and sellers with the Cluster Search indicator
When buyers or sellers get into a trap, the market moves against them. It gives a trader, who noticed this situation in time, a possibility to make profit on this movement.
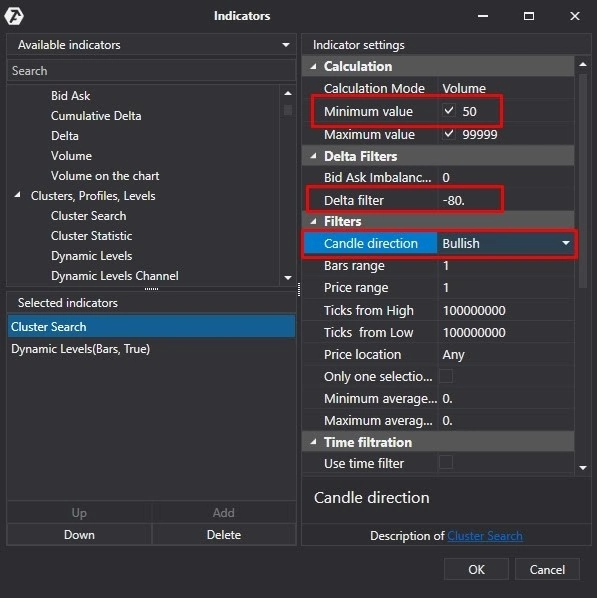
Let’s look for traps for buyers and sellers with the help of the Cluster Search indicator. This indicator also has interesting filters, which can help in it. Let’s consider, first of all, settings for the search of traps for sellers:
- You can set 50 in the Minimum value section.
- You can set -80 in the Delta filter section to see places of active sells.
- You can select Bullish in the Candle direction section, since we look for the traps for sellers and need bullish candles.
- This cluster can be highlighted red.
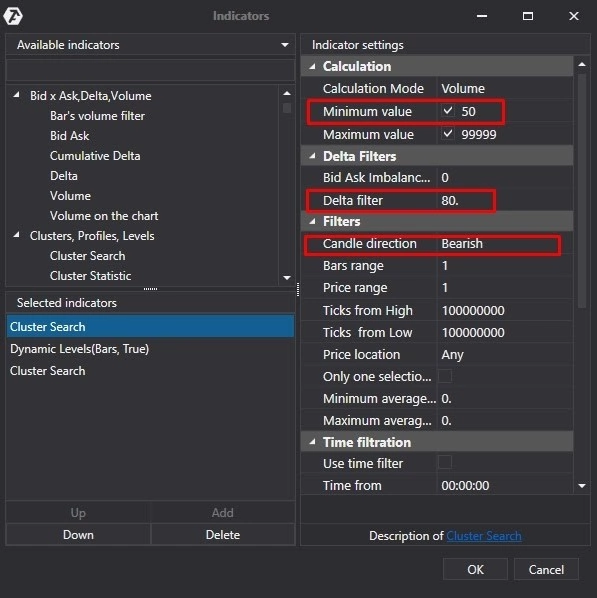
Let’s consider settings of the Cluster Search indicator for the search of traps for buyers:
- You can set 50 in the Minimum value section.
- You can set 80 in the Delta filter section to see places of active buys.
- You can select Bearish in the Candle direction section, since we look for the traps for buyers and we need bearish candles.
- This cluster can be highlighted green.
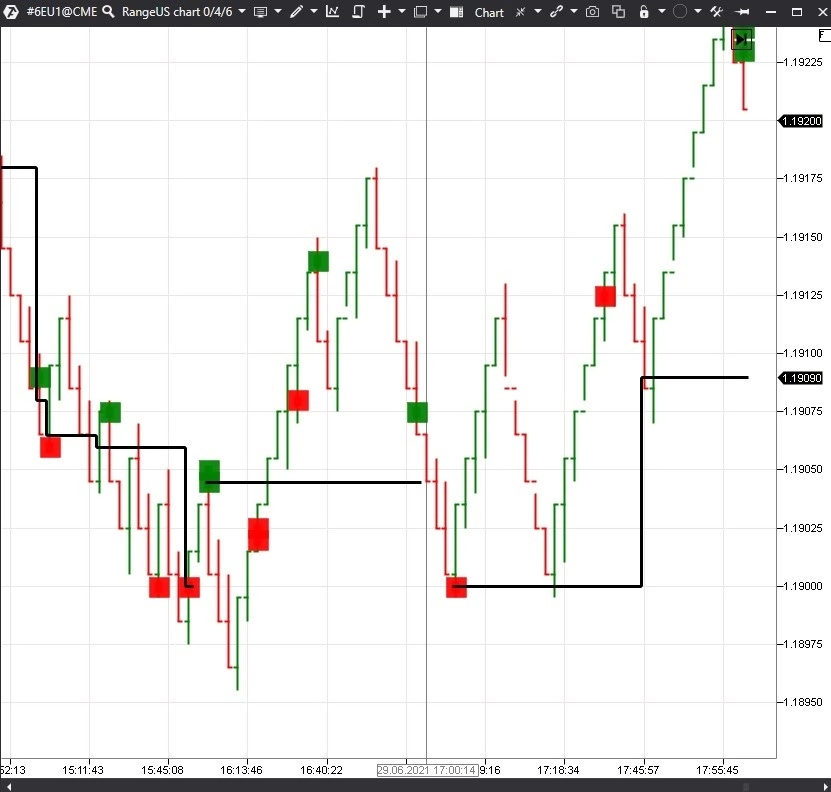
In the result we will get a chart, which shows places where buyers or sellers got into difficulties:
Now let’s discuss how this understanding can be used in trading.
How to trade intraday levels with traps for buyers and sellers?
You can look for an opportunity to buy, if a strong intraday level coincides with a trap for sellers.
You can find good entry points at the end of down movements, since it gives a better price and higher profit potential.
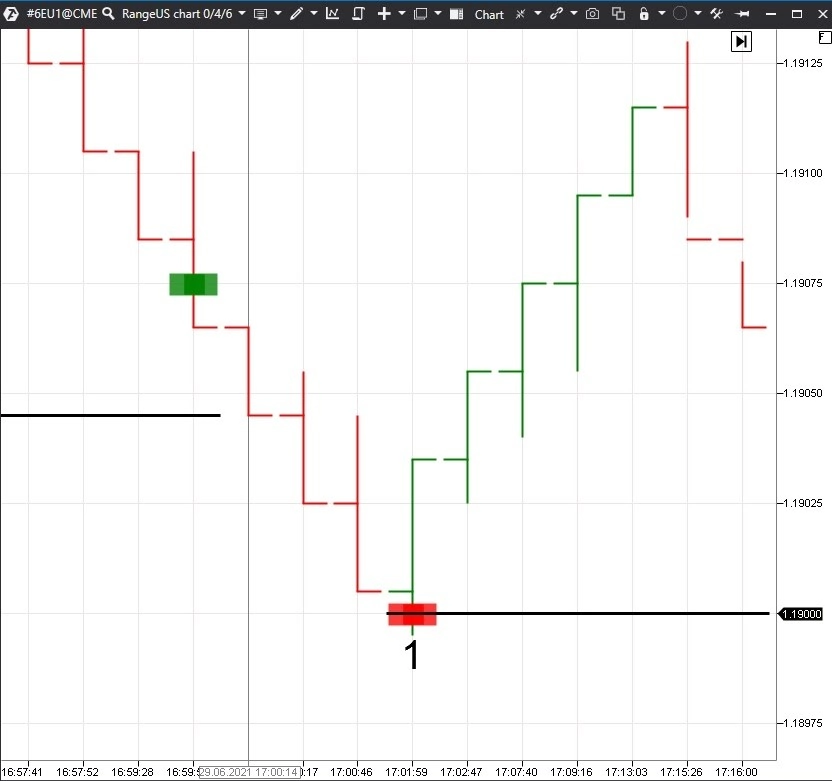
Let’s consider an example of an entry for buying:
The Cluster Search indicator showed a trap for sellers at a round level in point 1. This cluster coincided with the Dynamic Levels indicator level. It gives a possibility for the search of an entry point for buying. A stop loss can be posted behind the signal bar low and can further accompany the trade behind the lows of new bars.
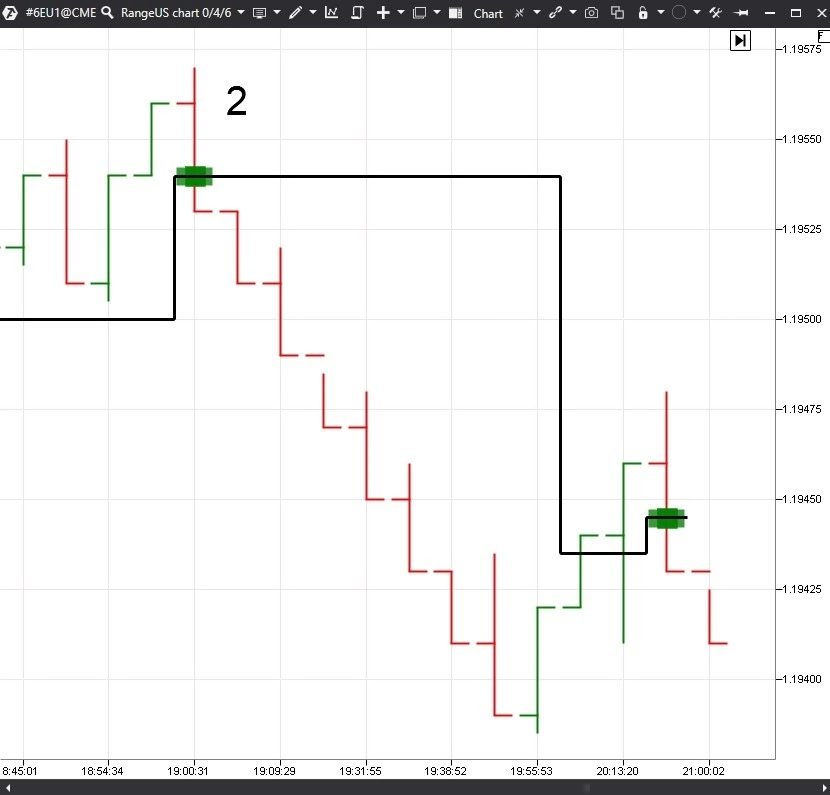
You can look for an opportunity to sell when a strong intraday level coincides with a trap for buyers. Good entry points for selling can be found at the end of up movements, since it gives a better price and higher profit potential.
Let’s consider an example of an entry for selling:
The Cluster Search indicator showed a trap for buyers in point 2. This cluster coincided with the Dynamic Levels indicator level. It gives a possibility to look for an entry point for selling. A stop loss can be posted behind the signal bar high and accompany the trade further behind the highs of new bars.
Since it is the intraday trading, the price movement impulses are short-lived, however the risks are low. There will be more signals if you set charts by several instruments.
If you do not want to monitor the chart all the time, you can set up Alerts, which will inform you about potential market entry signals, in the Cluster Search indicator. Thus, intraday trading will require less effort.
Conclusions. What to do in practice?
Market is a complex dynamically developing system. That is why, only dynamic trading systems, which can adapt to the changing market, can successfully trade in the market. You can use the following instruments for building a dynamic trading system:
- Range US chart. It is good at showing a trend market structure and filtering out the excess trading noise.
- The Dynamic Levels indicator, which can build a strong dynamic intraday level with the help of filters.
- The Cluster Search indicator, which helps to find traps for sellers and buyers with the help of filters.
Download the trading and analytical ATAS platform in order to check how its indicators can be used for building a flexible trading system, which allows trading in the dynamic market more efficiently.
Information in this article cannot be perceived as a call for investing or buying/selling of any asset on the exchange. All situations, discussed in the article, are provided with the purpose of getting acquainted with the functionality and advantages of the ATAS platform.

