Useful resources for trading currency pairs, stocks and futures
In this article, we will review useful resources, which will be of service when trading stocks and futures. They will serve as a source of data when planning the trading, studying the market and in everyday activity.
First, let’s put the existing types of resources in order:
- Information resources.
- News resources.
- Statistical resources.
- Analytical resources.
Further on, we will consider them in more detail and provide links and examples.
Information resources
Information resources provide information about specific features of traded instruments, guarantee collateral, commission fees, risk parameters and number of open positions in the forward markets.
Exchange using this link: https://www.moex.com/en/
Enter the code of the instrument you are interested in into the search box and the system will give you all the necessary information about the contract.
The Moscow Exchange, as well as any other exchange, pays special attention to risk management. For this purpose, the exchange has rules of identifying the participant position risk by the principle of portfolio margining. The exchange participants could manage their collateral with the help of individual risk parameters, risk balancing (netting) between the forward and currency markets and also collateral replacement.
Understanding of the specific features of the Moscow Exchange risk management allows to build the methods of identifying the priority movement by stocks and futures into your system of the price forecasting.
Let’s briefly touch this issue, since a full-scale study requires an individual publication.
The National Clearing Centre JSC (NCC) performs the functions of the central counteragent on the exchange in accordance with the set regulations of the Russian Federation. NCC uses collateral funds of the clearing participants, in other words – guarantee collateral, as a collateral for performance of obligations.
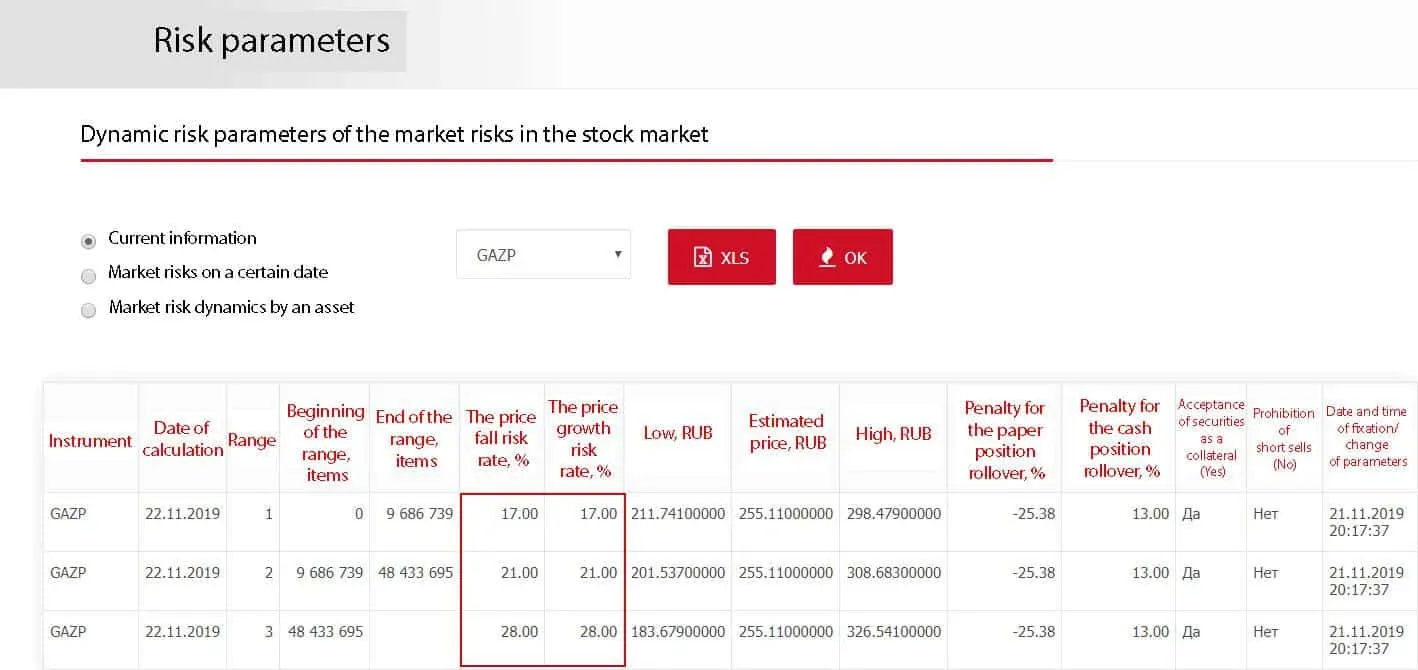
NCC calculates and sets minimum initial margins of collateral rates and limits of concentration in the forward and stock markets for each share or futures. You can find such information in the following resources:
For example, the minimum initial margins of the collateral rates for an SI futures contract are 6, 8 and 10%.
For the Gazprom PJSC stock they are 17, 21 and 28%.
Is it complex? Let’s see what it is and how to use it in trading.
Every trade on the exchange influences the price change risk. A trade volume could increase risks both of the central counteragent and other market participants. If certain groups of the market participants accumulate their risks, at a certain moment they will be required to deposit additional funds to secure their positions. Otherwise, a participant will receive a margin call.
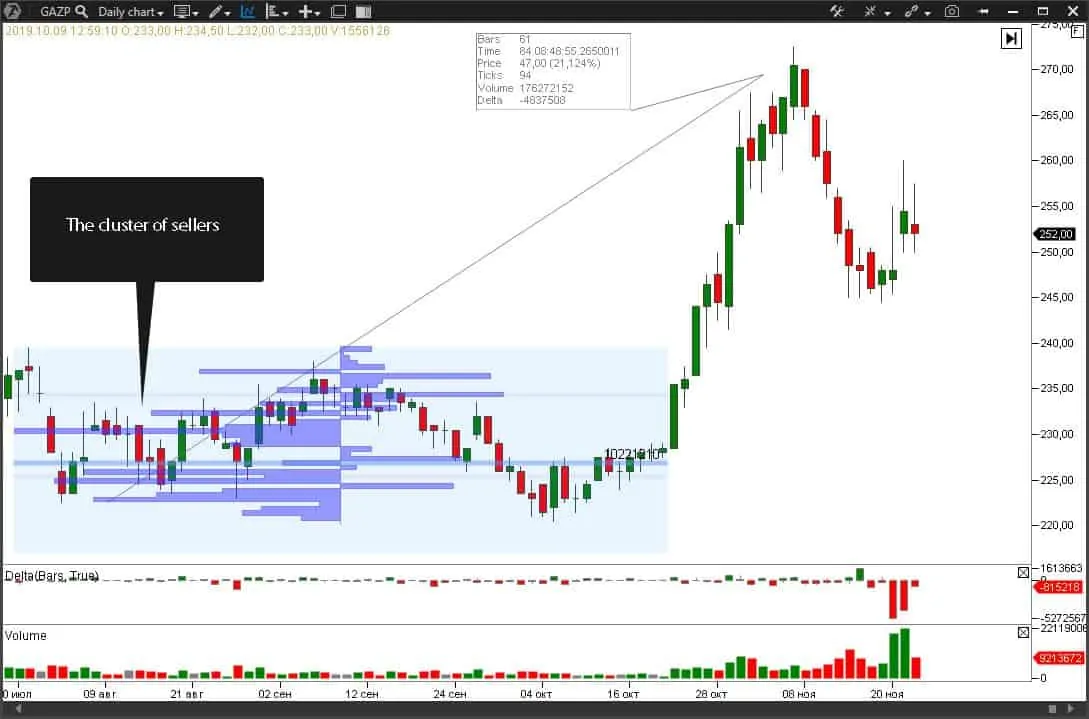
In order to apply it in your trading, we recommend you to look for stocks, in which the price stayed within a range for a long time. For example, Gazprom PJSC stock. The accumulation range stays within RUB 220 and 240.
The Market Profile, set by the delta, shows us that namely the aggressive seller was active during the accumulation, since the delta is mainly directed to the negative side. The price action tells us that there is a long-term stock accumulation, the lower range of which is rather obvious.
We may identify the price, where the maximum volumes of trades took place, if we use the Market Profile. We add risk parameters values to the received price and get the levels of the assumed stock growth after exiting the accumulation area. By now, the stock reached 2 boundaries of risk parameters in 21% and the probability of the stock growth up to the 3rd boundary of risk parameters in 28% is a preferable scenario under such circumstances.
News resources
Some events exert such a strong influence on the exchange instrument price quotes that traders just cannot ignore them.
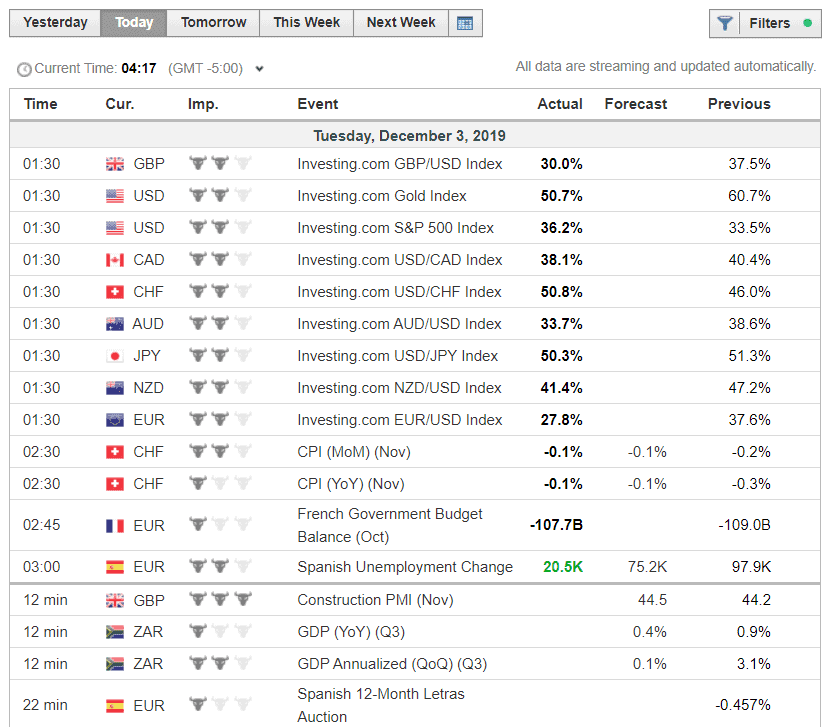
For example, the data on oil and oil product reserves or news about unemployment in the US result in splashes of volatility in respective markets. That is why you should be prepared for future events beforehand. Economic calendars will help you in this. There is a multitude of them and, in general, they are all similar. We will show you one through the example of investing.com.
Use this link to open the calendar. The provided information allows planning your trading with consideration of the forthcoming events and also reviewing the whole history of statistics with the goal to assess the degree of influence of the published data on one or another instrument.
Moreover, the calendar could be set to filter out various data: by countries and by dates. For example, you can track forthcoming holidays by all countries of the world, follow the company reports, monitor charts and sizes of dividend payments, get ready for the forthcoming IPO and track the terms of the futures circulation.
Analytical resources
Do you track the state of the debt market in Russia? Go here: https://www.rusbonds.ru. You can find here the current and historical information about the state, municipal and corporate debts in Russia.
The calendar of bond offering, news of the bond market, bond payments, debt market indices and many other things are available on the rusbonds web-site.
Visit the respective section on the CME web-site – Commitment Of Traders (COT), which is also called the Market Sentiment – in order to track directions of the major market participants, hedge funds, institutional investors, dealers and manufacturers.
The Barchart resource offers similar information about the market sentiment but in a different form:
This resource also offers all the information about options (what options are) on stocks of American companies, such as:
- news of the options market;
- activity by options;
- data about volatility of options;
- open interest change;
- calculation of the probability of success of various option strategies (sells of covered calls, sells of uncovered puts, bearish and bullish call spreads and long and short straddles and strangles).
The Timingcharts resource allows to combine the instrument chart and COT report in one screen.
In the event you monitor the energy resources market, pay attention to this web-site: https://tankertrackers.com.
This resource provides detailed data about transportation routes of export of crude oil and natural gas liquid from the countries-suppliers. The data include: the vessel name and IMO number, number of barrels, ports and countries of departure and arrival and the date of departure. It also contains an analysis of the Automated Identification System (AIS – satellite data for monitoring and control of the navigation situation in the sea), satellite images and any other additional sources of data in order to detect vessels which try to avoid their detection.
This service helps to identify volumes and directions of deliveries of crude oil and gas liquid. Preliminary data about delivery of energy resources allows to forecast beforehand either a growth or fall of price quotes depending on available reserves in the buyers’ storehouses. In the majority of cases, this information is provided by the web-site through paid subscription.
As regards energy resources, we would also like to recommend the Ministry of Energy of the Russian Federation web-site, where they publish the statistics of production, delivery and processing of energy resources: https://minenergo.gov.ru/en
Summary
Many resources, including the ones we presented above, are mixed resources, where analytics is combined with news and statistics, that is why it is impossible to allocate such a resource to one or another category. We would also like to give you a link to our YouTube channel, where we publish videos about the functionality of the ATAS platform, ideas for building trading strategies and other useful information. Do not forget to subscribe!
If you have links to some interesting resources, which help you in trading, you can share them in the comments to this publication.


