Beginner traders are usually looking for the Grail. They want their trading systems (robots or indicators) to:
- produce positive results in 99% of cases;
- be simple and easy to use.
Of course, nothing like this exists in real trading. So, how to act in practice in order to achieve profitable trading? The answer is – to work with probabilities.
This article speaks exactly about the increase of trading profitability with the help of volume analysis. It is split into 2 parts:
- The first half of it is devoted to application of ATAS instruments for the markets, which are either in a flat or in the state of a weakening trend.
- Later, we will continue the subject but for trend markets.
Read in this article – ideas for using volume analysis for increasing the trading strategy profitability under the flat conditions.
- Probabilities in the market.
- Trend absence as a market state.
- Methods of application of the volume analysis indicators for trading under the flat conditions.
- Chart examples.
Probabilities in the market
Profitable trading is a fight for a higher probability of a profit than a loss in a trade.
Your analysis method may give correct forecasts in 55% of cases and wrong ones in 45% of cases. However, even this small predominance would allow you to gradually increase your capital. If you want to increase the profitability by several percent, you can (and have to):
- develop a trading plan and follow it;
- apply correct risk management and capital management.
The goal is to have a trading method, which brings stable profit in the long run with a probability, for example, 60%.
What to start with?
If you want your trading system to make more profit than losses, it shouldn’t go against the market.That is why, the first step in its development is identification of the current market state.
The market state is like wind in the sea, when you sail a yacht. There could be:
- calm sea;
- directed light wind;
- directed strong wind;
- windstorm.
You will not be able to sail a yacht without taking these factors into consideration.
Also, there could be in the market:
- a flat state, when the market doesn’t move anywhere;
- a bearish trend, when sellers win and the market falls;
- a bullish trend, when buyers win and the price grows.
You can sail a yacht differently, depending on the weather. Similarly, you should trade on the exchange with consideration of the current market state.
It appears that there are no trading systems, which produce similarly efficient results under any market state.
Systems bring money when they correspond with the market and lose elsewise. That is why it is important for a trading system to have certain conditions, which would adjust it to the current market.
This issue is often overlooked by beginner traders and they even may fall into a trap of the changing market. It happens like this:
- a trader starts to trade small volumes;
- he gets good results and increases the trading volume;
- the system starts to make losses on the increased volume and a trader completes the month with a drawdown;
- having decided that the system doesn’t work any more, a trader starts to look for a new one.
And so on in a circle-wise manner.
Let’s assume that the system was a flat one and while the price moved in a flat, the trader made profit. However, the system started to make losses when a trend started.
That is why, the first step for building a profitable trading system is to identify and take into consideration the current market state. If there is no trend in the market, you should trade respectively.
Read further:
- what a flat is;
- how to identify it;
- how to trade in a flat.
The market state is a flat
A flat, corridor, range or position accumulation – you may come across various names of the market, in which a balance of powers between bulls and bears has been formed.According to the common opinion, the price is in a flat 70-80% of time.
In this case, the price is in a corridor between significant levels and the efforts to break free from it form the ‘false breakout’ pattern and return to the range.
Let’s consider the flat market characteristics and also 6 ideas how the ATAS platform volume analysis instruments help to detect the trend absence/weakening.
Idea 1. Volume Profile and the maximum Horizontal Volume for a day.
There will be no consistent movement of the maximum horizontal volume for a day in a flat – movement will be chaotic. In other words, chequer-wise (up-and-down).
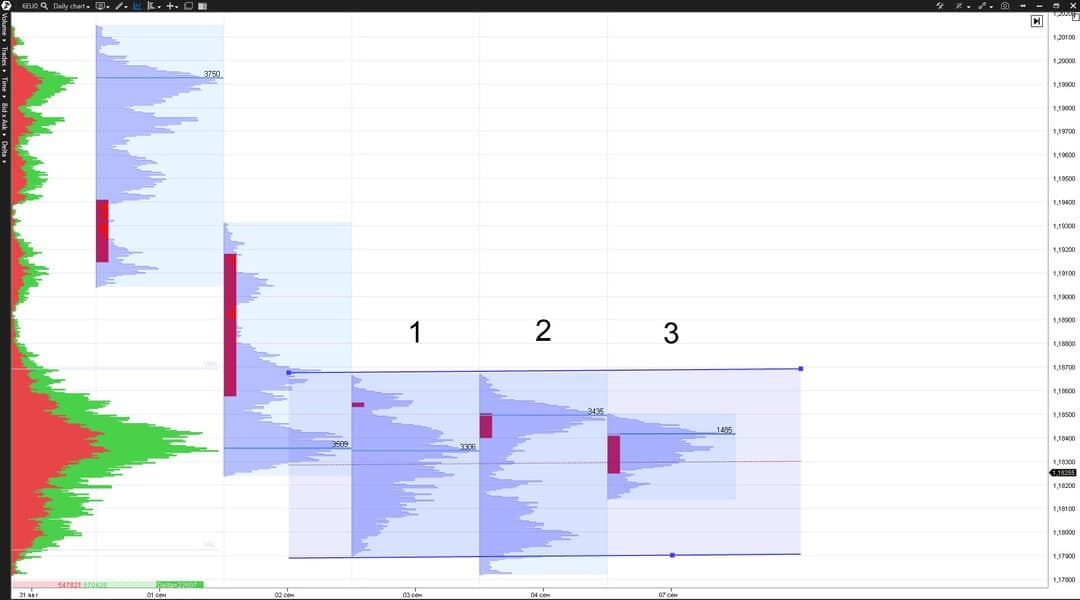
The chart above shows the Footprint of a daily period from the euro futures market (CME data). We will use this market with similar instruments in our further examples.
The day marked 1: the maximum volume didn’t move lower and stayed practically at the same place with respect to the previous day’s maximum volume level. It was a sign of the end of the down movement and market transition into the flat state. The day marked 2: the maximum volume moved up, which confirmed the market transition into a flat.
Idea 2. Volume – vertical volume.
The Volume indicator shows market activity or a number of contracts, traded during a day. This indicator also helps to identify the current market state. Most often, trading volumes are small in a flat, but we may observe the trading volume increase on the day, when the fight between buyers and sellers becomes more intensive.
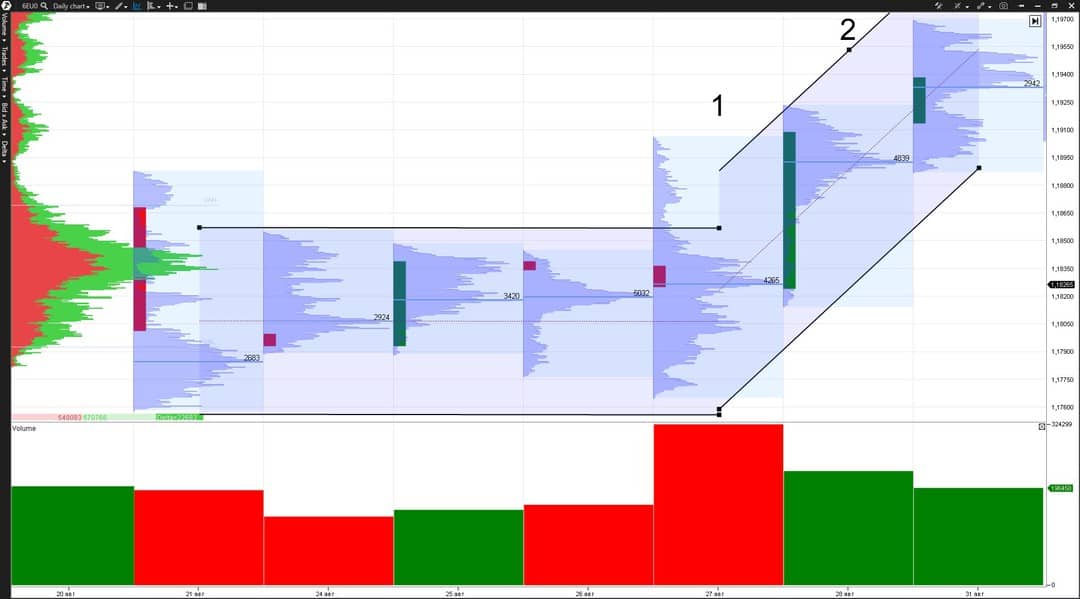
- If there was a flat, a trend beginning is probable.
- If there was a trend, a flat beginning is probable.
Idea 3. Delta – difference between buys and sells.
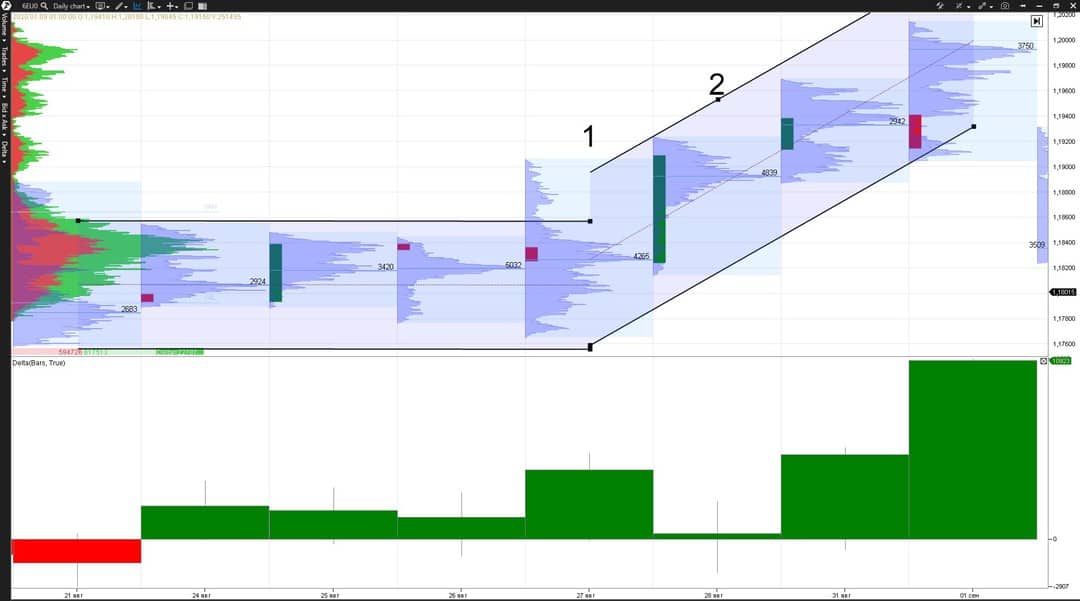
The delta is often small in a flat, which tells us about an insignificant predominance of some market participants over the others. The total delta of several flat days could show a probable direction of the flat breakout with transition into the trend state.
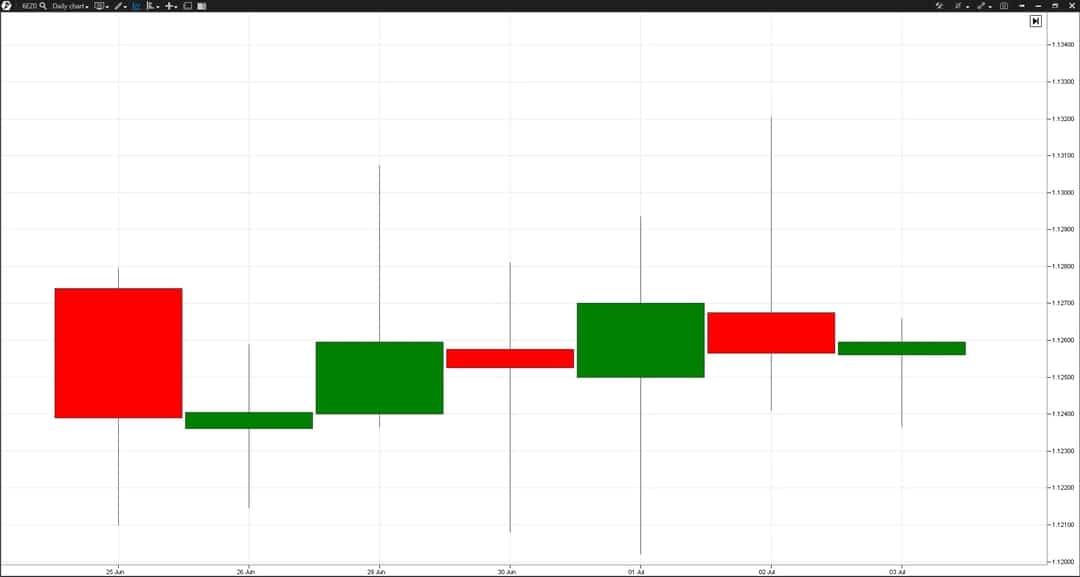
Idea 4. Candlestick pattern. Day closing.
You could often see the doji candlestick day pattern in a flat – a small candle body and long candlestick shadow.
Idea 5. Day extreme points – day’s highs and lows
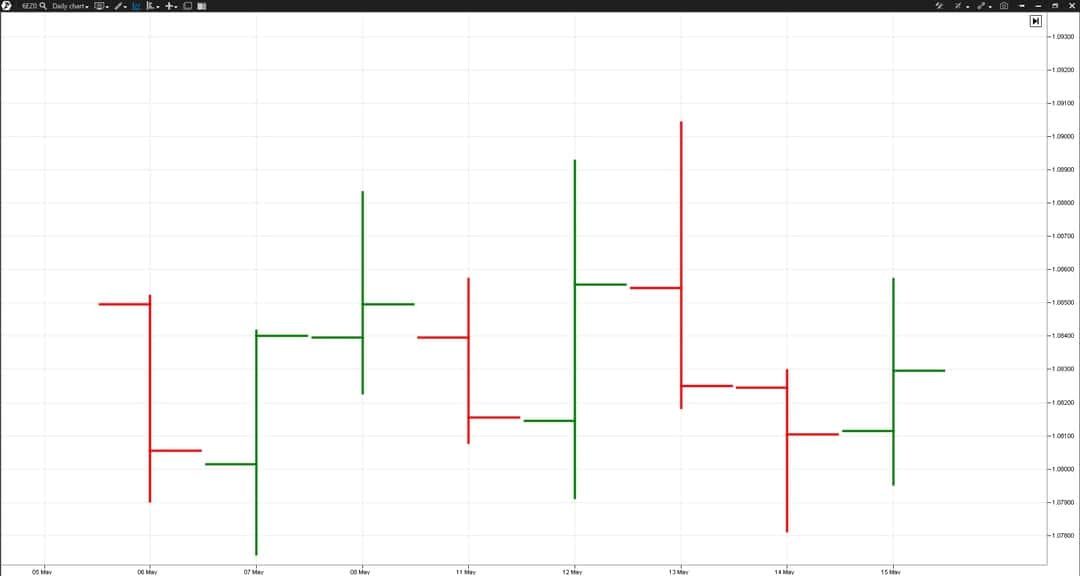
Local peaks and valleys are significant day trade values, since they show strength or weakness of the market participants. Are bulls able to raise prices to new heights or are bears able to drop prices to new lows?
It is important not only to raise them but also not to allow them to drop.
Idea 6. Time.
Who forms the market? Major market participants. Major market participants have large-scale positions, which should be accumulated during a long time and then distributed during a long time. Namely that is why flats appear in the market. They constitute 70-80% of trading time.
There is one more significant issue – the market inertia. The market is like a big ship, which continues to move in a previously set direction by inertia. Consequently, the market would probably preserve its current state and you should take it into account when making forecasts.
Conclusions
All the above listed ideas should be considered as a whole for more accurate forecasts. The main goal is to increase your chances in your favour, accepting that nobody can achieve 100% of profitability.Advanced instruments of the trading and analytical ATAS platform will help you to be ‘in tune’ with the market. Apply the listed 6 ideas to identify a flat.
How to apply volume analysis instruments for trend states – we will tell you about it in one of our next articles.
Information in this article cannot be perceived as a call for investing or buying/selling of any asset on the exchange. All situations, discussed in the article, are provided with the purpose of getting acquainted with the functionality and advantages of the ATAS platform.


