How to enter a trade on the exchange correctly
An entry point in trading is a point of opening a position at the price, which was previously identified or calculated in accordance with a trading strategy (how to develop a trading strategy). The best entry point is the point which ensures low risk and high profit.
We will speak in this article about how to look for the best entry point. Read about:
- Importance of a correct entry point.
- Four types of entry points: along a trend, against a trend, at breakouts and at bounces.
- Instruments of looking for entry points along a trend and against a trend.
- Instruments of looking for entry points at breakouts and at bounces.
- Protective strategies after an entry.
- Looking for exit points.
Importance of a correct entry point
Entry points on an exchange can be identified on the basis of:
- technical or volume analysis;
- graphic pattern or event;
- act of nature;
- publication of statistics;
- other important factors.
Depending on a used trading system, an entry point could open a position both along a trend and against a trend. It is a difficult task to find an entry point in a ‘naked’ chart without special indicators even for an experienced trader. It is especially difficult to identify a trend reversal moment.
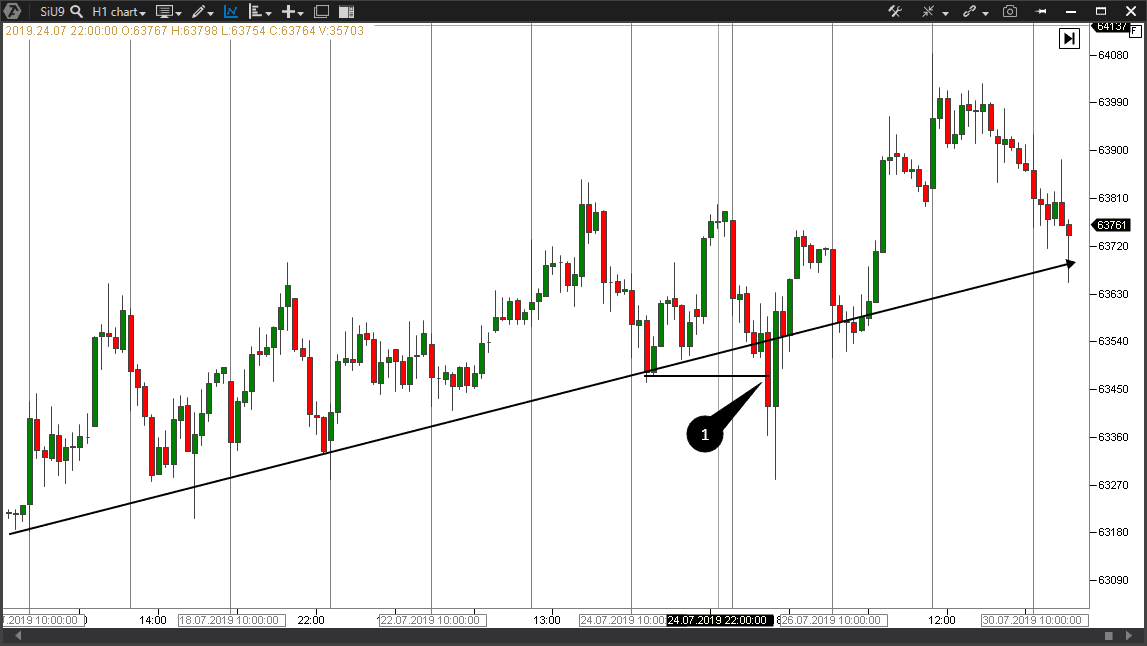
For example, we clearly see an uptrend with elements of a false violation of the ascending structure in the picture below:
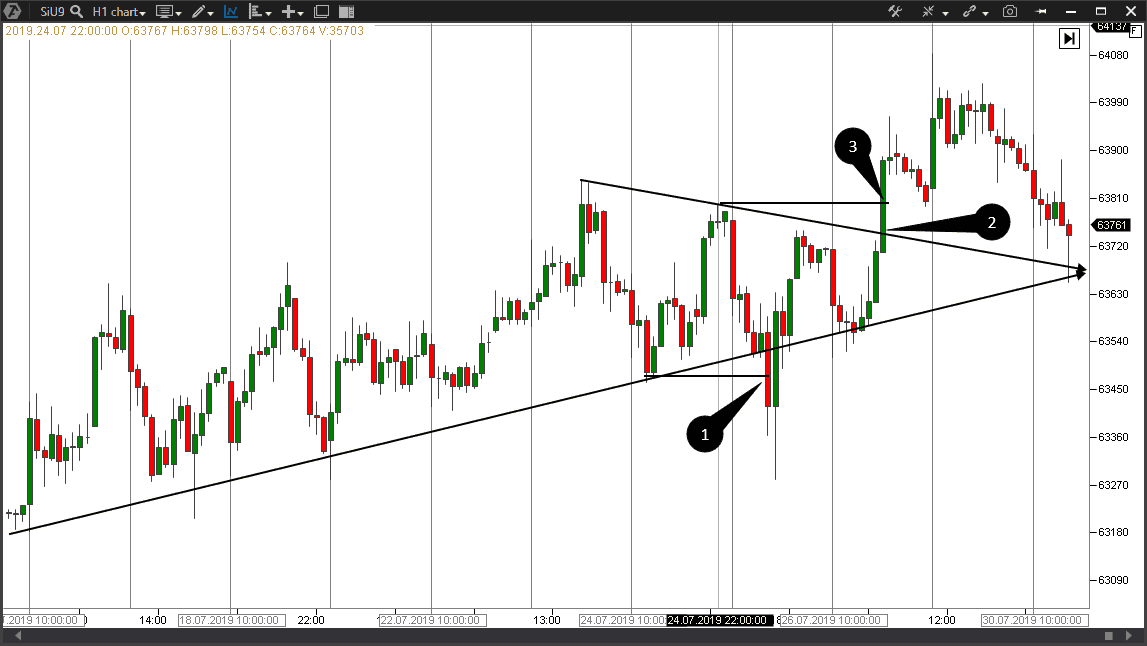
If a trading system dictates action at a bounce from a trend line, a trader will get a stop loss at the level of the previous low in point 1. And the situation in point 1 showed that the trend is broken and the focus of trades changes in the direction of a new downtrend. That is why, a trader will open a short position in point 2 and … will get yet another stop loss at the level of the previous high in point 3:
The above example shows that the market is full of traps in which traders would get without using special indicators-assistants.
We will tell you in this publication what indicators of the ATAS platform allow avoiding traps and identifying the best points of entry into a position.
Four types of entry points
The basic types of entry points on an exchange are considered in the article. We allocate 4 basic types (with certain generalizations).
As to a trading with respect to a current trend, trades could be:
- along a trend;
- against a trend.
As to the markets without a trend, entry points could be:
- at a breakout of a horizontal level;
- at a bounce from a horizontal level.
The most popular type of an entry point is opening a position towards the trend continuation.
Trading along a trend is one of the most popular trading strategies which takes into account the strength of demand and supply in the market. The price grows if there is a strong demand in the market and falls if there is a strong supply. These phenomena create focused movements by financial instruments whether it is a stock, commodity futures, currency pair or debt security. However, each trend has a culmination moment when the trend direction changes and a reversal takes place.
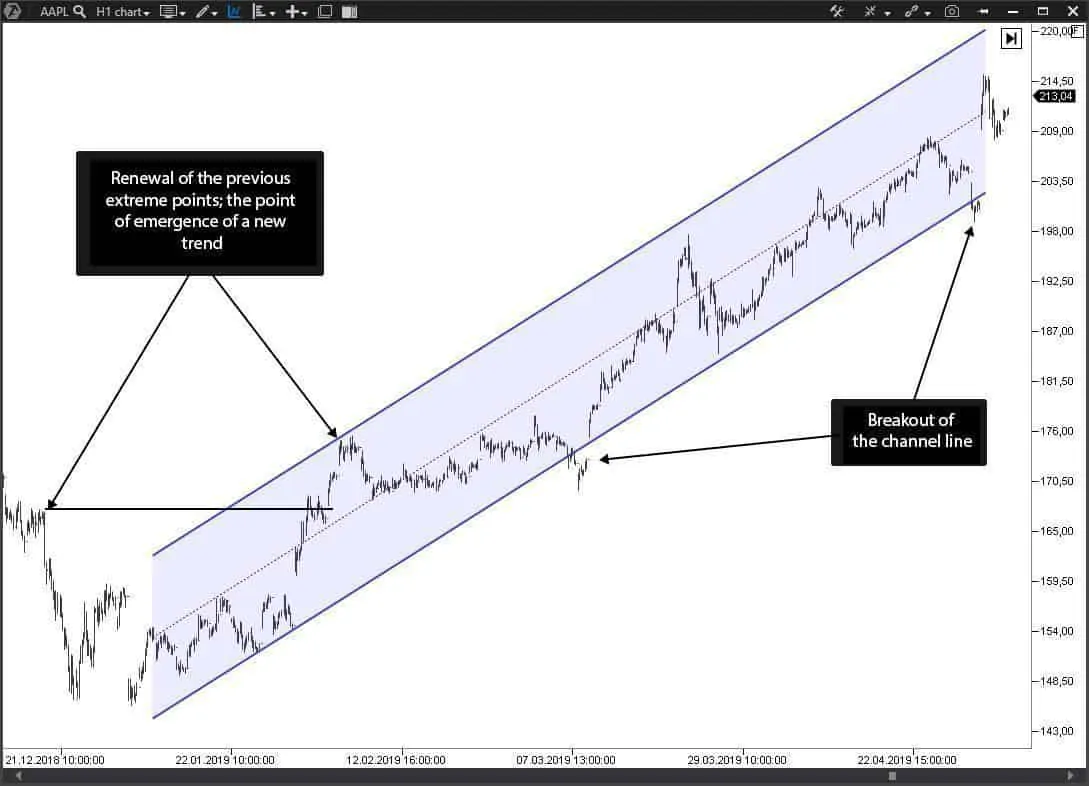
It is practically impossible to calculate the trend’s strength at the stage of its emergence. Many fundamental factors, on which the strengths of demand and supply depend, influence the trend’s duration. The price ‘draws’ a channel when moving in a certain direction as it is shown in the example below, where an up-channel on the Apple stock is shown:
It is considered that the best entry points of trading along a trend are those, where the price tests the channel’s lower boundary in the event of an uptrend or the channel’s upper boundary in the event of a downtrend. As you can see in the AAPL chart, the breakout of the channel line turned out to be false and the chart carried traders in the wrong direction before the price jumped up.
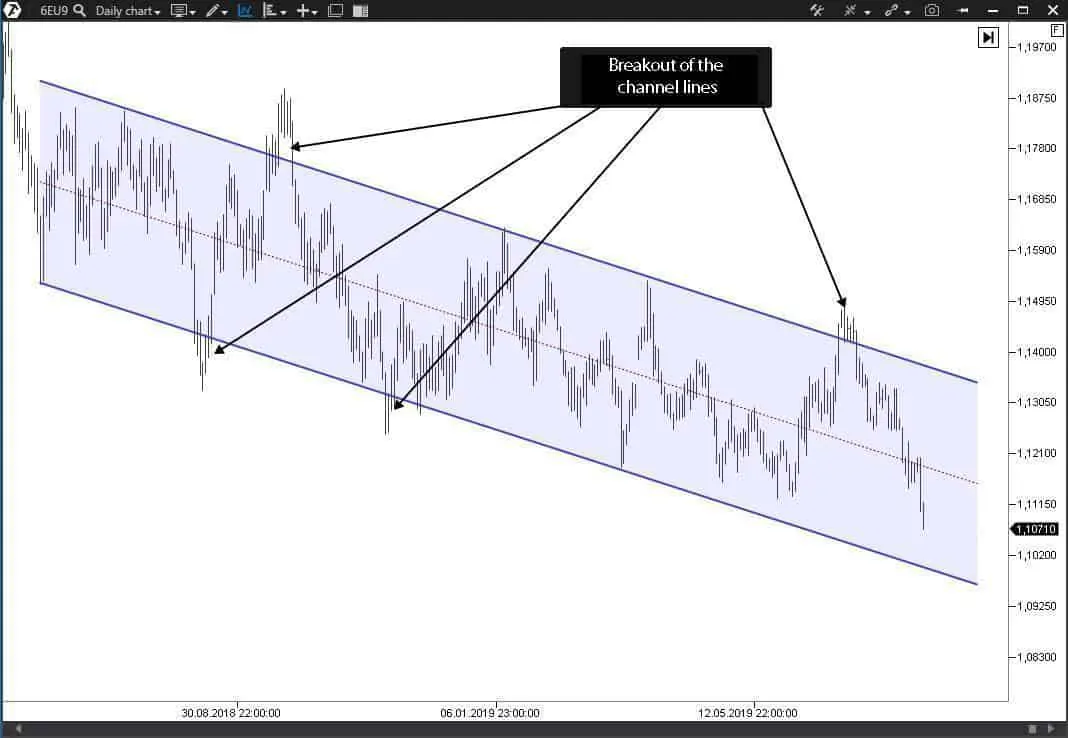
An example of a long trend movement on a 6EU9 futures:
Splashes, at which the price demonstrates breakouts of the channel lines, are typical market situations. However, namely they make traders do wrong. In such situations, a trader opens a position in the area where the price tests the channel line and finds himself in an unpleasant situation when the price breaks the channel line and blatantly continues to move towards a stop loss.
The trader’s task in this case is to identify whether this breakout is true or false. In fact, it is rather difficult to identify the real nature of the breakout. For example, a fundamental analysis may designate a high probability of the movement continuation, but the price will act differently.
There are plenty of false breakouts of channel lines on all time intervals and are a stumbling block for many traders.
And what if we turn the problem to our interests? To do this we need to act in accordance with the system, which opens a position along a trend for coming back into the channel after the false breakout of the level. Namely such entry points will ensure an excellent risk-reward ratio.
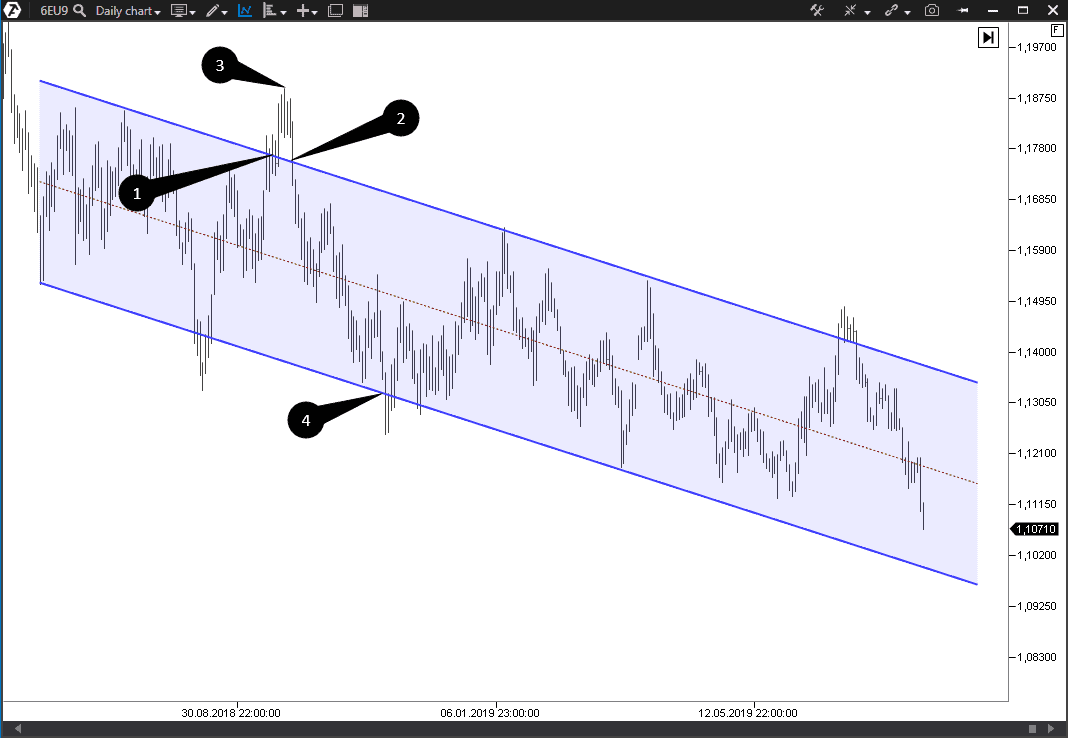
Let’s consider an example of looking for a point of entry into a short. The picture below shows a EUR futures (what a futures is) chart.
- A bottom to top breakout of the down-channel is registered in point 1. The price traded above the broken line during several trading sessions.
- The price moved back to the channel at a certain moment, which served as a signal for opening a short position.
- Point 3 is a peak above which a stop loss should be posted.
- Point 4 is a target point for registration of the profit.
What are the advantages of the entry point marked with number 2 in the chart?
– it doesn’t violate the principles of trading along the general trend (marked with blue lines);
– it protects itself against possible losses better;
– it gets a good risk-reward ratio.
Looking for points of entry against a trend
The price often makes corrections against the main direction when it moves in this direction. It is often connected with the impulse fading and intermediary registrations of profit from the positions along the trend. The correction shouldn’t block the main impulse movement.
So, where are the points of entry into the market against a trend?
- Read about several examples of entry points in the article about strategies of trading along and against a trend;
- From the point of view of channels, the points of entry into a long against a downtrend are at the lower boundary of the channel, while the points of entry into a short against an uptrend are at the upper boundary of a channel.
But here we have an important nuance. Apart from the fact that a counter-trend trader bears a risk when trading against a trend, he also may unknowingly make a mistake when building the channel lines.
Let’s see what we mean. Look at the previous chart. We showed there a complete pattern of a trend movement, where it is rather simple to draw a channel in the chart using the upper and lower price levels. However, it is rather difficult to identify the outlines of a trend channel at the stage of the emergence of movement.
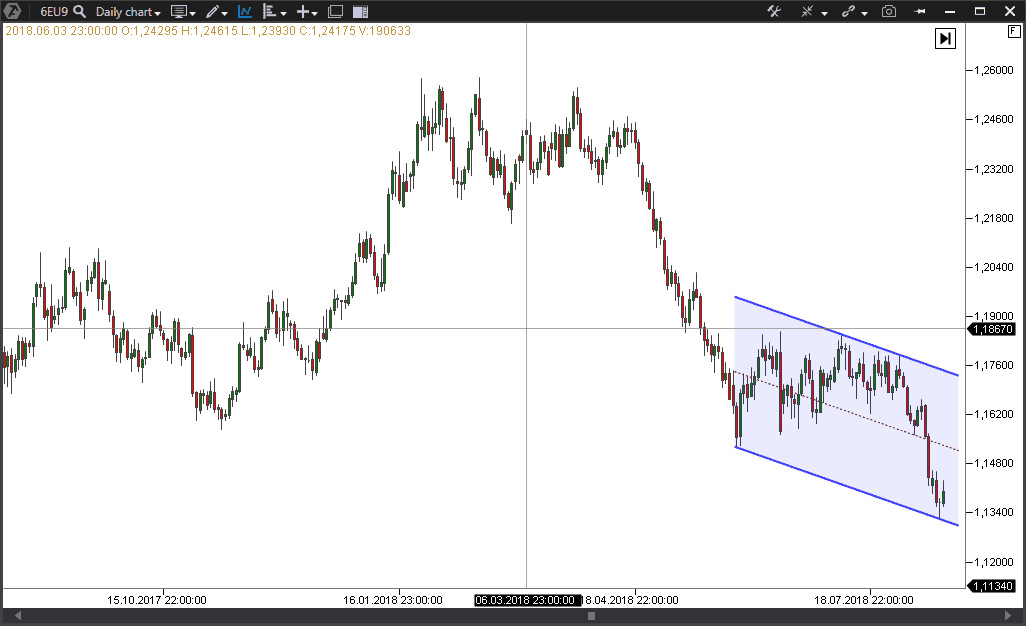
Let’s consider a situation when we have just a few reference points for drawing a down-channel.
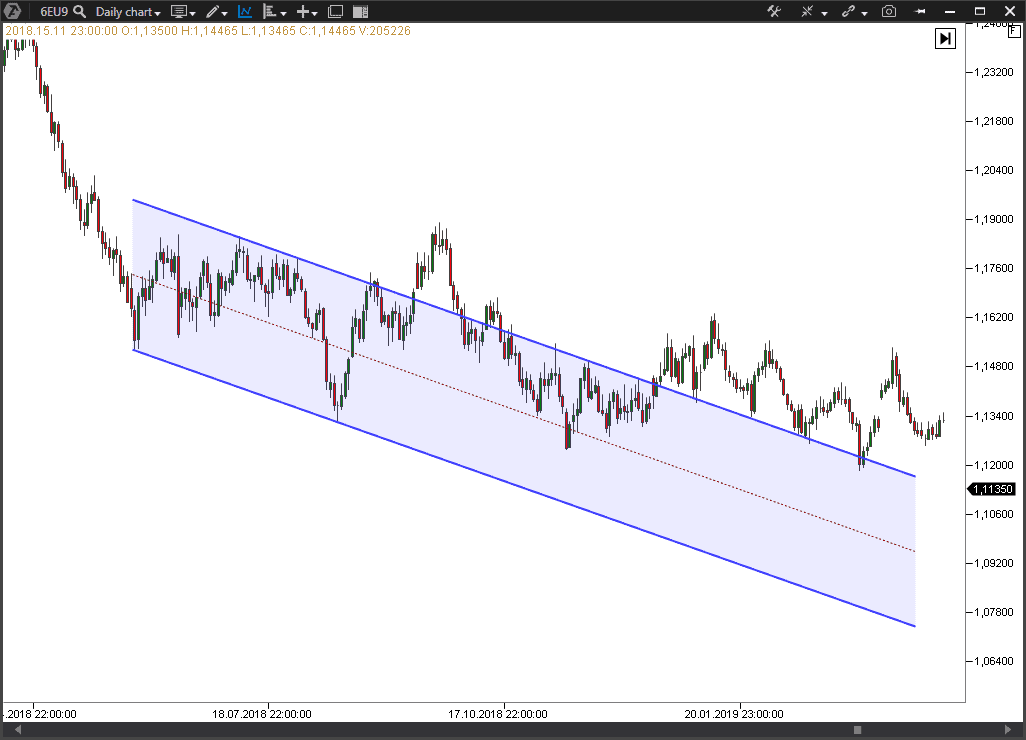
And now look how the channel will look like in the future.
Now you can see that the channel doesn’t lay down in the chart in the future so neatly as it was originally. And each new low and high marks produce corrections of the channel itself and the channel takes the final shape only at the end of the movement.
So, channel building is a delicate topic. Let’s see how ATAS indicators can increase your chances for success when trading with the use of trend channels.
Instruments of looking for entry points along a trend and against a trend
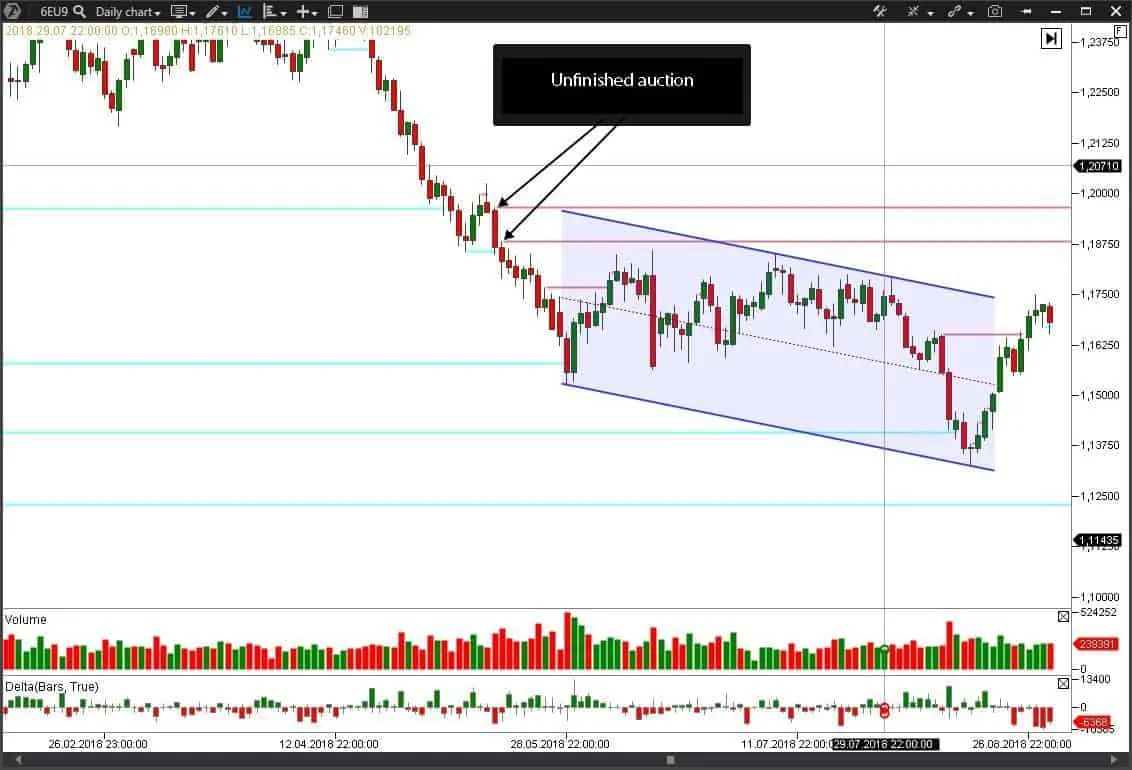
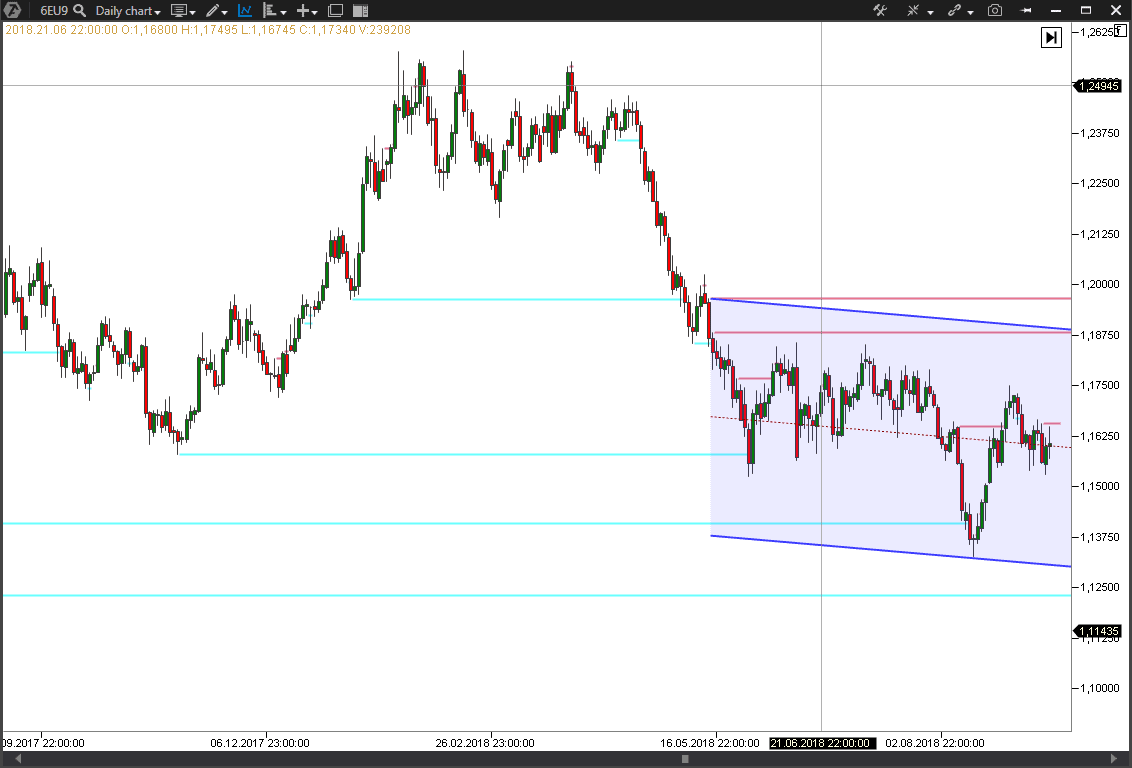
Let’s add the Unfinished Auction indicator to an hourly EUR futures chart. This indicator marks those places in the chart, where there is an unfinished auction (read about it in this article).
After we added the indicator, the chart started to show horizontal lines, which tells us that there are unfinished auctions at some price levels. Moreover, a part of the trend channel has been already formed in the chart.
It becomes clear that the unfinished auctions are located above the channel line and here we have an idea. We may expect testing of the first and second line of an unfinished auction by the price. This circumstance makes us reconsider the drawn graphic channel decreasing the slope angle.
We place the upper boundary of the channel at the level of the first unfinished auction and the lower boundary follows each new price low.
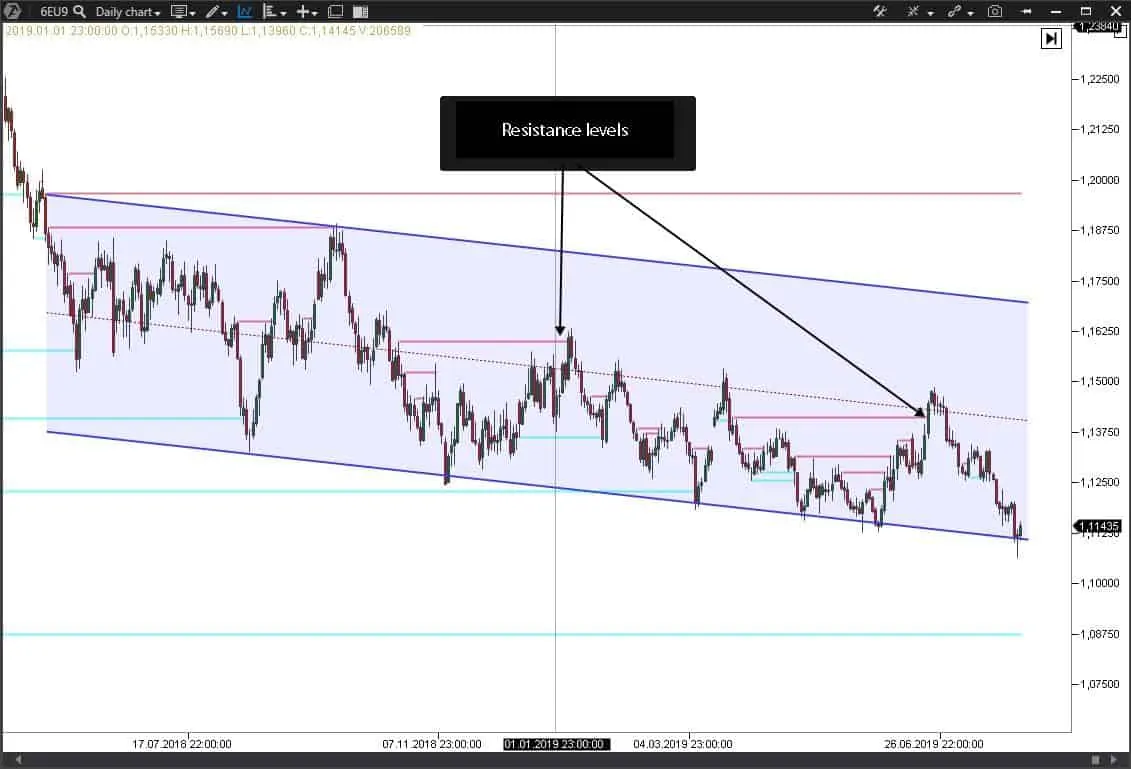
Thus, the upper boundary of the channel will be finally built when the price tests the line of an unfinished auction and it will take the final shape as it is shown in the picture below:
However, in this case the price will provide only one opportunity during the whole movement for opening a position along a trend. So, where to look for other entry points?
The Unfinished Auction indicator will help us again. While moving inside the channel, the price (as we can see in the chart above) leaves ‘traces’ of an unfinished auction, which serve afterward as resistance levels.
Entry into a short position from the unfinished auction levels is expedient if their testing takes place in the upper part of the channel. The unfinished auction lines on a downtrend, which are located below the central axis of the channel, are not rational for opening a position due to a very big stop loss, which has to be hidden behind the upper line of the channel.
Looking for entry points in various markets
We considered looking for entry points with the use of the channel lines and the Unfinished Auction indicator in an hourly EUR futures chart. Does this approach work in other markets and with other time periods? In general, it works. But you should take into account certain nuances.
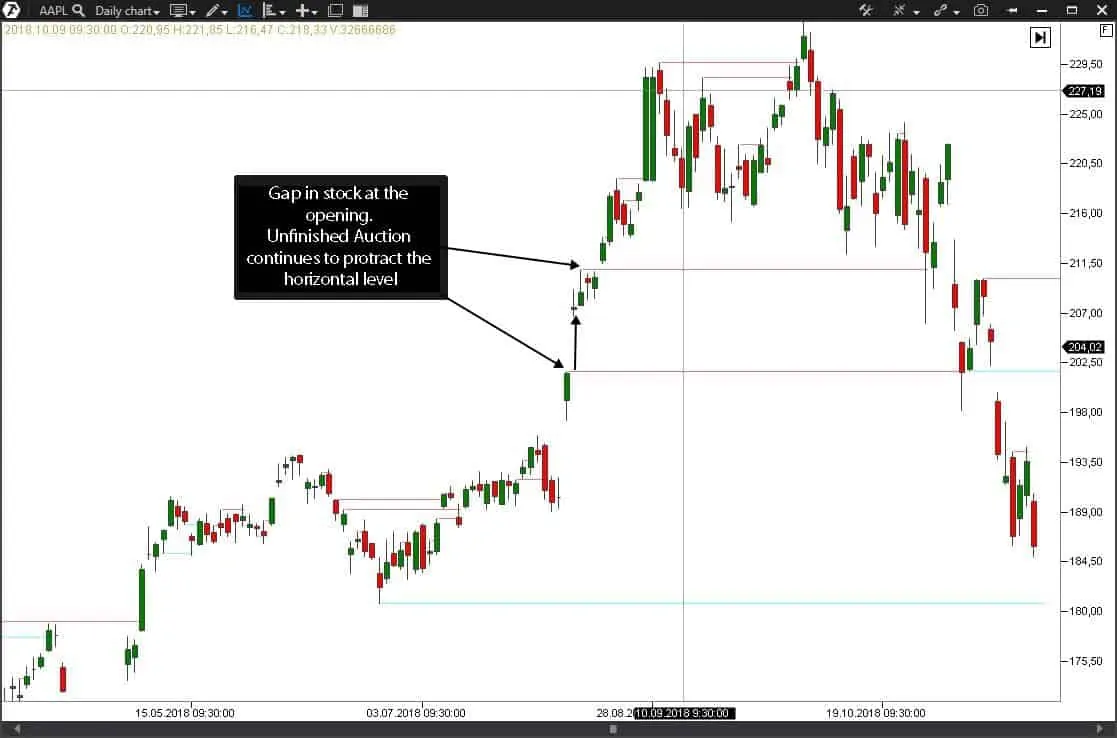
For example, you should be attentive when price gaps appear when you use the Unfinished Auction indicator in the stock market.
Gaps are very characteristic for the stock market with a day period as we can see in the AAPL stock price chart. In the event of gaps, the indicator would thinks that the price hasn’t yet tested the price level and would continue to protract the horizontal line. You shouldn’t take into account such an unfinished auction in your trading system.
Where to register a position
The Unfinished Auction indicator will also help to point at the position registration point (take profit).
Observations show that the points of an unfinished auction often serve as levels, at which the price reverses. Such an approach has an advantage because it allows accurate calculation of the potential profit and its relation to possible losses.
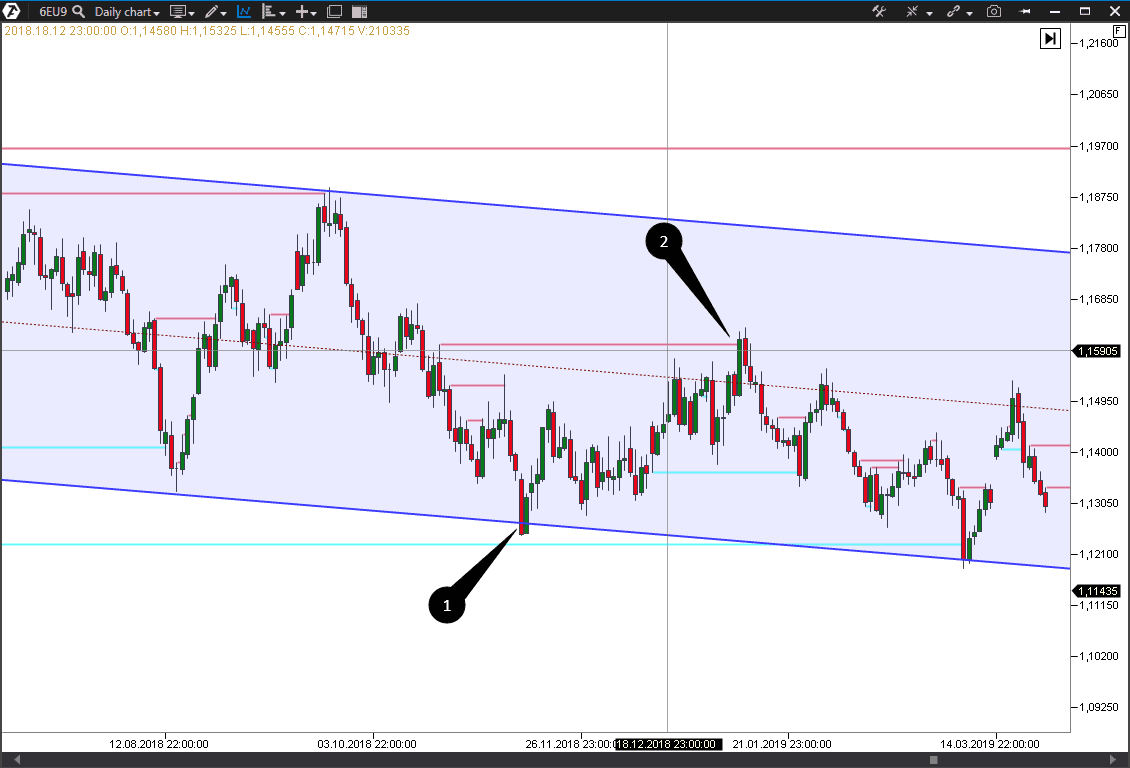
Let’s consider an example in the EUR futures market with a day period.
The price tests the lower boundary of the down-channel in point 1, from which a counter-trend long position opens. There is only one unfinished auction is above, which serves as a target level for the position registration. The stop loss size in this event may constitute ⅓ of the potential profit, which is convenient for calculations, since we identify the registration point beforehand on the basis of the indicator.
Looking for entry points at breakouts or at bounces from a horizontal level
Thus far we discussed the ways of looking for entry points with the use of inclined lines (or channel lines). Further on we will consider horizontal lines.
Horizontal levels, from which a correction takes place, are called support and resistance levels. These levels are identified when the price tests them one after the other. If the price repeatedly bounces from the level from bottom to top, it is the support level, if from top to bottom, it is the resistance level.
You can read more about support and resistance levels in the following articles:
- 2 volume indicators, which will help you to identify levels;
- Support and resistance on round numbers;
- Support and resistance on Fibonacci retracement levels;
- Looking for support and resistance by the Imbalances indicator.
Identification of the support and resistance levels
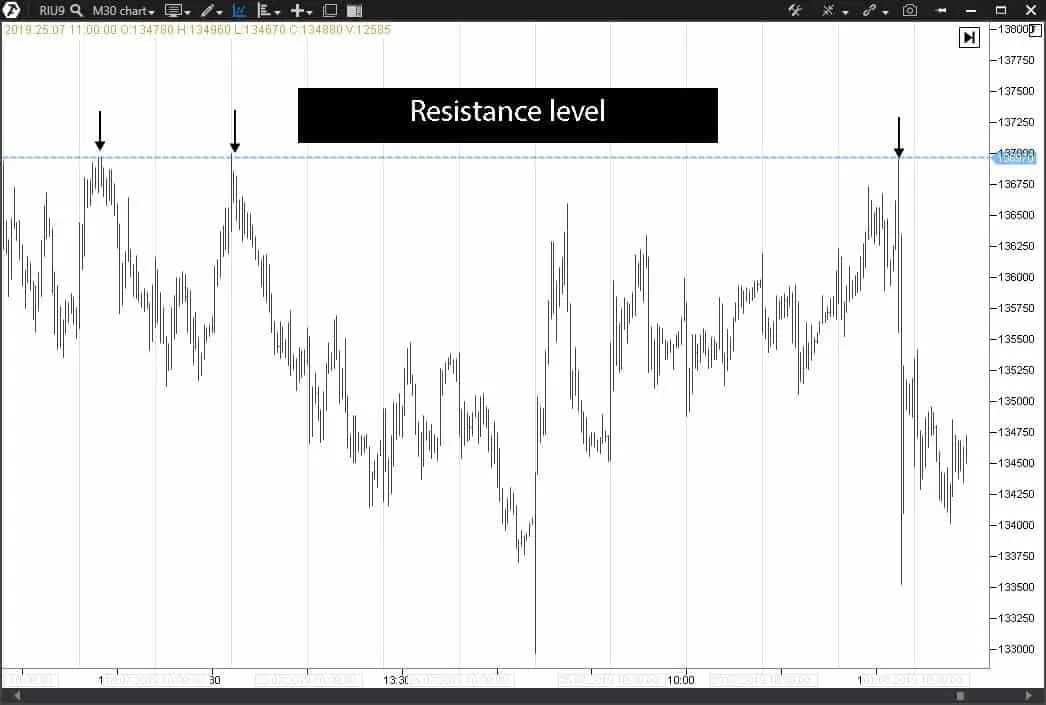
You can identify support and resistance levels visually, just looking at the chart. The picture below clearly shows the resistance level on an RTS index futures, which produced strong correction movements twice after the initial emergence:
There is a high probability of making a mistake if you identify support and resistance levels visually.
If the price reached a certain extreme point, we cannot be sure that this extreme point will send the price for correction during the next testing. The level, which already demonstrated a repeated testing and produced the same reaction, is more informative, but multiple testing of the level could finally result in its breakout. Due to which an inexperienced trader may lose faith in the trading system based on the support and resistance levels. So, what’s to be done?
Looking for entry points with the Delta and Open Interest indicators
We want to offer you a method of identification of strong levels at the first attempt. The ATAS platform instruments will help you to identify strong levels not only at the price extreme points but also inside various ranges. It will significantly increase the number of good entry points.
You will need the Delta (what delta is) and Open Interest (How the Open Interest indicator operates) indicators.
Now, we come back to our RTS index chart and consider it with these indicators in more detail.
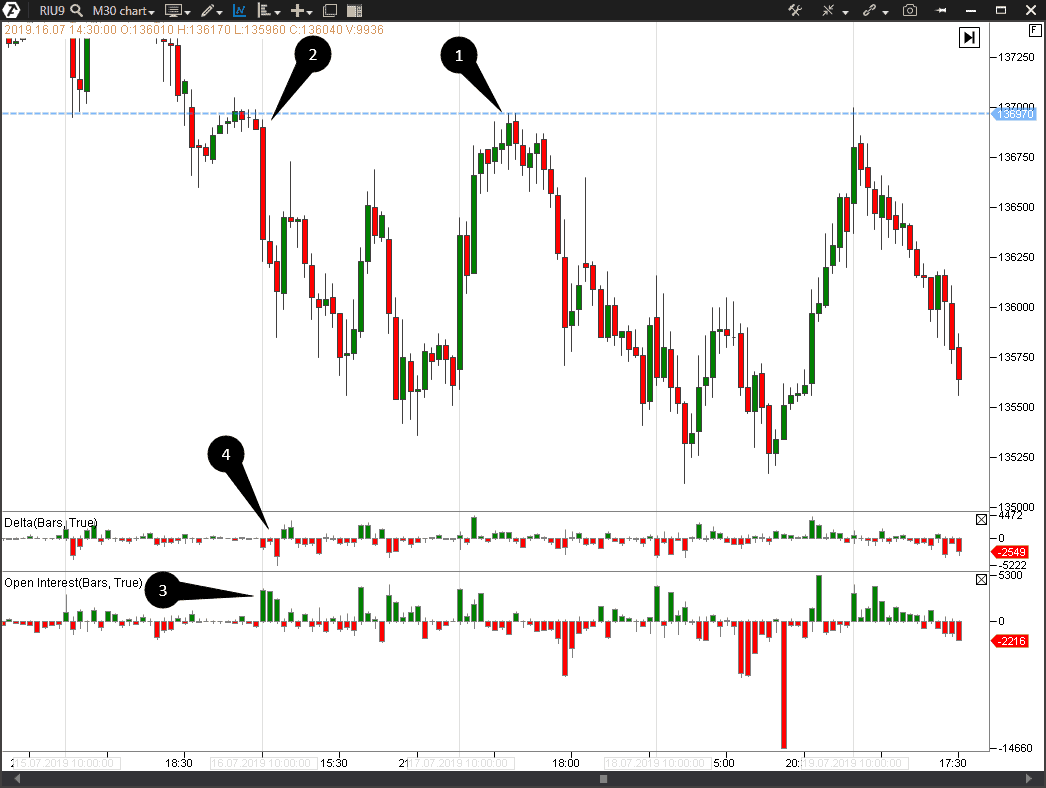
As we already identified, the price ‘drew’ a certain extreme point at the level of 136,970 in point 1. Further on, this level served as the resistance level several times. But, in fact, point 1 marks a testing of the previously existed level of interest, which was formed by a big accumulation of positions by sellers in point 2. The Open Interest indicator, which showed high volume in point 3, tells us about it, while the Delta indicator showed a significant preponderance of active sells in point 4.
You will learn about the level formation before the rest of traders if you have these indicators in your arsenal. You can use the level of 136,970 as the resistance level at the very first testing in order to trade a bounce from the resistance through posting a short stop loss above the level.
Looking for an entry point from the support
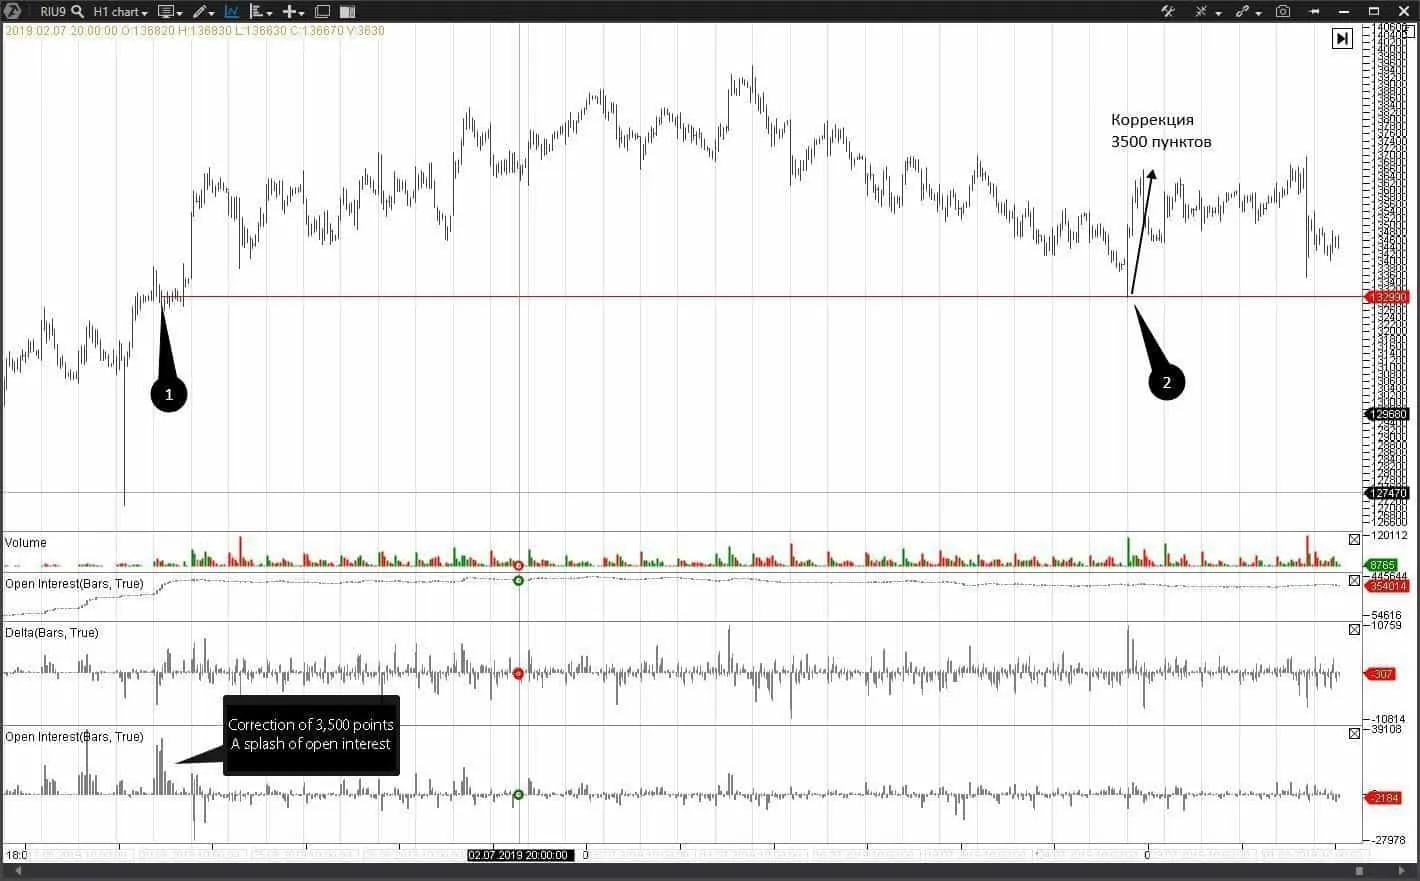
A similar situation takes place during formation of the support level. There is a splash of open interest, which visually didn’t manifest itself as a level, in point 1. However, a testing of this level took place in point 2 and then there was a strong correction of the price by 3,500 points during one trading session.
Open interest is broadcast in real time by the Moscow Exchange only. It is not possible to use the open interest in the ATAS platform with respect to the Western markets, however, the Delta indicator could be sufficient for identifying the support and resistance levels.
Looking for an entry point in the oil market
Let’s consider how it works using an example of a CME (Chicago Mercantile Exchange) oil futures contract.
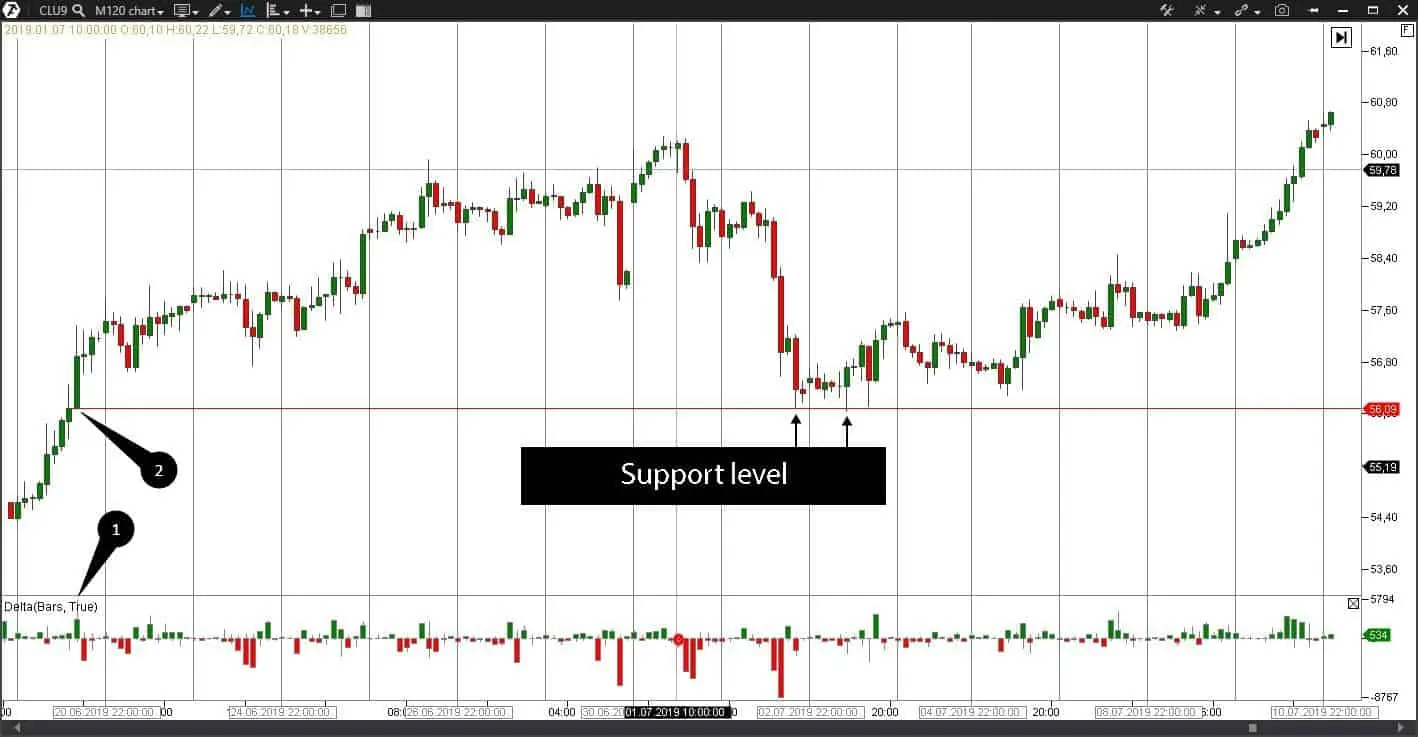
A high positive delta is registered in point 1. Building of the support level should be started from the lower boundary of the candle body in point 2.
Further, the built level demonstrated the strongest support. With account taken of special factors relating to a supply oil futures, it is necessary to remember that those producers act as oil sellers, who open big sell positions but cannot protect their open positions. That is why it makes sense to give more preference namely to the delta of buyers in this instrument. What you should know about oil futures.
Effective period of levels
Some levels have a certain effective period, for example, the option concentration levels act only until expiration, after which the interest in holding the level vanishes. The option expiration days are known beforehand and this also has to be taken into account in your trading system when one more testing of the level takes place.
You can read about what options are in this article.
However, if a level doesn’t have a certain effective period, it doesn’t mean that it will stay forever. There will be a breakout sooner or later. The level becomes a ‘mirror-like’ after a breakout:
- the support turns into the resistance;
- the broken resistance becomes the support.
It is difficult to identify a level breakout beforehand, however, there are methods of identifying preparation of a level breakout. If there is a strong interest in a level breakout, you can notice it. The ATAS platform indicators will help you to do it.
Looking for entry points at the level breakout
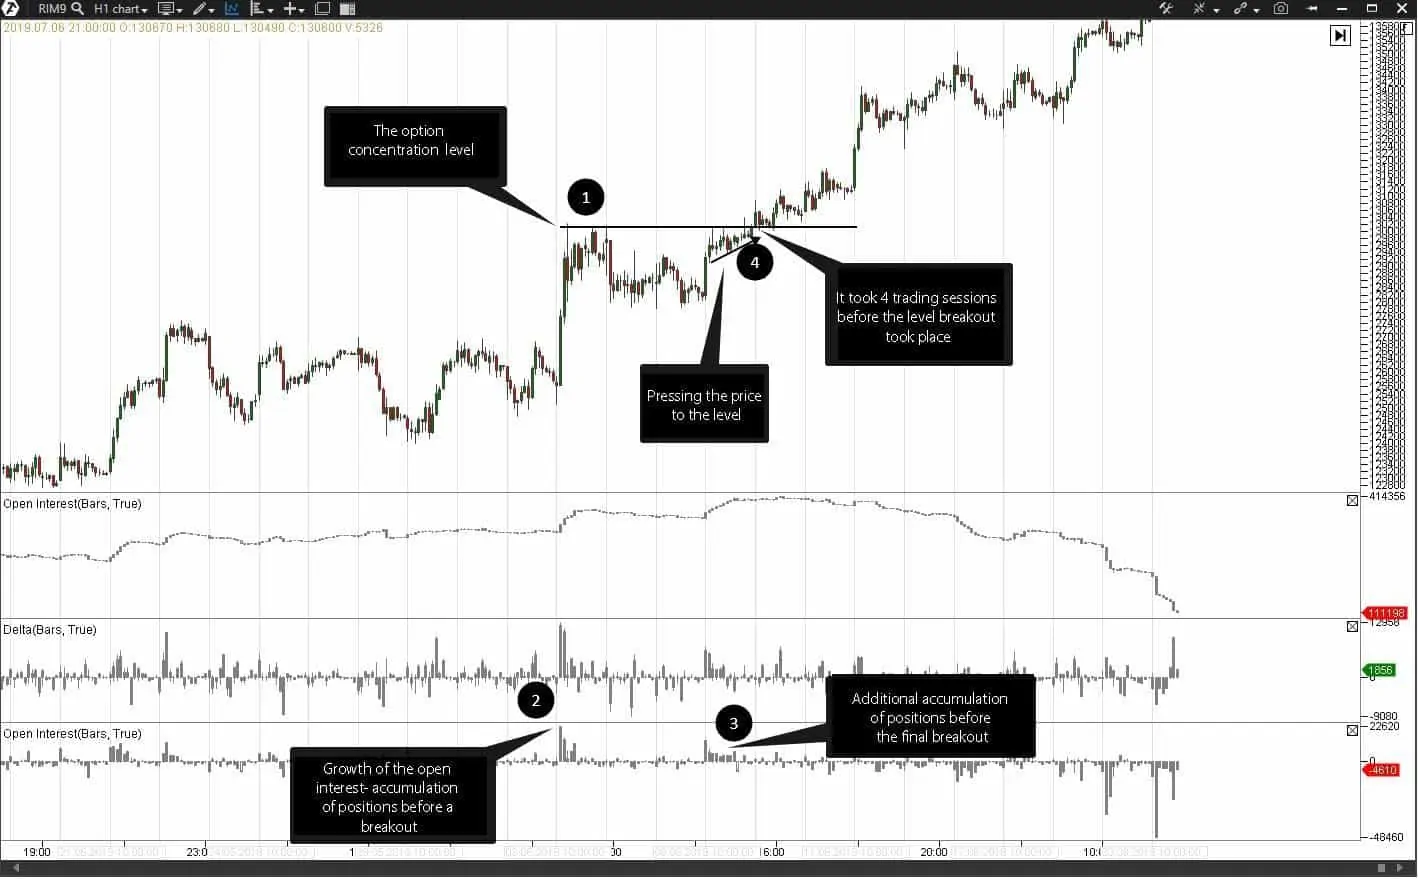
The next picture shows preparation of a level breakout on an RTS index futures contract.
- The level of 130,000 (point 1) served the area, after which the sold Call options would start to bring losses to the options subscriber and require high guarantee collateral.
- Inevitability of a level breakout on a fast growth of Gazprom stock required from an option seller a set of hedging positions on a futures contract, which we noticed in point 2.
- We registered an additional set of positions in point 3 while the price pressed closer and closer to the resistance level.
- The level was broken on the fifth day (point 4).
Thus, the ATAS platform indicator pointed to the evident interest in breaking this level. Emergence of such situations allows opening a position after a level breakout towards continuation of the main movement. A stop loss is posted, in such a case, behind the broken level.
Protective strategies after taking the best entry point
So, we explained to you how to find the best entry points on an exchange. Now it’s high time we spoke about protective strategies, which would protect your deposit in the event of development of an undesirable scenario.
After a position is opened, it is necessary to identify the level, after reaching which the planned scenario is considered to be violated. It could happen due to political and economic events. Or due to other reasons – no matter which ones. It becomes dangerous to wait and hope that the price again would move in the required direction. This is described in the article about the ATAS trader’s discipline (plus 10 rules for improving the discipline).
In order to limit possible losses, it is necessary to use stop loss orders. However, in order to post stop losses correctly, it is necessary to calculate such price levels, which would not be touched by chaotic price movements. How to do it?
Posting a stop with the ATR indicator
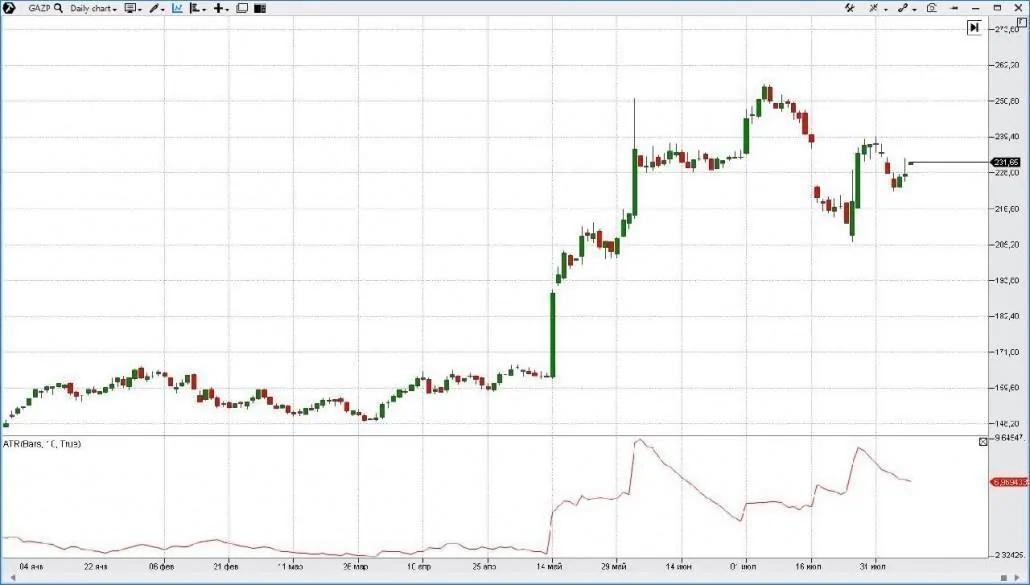
We offer to use the ATR indicator, which calculates an average price move for a specified period of time, for calculating the level of posting a stop loss. The ATR indicator will reflect an average size of a day’s bar when using day bars. You can read here about how to add and set such an indicator.
ATR measures the current market volatility (what volatility is). The picture below shows a GAZP stock chart. The market is relatively nonvolatile in the left part and volatility grows in the right part.
Thus, if the volatility grows, the stops should be wider. And the stops could be pulled closer if the market is quiet.
An intraday trader may use 10% of ATR. It means that a stop is posted at a distance of 10% of ATR from the entry price. A swing trader may use 50% or 100% of ATR as a protective distance.
There is a possibility of hedging your position with options apart from posting a stop loss order. An option position doesn’t depend on a stop and it is not afraid of chaotic price movements.
However, the application of options puts some charges on their holder who constantly makes losses from the option time value breakdown. Such losses are covered only in the event when action goes along a trend, which reduces the influence of the price breakdown stronger when the price goes farther into the planned direction. If working in the absence of an explicit trend, such a strategy might not bring the desired profit and the price breakdown of the option would become a loss. We discussed different types of protective options in this article.
Summary. How to look for entry and exit points
It is relatively simple to find entry/exit points in trend strategies. A touch of an inclined support or resistance line is a reference point for opening a trade. If a touch takes place from the opposite side – we close.
It is much more difficult for counter-trend strategies, since a trend always tries to move the price against such a position reducing the opposite channel line. That is why it is necessary to use special indicators for a counter-trend strategy. These indicators are Big Trades, Cluster Search, ATAS Delta, Margin Zones and Unfinished Аuction (we already discussed it above).
These indicators are also useful when looking for entry points when working from horizontal levels in the market without a trend.
Emergence of major traders on the Big Trades indicator, for example, for buying, after which the price doesn’t move up, could tell us that a major trader got into a trap and the market could move against him until it becomes impossible to suffer losses any more.
A partial or complete registration of a position at a marginal level is possible when using the Margin Zones indicator, since the price could move to a certain marginal area, after which there is a probability that the movement would stop and/or a reversal would take place. Read in this strategy about specific features of using the Margin Zones indicator.
Emergence of anomalous values of the Delta indicator may also point to a culmination in the market and the beginning of a reversal. In such a case, the emergence of anomalously big values of the Delta indicator would be a reason for registration of a position either completely and partially.
The price could also reverse when testing horizontal lines of an unfinished auction, which we considered in this article. That is why it makes sense to consider these levels as levels for registration of a position (completely or partially).
We hope this information was useful to you. Download the free ATAS version right now and check how the described techniques work in the current market.

