In this article:
- Advantage of the currency futures market.
- Basic principles.
- Example.
Advantage of the currency futures market.
A standard EUR futures contract (ticker: 6E) is used in the example, considered in this article. Information about real trading volumes is not broadcast in the Forex market contrary to the currency futures market. Futures traders that trade in the ATAS platform have a big advantage compared to Forex traders since they have access to the advanced analysis of the currency market with the help of Footprint.
The currency market works around-the-clock on working days and stops its operation on Saturdays and Sundays. Moreover, the futures currency market has a break during the day, the length of which is specified in each futures contract. For example, it lasts for 60 minutes (16:00 – 17:00 Chicago Central Time) for a EUR futures. It is important for each trader to know during what periods of time the currency market has the highest liquidity. The European and American trading sessions could be referred to such periods.
BASIC PRINCIPLES
You can easily identify a big volume with the help of Footprint through analyzing the form, colour and numeric values of this analytical instrument. Independent of the applied cluster chart type, you deal with quantitative indicators of volume in various forms. Volume distribution in a cluster is presented in the Footprint profile in the form of a horizontal bar chart.
While analyzing the Footprint chart, it is important to pay attention to how clusters correlate with each other. Here are some questions, which you can ask themselves when analyzing a cluster chart:
- Does the volume increase when the price goes up/down?
- Is the POC level (Point Of Control or the price level with the highest volume) of the current bar higher or lower than the previous bar?
- What is the POC colour? How do the volume or delta correlate with the volume or delta of another bar?
- What prices has a comparatively big volume passed through?
- When does the trading instrument trade in the flat and what is the volume on the high and low of the trading range?
- What is the form of Footprint profiles?
EXAMPLE
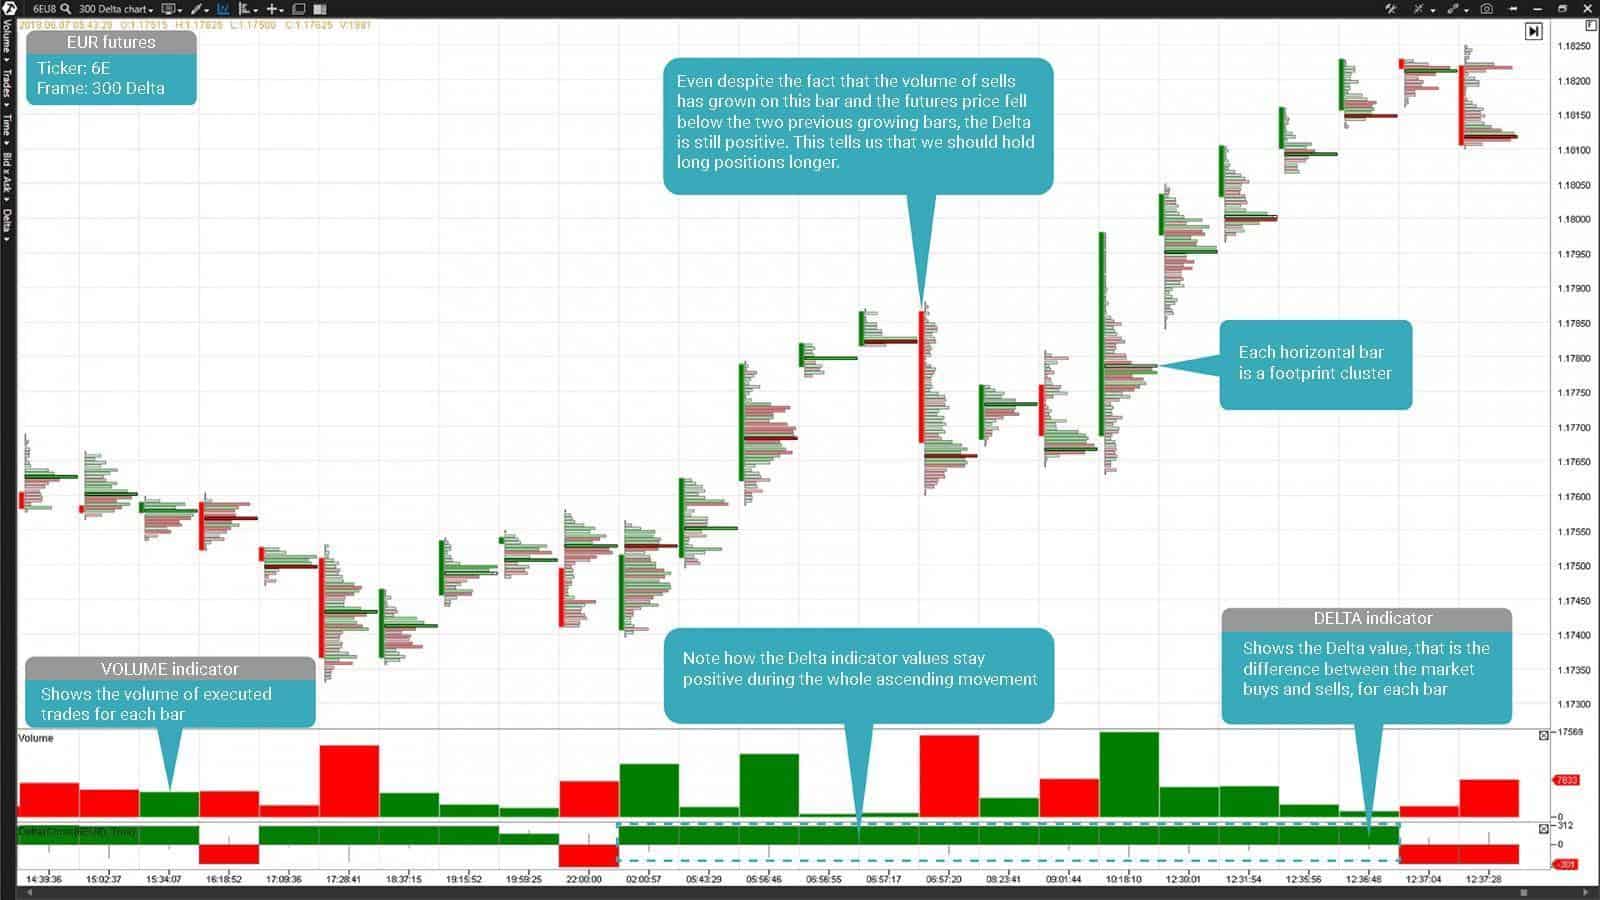
Footprint will help you to answer these questions by providing the necessary exchange data in a structured form for making a decision. You will not be able to analyze this information efficiently without Footprint. In the picture below, the profile Footprint clearly shows where the high volume passed and who played the role of a predominating side in the trading – buyers or sellers. The predominating side could be identified by the cluster cell colour in the Footprint chart and by the colour of the bar delta, located in the lower part of the window under each bar. The bar delta shows overweight of buyers over sellers. It should be used for confirmation of the movement direction, which you monitor.

The EUR futures (ticker: 6E) Footprint chart, built by Delta with the value of 300 contracts.
The ascending movement should be confirmed by the green colour of the bar delta. The descending movement should be confirmed by the red colour of the bar delta. If there are no such confirmations, a trader should doubt stability of such a price movement in the short-term perspective. One of the reasons for the emergence of such a situation are short-sighted aggressive buyers and sellers, who strive to make fast profit. If the market does not move towards their profit in the immediate future, they may exit their trades. Using Delta and Footprint colours will help you to assess the placement of forces in the market on any timeframe, in spite of the price ‘noise’.
In case this material has been interesting for you and you want to expand your arsenal of analytical instruments, available in the ATAS platform, we recommend you to get acquainted with a series of articles about the strategies of Footprint usage: Strategy of using the Footprint through the example of E-mini S&P 500, Strategy of using the Footprint through the example of Russell 2000 E-mini, Strategy of using the Footprint through the example of WTI oil, Strategy of using the Footprint through the example of gold and Strategy of using the Footprint through the example of Dax.
If you decided to apply the above-listed strategies to the futures currency market, you should remember that each financial instrument is characterized with a different volatility level and liquidity volume. That is why values, used for setting frames in these strategies, could differ from the optimal values, required for efficient trading in the futures currency market.


