Strategy of using the footprint through the example. Article 1
In this article we will consider yet another strategy of applying the Footprint chart, this time for trading in the Russell 2000 E-mini market, which is quite popular among retail traders. The main reason for its popularity is that a lot of price movements and reversals take place in it. It facilitates emergence of wonderful opportunities for entering the market and exiting from it. Strong and stable trends are observed in the Russell 2000 E-mini market, that is why it fits long-term traders.
You can use a tick chart with the period of 233 or 377 ticks, volume chart with the period of 1000 and a chart built by Delta with the period of 250 in this market apart from the frames based on time. Flexible and intuitively clear settings of the trading and analytical ATAS platform would help a trader to easily set any of the described timeframes for an advanced volume analysis of the market. For this article we selected an example of a tick chart of a Russel 2000 futures mini-contract with the period of 377 ticks, which we describe below.
In this article:
- Basic principles.
- Historical background in brief.
- Example of Russell 2000 E-mini.
Basic principles
There is a multitude of forms and variations of reversal patterns known to nearly every trader. Their description could be met practically in any decent book about the technical analysis. These are a double/triple peak, double/triple bottom, external bar (absorption) and so-called ‘pivots’ (long candle shadows).
We do not set a goal to describe all traditional reversal patterns here. We rather wish to show how the Footprint reflects some of these formations and also why standard patterns bring us much more valuable information in combination with the Footprint. Distribution of volume in the form of clusters would allow you to look at the standard price patterns from a different angle and distinguish a true reversal from a probable tendency continuation.
One of the key parameters of the reversal identification is volume. General rules of the volume analysis:
- Important highs and lows are formed in the market after the emergence of relatively high volumes.
- Retest of an extreme point at low volumes is often a sign of a level testing by the price, which has no strength to break it.
- Retest of the support/resistance at high volumes provides traders with information that the level, most probably, would be broken.
- Volume helps to assess significance of one or another price pattern.
- Volume gives confirmation of the trend direction. Use Footprint to get an idea of when and how a market reversal takes place.
- Volume mainly increases in the trend direction and decreases at countertrend movements.
- Pay attention to what point of its range a bar is closed in. If there is a focused movement inside the bar but then the market reverses and closes near the opposite extreme point, there is a high probability that the movement was held back.
Historical background in brief
The main reason of success of many traders, which traded in the pit (on the floor), was that they had information about real volumes. This useful information helped them to accurately identify demand and supply at important price levels during the whole trading day. Many of these traders faced difficulties after introduction of electronic trading platforms. What is the reason? Most probably it is connected with the fact that the traditional methods of building charts failed to provide them with comfortable visualization of the order flow and volume distribution, which they had once.
Inefficient traditional representation of the market information was replaced by a revolutionary innovation – Footprint. At last the traders got a possibility to analyze data from the exchange and distribution of the traded volume at each price. The Footprint (cluster chart) satisfies the requirements of the most sophisticated traders in the best way possible.
Example of russell 2000 e-mini
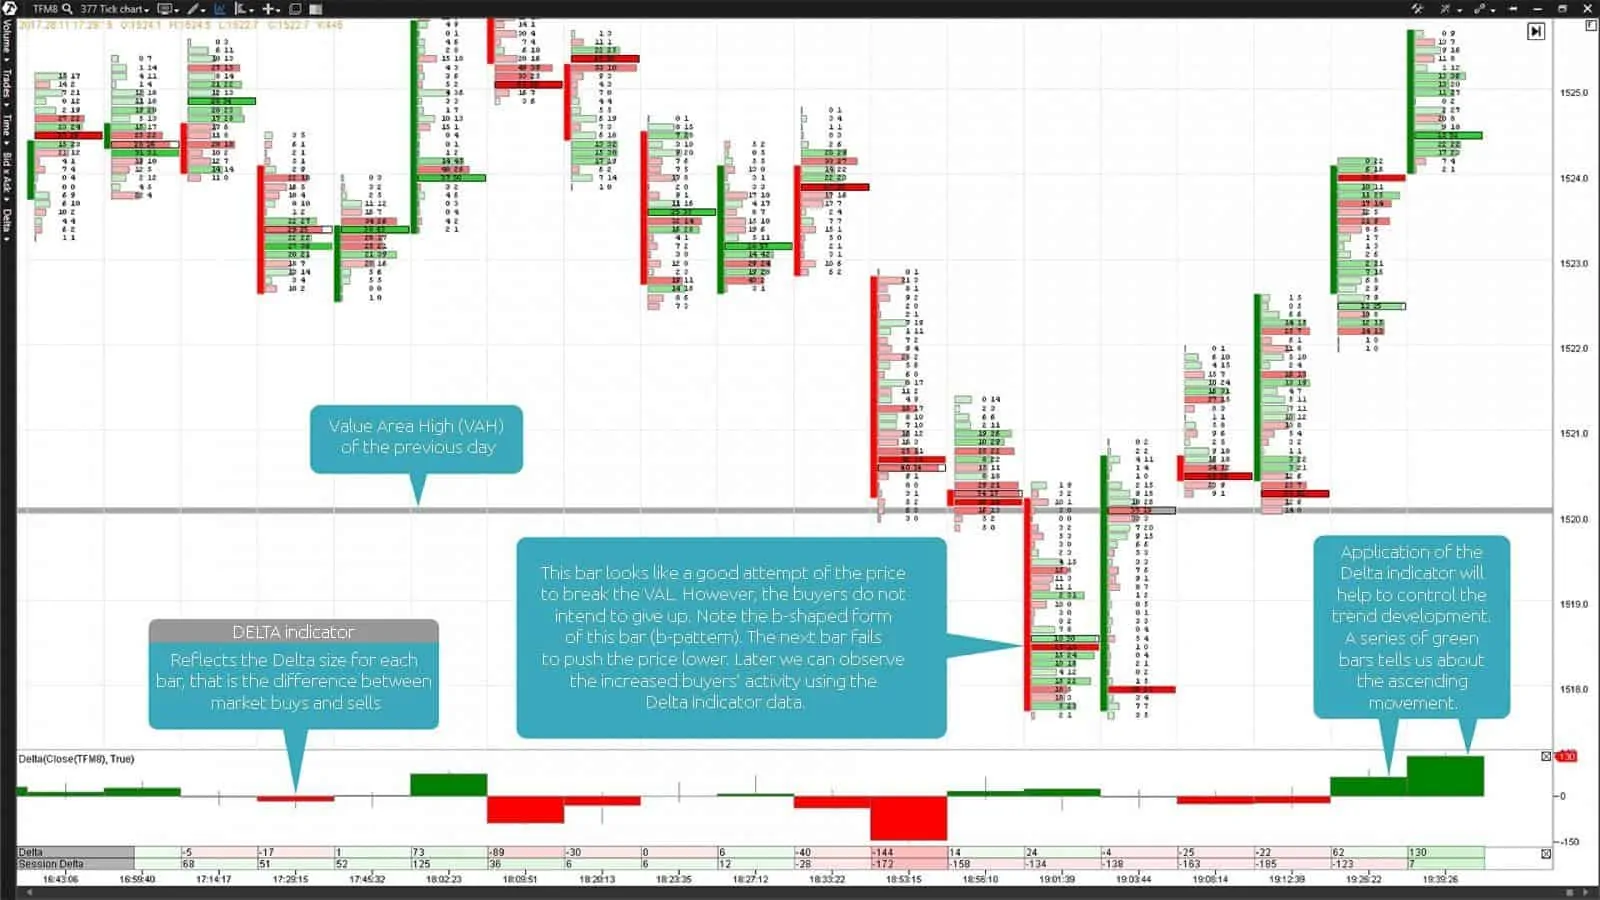
Chart 1. An E-mini Russell 2000 futures mini-contract is represented by the already familiar Footprint chart, but which is built on ticks. The period of 377 ticks was used when building this chart. As you can see, the price found support and sharply bounced in the opposite direction at the next growing bar after formation of the b-pattern at the falling bar, which made a false breakout of the previous day’s Value Area High (VAH).
Wide areas of the highest volume inside the two bars under the question point to the emerging fight between the market participants. This fight took place at the lower part of the falling bar with the b-pattern and below the VAH, while the fight between buyers and sellers at the growing bar went on in its upper part within the previous days’ VAH.
Take a note of the bright-red block at the basis of the bar under the question which moved the price above the previous day’s VAH. This bright-red block tells us that a maximum volume of contracts was traded at this price level at a certain moment of time and sells dominated over buys. However, the sellers failed to protect their positions by the moment of closing this bar and the price sharply increased leaving them in the loss-making positions.
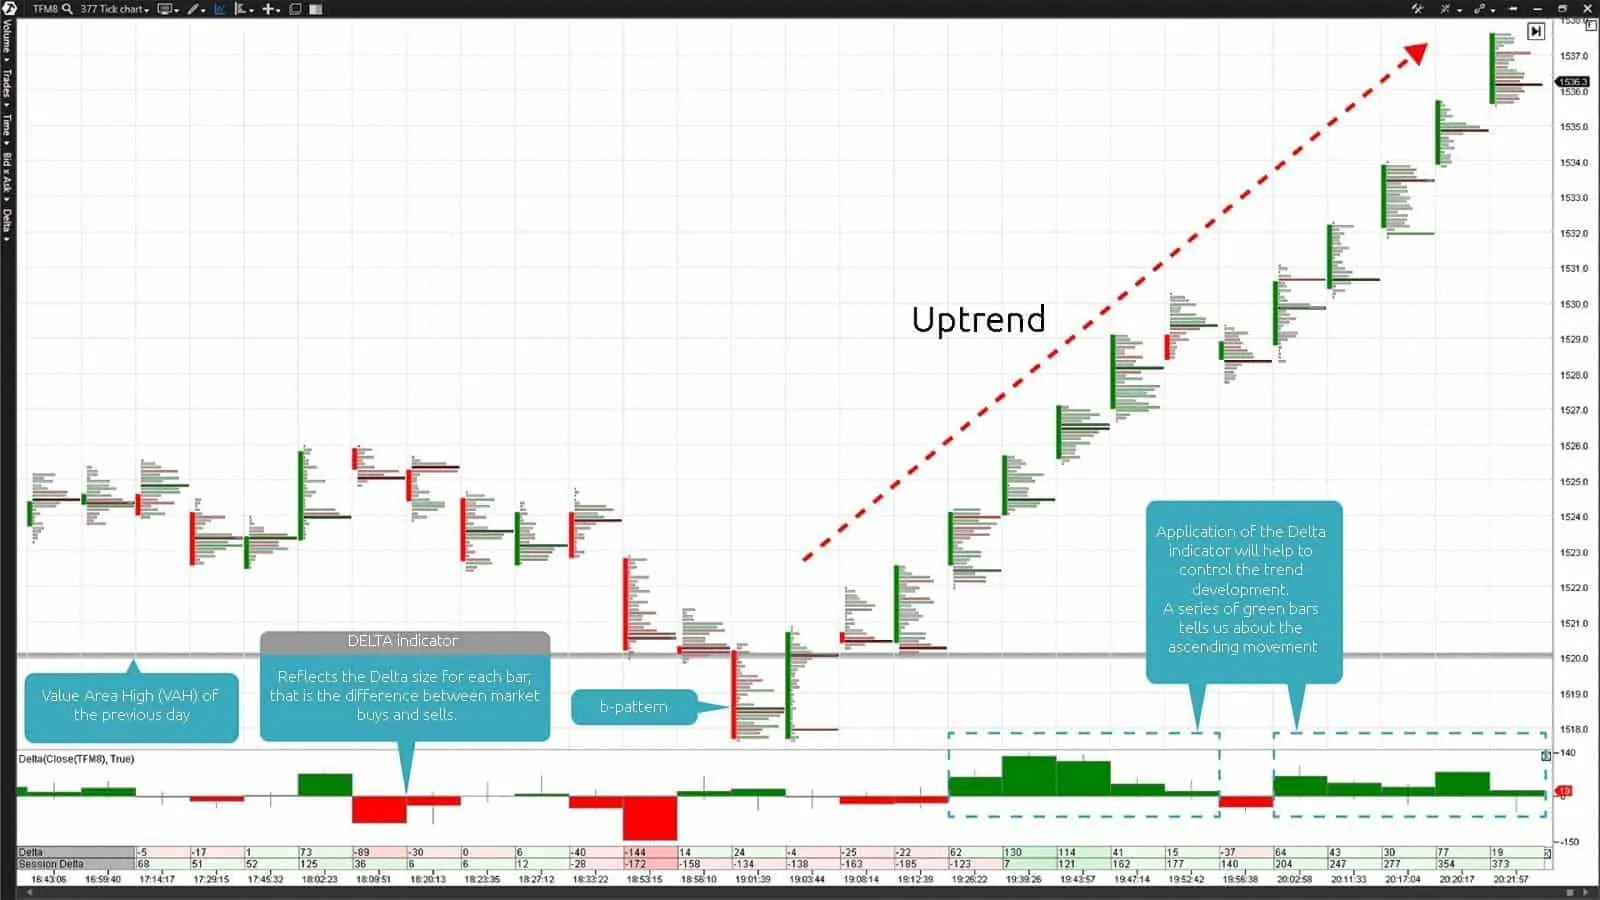
The price managed to take hold above this area and start to grow in the result of its bright reaction after a false breakout of the previous day’s VAH. Note the Delta indicator values, outlined with a blue dashed line, from the moment of the price growth in Chart 2. The ascending movement of an E-mini Russell 2000 futures is confirmed by a series of green Delta bars, which is a sign of presence of aggressive buyers in the market.
As you can see, the E-mini Russell 2000 futures price sharply increased in the result of the uptrend. However, as you already know, the market cannot constantly move in one direction without passing the correlation and consolidation phases. That is why, if you observe the price movement of this type, you should think about a complete or partial profit registration.
Chart 2. The tick frame of an E-mini Russel 2000 futures with the value of 377. The Footprint chart and Delta and Cluster Statistic indicators in the lower part of the chart.
Check for new publications about the strategies of use of the Footprint charts of the trading and analytical ATAS platform. Good luck, friends!


