After reading this, in practical terms, valuable article, you will add the Dynamic Levels Indicator, a unique development of the Orderflowtrading team, to your list of useful indicators. We will show you how to increase probability of profit in the financial market with the help of the Dynamic Levels, on the basis of trades, which were executed in real life.
How the Dynamic Levels Indicator works
The Dynamic Levels Indicator is an instrument developed by traders for traders. It shows movement of a value area and maximum volume level in a chart with a selected timeframe.The Value Area and the maximum volume level (Point Of Control) are key concepts of the volume analysis. You can read about them in more detail in this article about horizontal volumes.
These levels are important for intraday traders, since they serve as support or resistance. The Value Area includes 68% of the volume traded during a selected period. That is, it is that area of the price, where the fair asset value is located according to a majority of traders. The name of the Dynamic Levels Indicator reflects its essence. The indicator analyzes the trading volume at different price levels and, in doing so, it tracks the dynamics of the traders’ opinion. When an asset value decreases or increases as a result of trading, the Dynamic Levels Indicator shows a new level in the chart. As a result, we have a polygonal line in the chart and can monitor dynamics of movement of both the value area and maximum volume level. Standard indicators do not allow seeing movements of levels in real time, that is why the use of the Dynamic Levels Indicator creates a competitive advantage during market trading with any timeframe. The Dynamic Levels Indicator has flexible custom settings, intuitively clear to a beginner trader. You can turn off display of the value area and mark the maximum volume level only. It could be any timeframe. You can select delta, bids, asks or time instead of the volume.
Examples of use of the Dynamic Levels Indicator
Let us consider several variants of the price behavior on approach to the maximum volume level. We work on the forward market. An intraday EUR futures.Example 1.
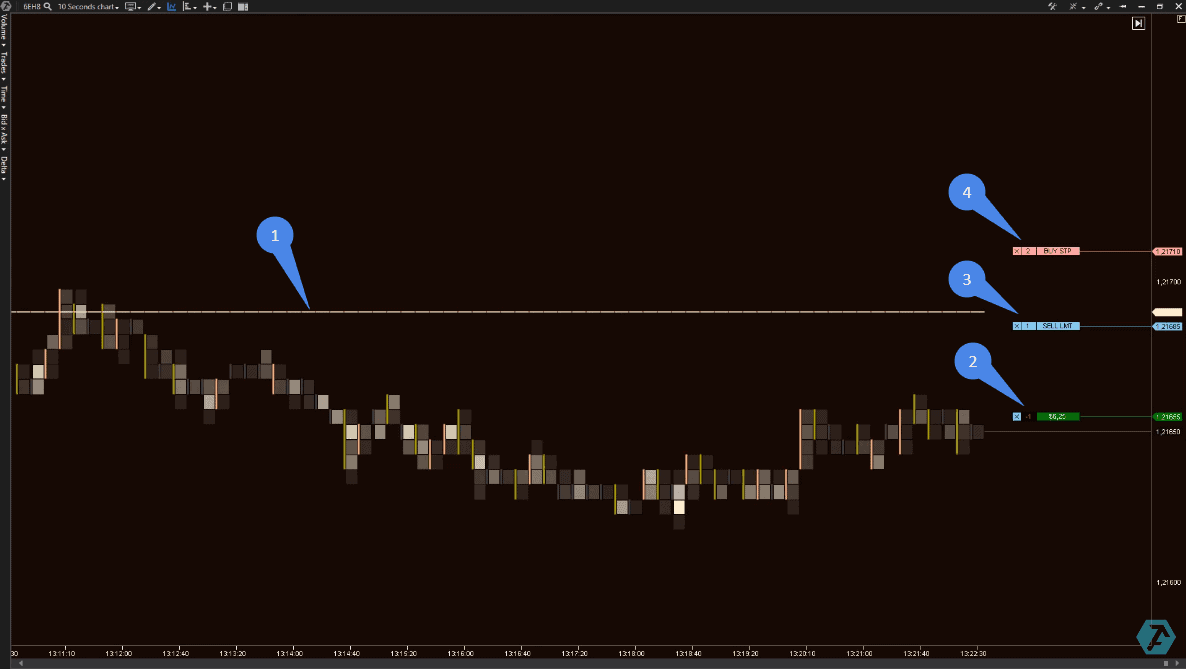
- The resistance level, found by the Dynamic Levels Indicator. The price bounced down from this level, confirming its validity. Note the bright clusters. This is the sellers’ pressure, they make efforts to reduce the price;
- We open a trade for selling with a market order;
- We post a sell stop just in case the market decides to test the resistance once again;
- We post a buy stop, which limits potential losses, above the resistance level.
What happened next?
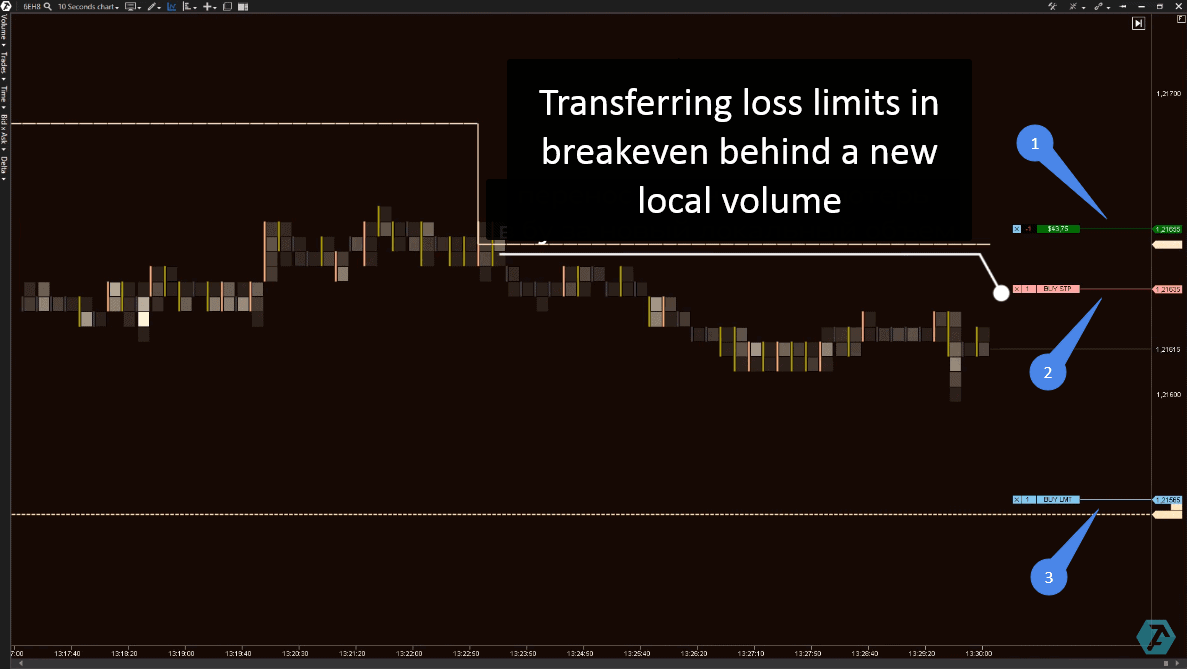
- The price continued to decrease and our trade made money;
- We protected the profit;
- We posted take-profit.
Example 2
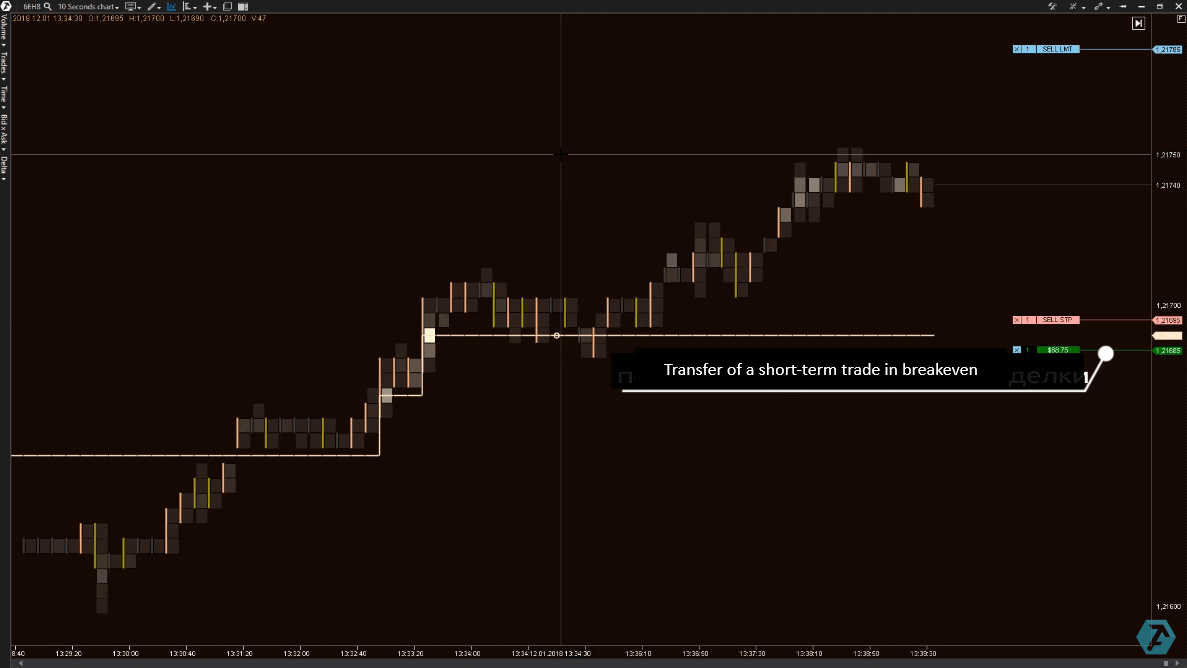
The level bottom-upward breakout is an idea of a buy trade.If aggressive buyers break a strong level bottom-upwards, we have ground to expect the further price increase. The Dynamic Levels upward shift (the dashed line) confirm availability of buyers.
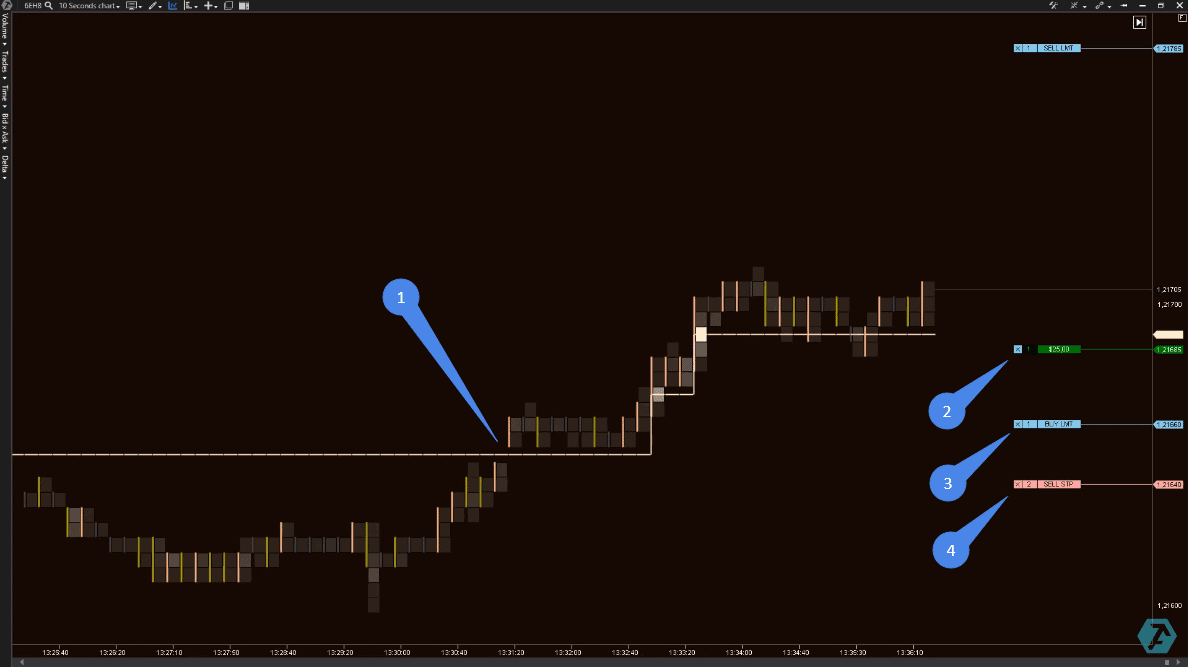
- Dynamic Levels breakout;
- Entry into a buy trade by a market price;
- Post a buy limit in case of a breakout test;
- Protect from losses with a stop loss order.
Further on, the price confirmed the forecast and we moved the stop loss into the profit area.
Summary
Note. The goal of this article is not to give a specific setup for buying when the level is broken and for selling at a reversal from resistance. The goal is to show capabilities of the ATAS platform.The use of such unique indicators as Dynamic Levels in trading not only expands your possibilities, but also allows responding to emerging trading opportunities prior to other traders.

