The Alligator is an indicator that was developed by a famous trader Bill Williams. He also described the trading strategy of the same name that uses the Alligator indicator.
Since the strategy / indicator was created in 1995, the Alligator has been actively used all over the world. This article is about:
The idea of the strategy
In order to understand how the Alligator works, let’s start with moving averages.
Moving averages (MA) are perhaps the most popular indicator among traders. It is used in various ways, even for building trading strategies. For example, you can use:
one moving average. If the price crosses MA line from below, it is a sign that it is time to buy; if it crosses from above, it is time to sell.
two moving averages. If a fast moving average crosses a slow moving average from below, it is a sign that it is time to buy; if it crosses from above, it is time to sell.
The above strategies have a few disadvantages. Firstly, moving averages are a lagging instrument by their nature, as they follow the price. Secondly, the strategies assume that the market is always in a trend: up or down. They exclude the flat stage, which is totally wrong, because markets are flat most of the time.
We assume that the author of the strategy, Bill Williams, wanted to correct this shortcoming by adding one more MA. His Alligator strategy is based on 3 moving averages, and if:
a fast moving > a medium > a slower moving averages move up, this is an upward trend;
a fast moving > a medium > a slow moving averages move down, this is a downward trend;
if lines cross each other, the market is flat.
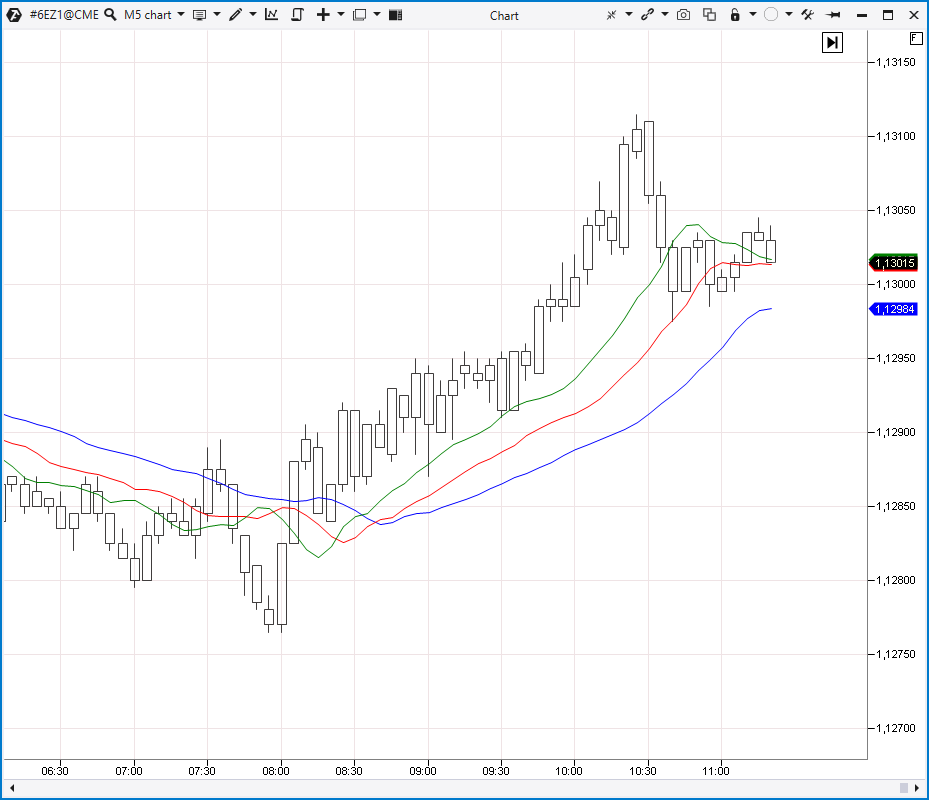
This is how the ↑ indicator looks like on a 5-minute EUR futures chart.
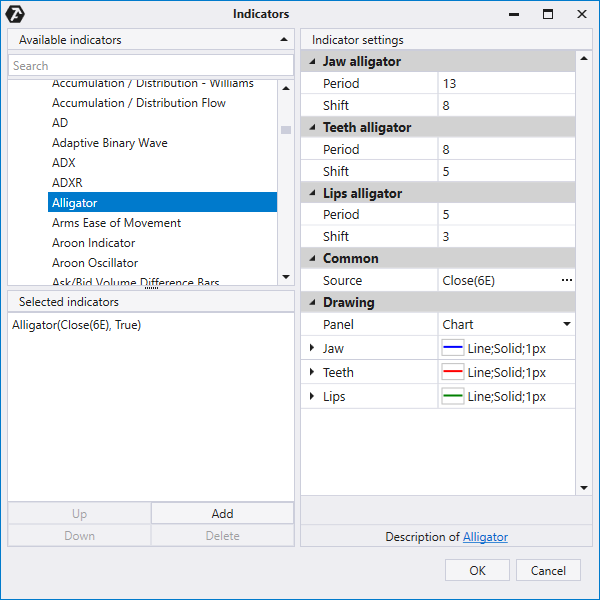
How to add the Alligator Indicator
To add the Alligator Indicator on the chart in the ATAS platform:
The Alligator Indicator consists of three lines:
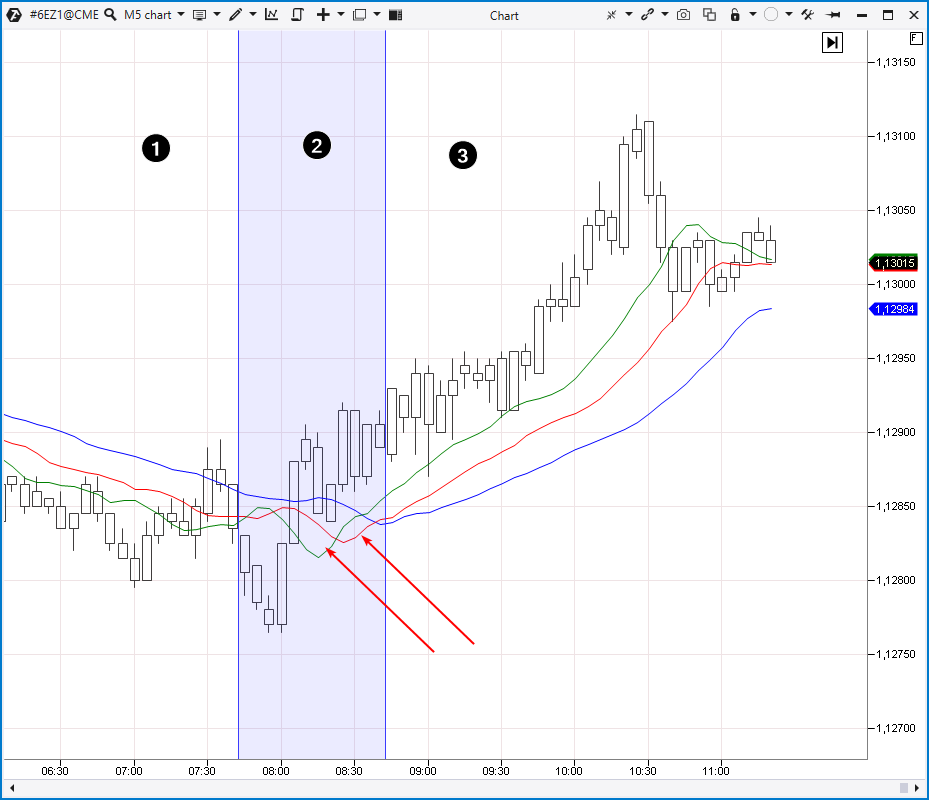
Number 1 indicates a downward trend, number 2 indicates a flat, number 3 indicates an upward trend. Red arrows indicate how the Alligator “wakes up”: first, the green line of the “lips” turns up, then the red line of the “teeth”.
How to trade using the Alligator indicator
The Alligator indicator leaves enough freedom for building trading strategies.
According to the simplest approach: as soon as the lines are set in the right order, you should open a position in the direction of the trend. When the lines indicate that the trend is over, you should exit the position.
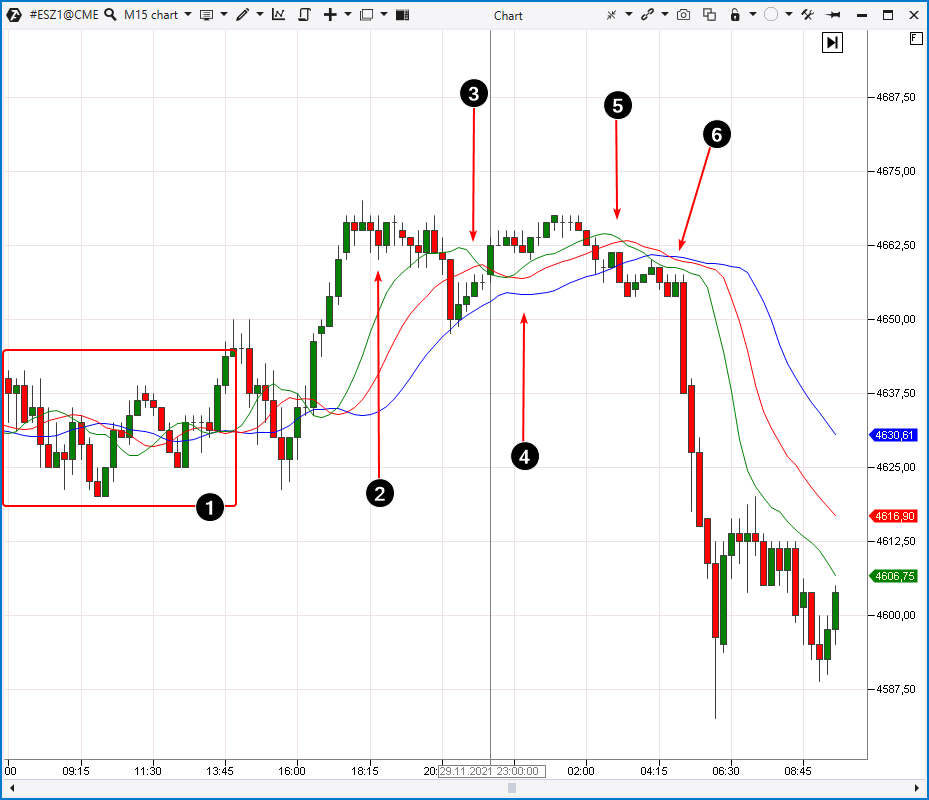
An example of such trading is shown on the E-mini S&P-500 futures chart below, period = M15.
Number 1 indicates a flat when the Alligator is sleeping.
Then there is an upside momentum which is quickly exhausted. There is no clear signal because as soon as the slow blue line moves up, the fast green line is already moving down.
The “permission” to enter a long position on the Alligator indicator occurs at point number 2. However, the price has already gone high enough from the lines, moreover, it is time for the American session to close. Taking all these factors into account, we can see that the potential is low but let’s say we enter the long position.
Number 3 indicates that the green line moves down, though the order of the lines has not been changed yet. This is a signal to exit the long position. The result is negative.
Number 4 shows another signal to enter the long position. Despite the fact that the market is low volatile during the Asian session, the Alligator indicates that traders should be ready to go long as soon as the blue line moves up.
Number 5 indicates the exit from the long position, as the green line moved down. There is another loss.
Number 6 indicates the entry for the short position, since both the order of the lines and their direction indicate a bearish trend. This entry turns out to be very successful because the price drops sharply. The profit from the short position covers the losses from two previous positions with plenty to spare.
Advantages and disadvantages of the Alligator
Advantages:
It is easy. It consists of three MA.
You can profit from big trends.
It tries to avoid trading during flat periods.
Disadvantages:
A lot of false signals.
It does not take into account the time factor.
This is a lagging indicator. When you get a signal to enter the long position, the price has already covered a significant distance in the direction of the initial momentum.
How to combine the Alligator with cluster analysis
Trades from all over the world have come up with various recommendations to increase trading efficiency with the Alligator Indicator. For example, to trade candlesticks patterns on short-term timeframes in the direction of the trend, which is shown by the Alligator on a higher timeframe.
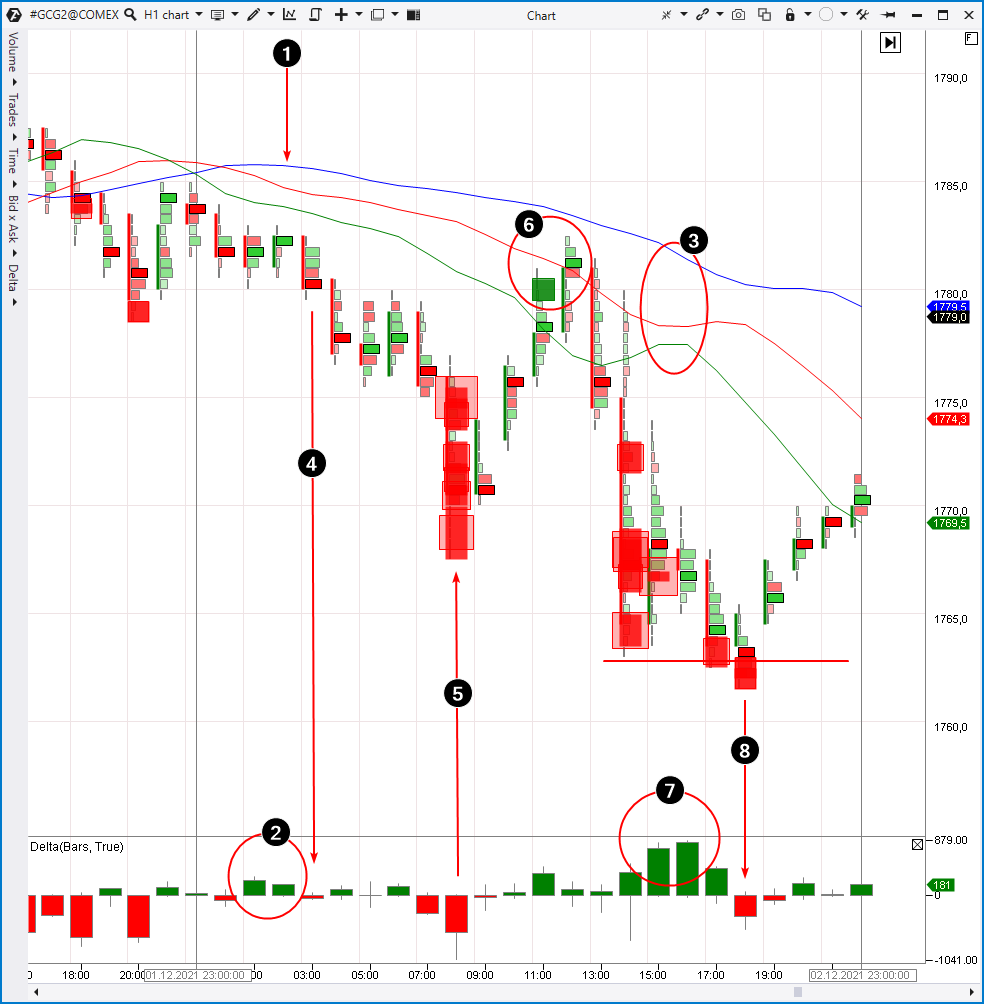
The picture below shows a gold futures chart, hourly timeframe. The data was taken from the COMEX exchange (part of the CME Group). Delta and Big Trades indicators have been added to the chart.
Number 1 indicates that the entry conditions to go short according to the Alligator strategy are met. Please note that cluster analysis confirms the validity of the short entry, as the buyers’ efforts, noticeable on the Delta indicator (2), do not demonstrate any progress in the form of price growth. If the price does not rise despite the buys, the chances of its decline increase. This is what eventually happens when sellers appear (4).
The position starts to bring profit. When should you exit? When the Alligator lines get closer to each other (3)? Yes, it is possible or you can hold the position until the lines crisscross each other (the Alligator “falls asleep”). The final decision is at trader’s discretion.
Cluster analysis provides more valuable information for decision making.
Pay attention to the events that happen on the candle marked with number 5. The Big Trades indicator shows large single sales at the market price. However, the candle does not close at its lows. Moreover, we see a long tail on the Delta indicator which means that a buyer has entered the market. It is reasonable to expect a bounce off 1770 level under these conditions. Unfortunately, the Alligator indicator is not able to capture these important nuances for analysis.
The appearance of the buyer leads to the price increase marked with number 6. Here we see that the Big Trades indicator has been triggered. However, this time the square is green, which indicates large buy market orders. Most likely, this is a local buying climax within the day.
There is a high probability that the peak of buys at number 6 has a significant number of shorts that are closed by stop losses set above 1780 level. Having activated these stop losses, the market goes down, which is a huge disappointment for traders.
The 14:00 candle demonstrates a series of the Big Trades indicator triggers. It seems that in those moments the market was dominated by panic but look at the Delta indicator. There is a long lower shadow on the 14:00 candle; it indicates that at some point buyers appeared in the market and “outweighed” the sellers with their activity.
The Delta indicator shows (7) that buyers did not disappear on following candles. It proves that the downtrend got significant support.
Number 8 indicates an attempt to go down but the price only “thrust” the previous low, set by the candle at 14:00, and quickly returned up. This movement dynamic is typical for false breakouts aimed at activating buyers’ stop-losses. Surely the red squares of the Big Trades indicator on candles at 17:00 and 18:00 show the closing of longs by stop losses. Having made such conclusions, a cluster chart reader may decide to close the short, as the downtrend within the day exhausted itself. At the same time, the Alligator indicator did not give even a hint of closing shorts.
From our point of view, the best entry points for the short position were the tops marked with number 6. According to traders’ terminology in moving averages it was a test of the MA (8), but does it sound convincing enough to risk your money? The information obtained from the cluster analysis method sounds more reasoned.
How to start trading
There are a lot of useful volume analysis indicators in the ATAS platform. They can improve your trading strategy by the classic Alligator indicator.
Download ATAS to see for yourself.
The demo version is free and you can continue using the program even after the 14-day trial period.
The Alligator indicator is included in the package, as well as Big Trades, Delta, market profiles and other indicators.
There is a demo account built into the ATAS platform, so you can practice trading without risking your real capital.
Read our blog and subscribe to our YouTube channel to find life hacks and ideas that will help you to trade efficiently with the ATAS platform.
Conclusions
The Alligator is a simple and popular indicator and a trading strategy. The creator is Bill Williams.
The Alligator Indicator consists of three moving averages. Their position to each other indicates whether there is:
an upward trend;
a downward trend;
a flat in the market.
If you like the idea of the classic Alligator indicator (and analogies in interpreting its signals), you can use it, for example, as a trend filter. However, to increase the accuracy of entries and exits, try combining the Alligator with advanced volume analysis methods.
Download the free version of ATAS right now! Try a powerful cluster chart analysis tool for stock, futures and crypto markets.
Information in this article cannot be perceived as a call for investing or buying/selling of any asset on the exchange. All situations, discussed in the article, are provided with the purpose of getting acquainted with the functionality and advantages of the ATAS platform.