A Bearish Pennant is a popular pattern to enter trades in the direction of a developing downtrend.
Below is useful information for those interested in effective trading using this pattern. Special attention is given to professional volume indicators, which help improve entry accuracy and confirm the strength of the signal from this pattern.
What is a Bearish Pennant?
A Bearish Pennant is a type of narrowing triangle pattern that appears on the price charts of financial instruments (futures, stocks, currencies, cryptocurrencies). These patterns are frequently seen across various timeframes.
The key characteristic of the triangle where the Bearish Pennant forms is its symmetry (the central line or axis is horizontal). Once the Bearish Pennant appears on the chart, the price is expected to resume its downward trend, which is what traders and investors anticipate.
How to Identify a Bearish Pennant?
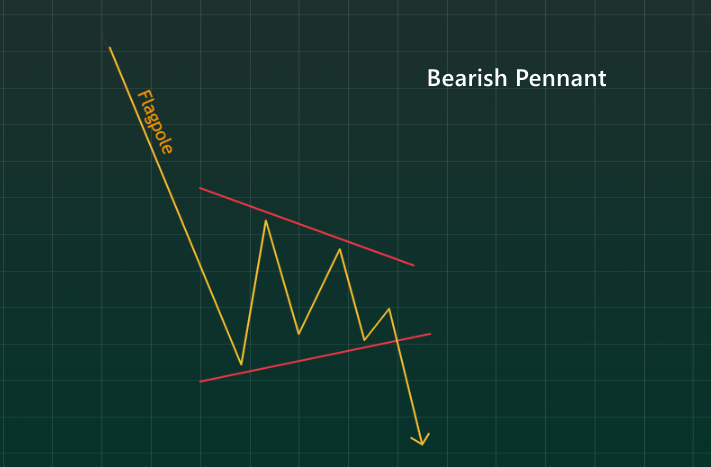
To accurately identify this pattern on a chart, three key components must be present:
1. Downtrend in the background. Ideally, the price should be dropping rapidly, creating the “flagpole” of the pattern.
2. Pennant. This is a symmetrical triangle formed by converging support and resistance lines. Ideally, price fluctuations should taper off in a narrow range, meaning the pennant should be “compressed” or “tight”.
3. Breakout. A price drop below the support level signals a continuation of the downtrend (this is the signal to enter a short position).
Example of a Bearish Pennant on a Chart
A 30-minute chart of oil futures (with the cluster function in the ATAS platform) shows the downward price movement in April 2025, when markets were unsettled by the escalation of the tariff war and its impact on international trade. The expectation that the global economy might contract pushed oil futures prices lower. On the chart, a Bearish Pennant is clearly visible.
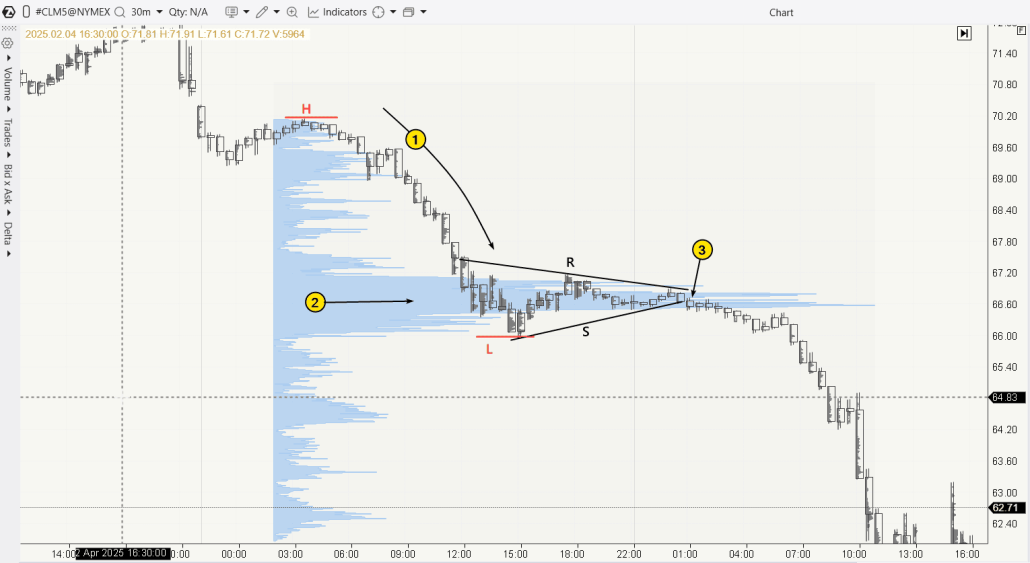
The acceleration of the downward movement (1) began during the Asian trading session and continued into European trading. During this time, most of the flagpole (or blade) of the Bearish Pennant formed between the levels H and L.
During the US session, demand and supply balanced each other, and the price of oil entered a consolidation phase between the R and S lines, forming a narrowing symmetrical triangle. Meanwhile, the market profile indicator peak (2) confirmed that the prevailing price satisfied both buyers and sellers.
The balance was broken (3) at the very beginning of the following day when the price dropped below the S line. This indicated that the downtrend could continue, which was confirmed later.
What does a Bearish Pennant Pattern mean
From a technical analysis perspective, a Bearish Pennant is the result of the market constantly alternating between two main phases: a trend phase and a consolidation phase.
Stage 1: Flagpole (Sharp Price Drop)
| Behavior | Psychological State | |
| Buyers | Panic sell long positions manually or through stop-losses | Fear, confusion, desire to “preserve at least some of the assets” |
| Sellers | Confidently increase positions | Euphoria from victory, aggressiveness |
From a trading psychology standpoint, a Bearish Pennant reflects a shift in market sentiment balance.
The price drop during the Flagpole stage typically occurs on higher volumes, usually as a reaction to a major news event or a break of a significant level. Emotions are a key driver during this phase.
Stage 2: Pennant (Consolidation)
| Behavior | Psychological State | |
| Buyers | Hope for a reversal, averaging down, waiting for a “pullback” | Denial, hope |
| Sellers | Take partial profits, wait, add to positions during short-term recoveries to resistance levels | Confidence, control |
The narrowing of the Bearish Pennant boundaries indicates a decrease in volatility. The balance between buyers and sellers seems equal, but this is a temporary condition. Behind the candlesticks on the chart, there is an accumulation of potential (fuel) for further price decline. Inside the pennant, there is a psychological battle between buyers, who are facing losses, and sellers, who remain calm.
Stage 3: Breakdown
| Behavior | Psychological State | |
| Buyers | Panic sell, close remaining positions | Desperation, capitulation |
| Sellers | Increase pressure, open new positions | Triumph, reward |
The breakdown is typically accompanied by an increase in volume, reflecting the decision-making process in trading, including those influenced by emotions.
How to Trade a Bearish Pennant Pattern
When trading a Bearish Pennant, traders expect the downtrend to continue with renewed strength after a temporary period of consolidation.
Step-by-Step Trading Strategy
The classic approach to trading a Bearish Pennant based on technical analysis includes the following strategy:
Step 1. Identify the formation of the pattern. There should be a sharp price decline behind a Bearish Pennant.
Step 2. Wait for a breakdown. It’s important not to miss the moment when the price breaks below the lower boundary of the pattern with increasing speed.
Step 3. Enter a trade. For example, a trigger to sell could be when a candlestick closes below the support line, with confirmation from increased selling volume and a negative delta imbalance.
Step 4. Maintain control until the exit signal. Control can be maintained via stop-loss, take-profit, or manually.
Where to Place a Stop-Loss
When studying resources on trading Bearish Pennants, the following elements are often mentioned on the chart:
- The upper line R.
- The intermediate local high, usually formed just before the support S is broken.
Additionally, market profile levels (such as POC or VAL levels) can be used. This is particularly relevant when you need to minimize risk, for example, if a Bearish Pennant is too wide or the instrument’s lot size is too expensive.
How to determine a target for a take profit
The classic approach assumes that the height of the flagpole should be measured from the point of a bearish breakdown of the lower border of the “bearish pennant” pattern. This allows you to find a benchmark for setting a take profit. In other words, the calculation is based on the assumption that the trend movement after the breakdown will be no less long than the initial movement that formed the flagpole.
Thus, the narrow compressed proportions of the pennant and the long length of the flagpole create a relationship in which the risk is significantly less than the potential reward. However, in real markets, situations may differ.
Let’s look at practical examples on charts for a more realistic understanding of what “bearish pennant” trading looks like, as well as how goals are achieved and risks are controlled.
Examples of Bearish Pennant Trading
The variety of financial markets creates numerous opportunities for identifying Bearish Pennant patterns. Let’s look at three examples that, while not covering all typical scenarios, provide insight into trading this pattern.
Example on the Apple (AAPL) Chart
This pattern formed intraday between the R and S lines after the market opened with a wide bearish gap. We will consider the gap as the flagpole for the pennant.
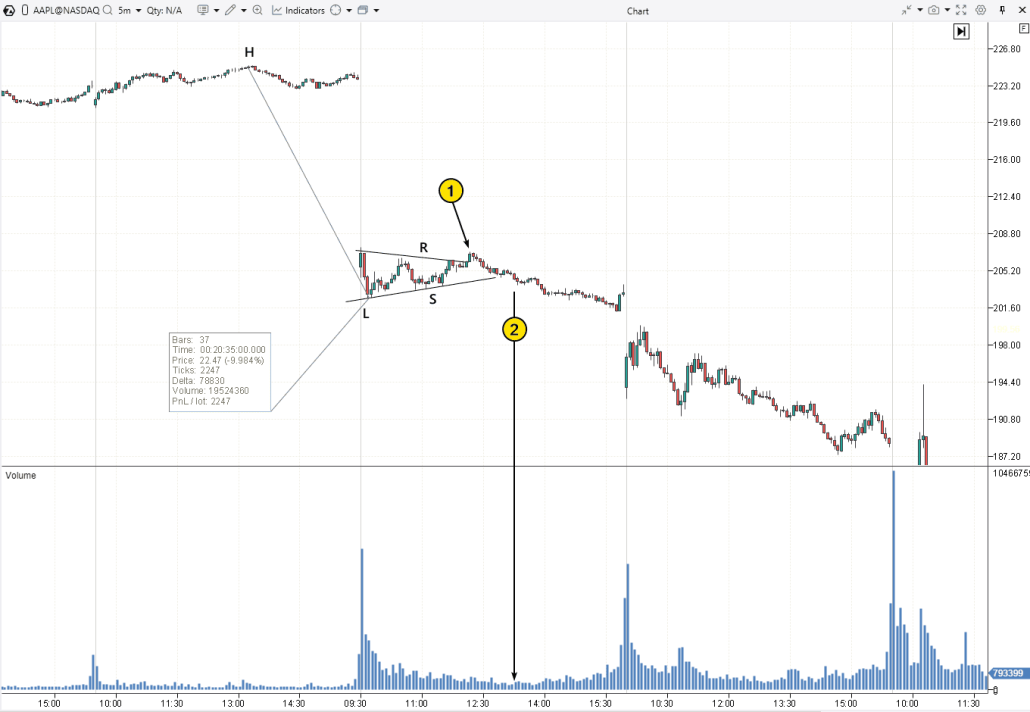
(1) False breakout in the upward direction. Clearly, many buyers got into a bull trap.
(2) After the breakout turned out to be false, the breakdown proved to be valid. Although the volume increase (a sign of selling pressure) was modest, the volume on the breakdown candle was higher than the previous two.
If we project the distance H-L from the breakdown level of the Bearish Pennant, the chart shows that the take-profit was reached. However, considering the nature of stock trading and large gaps at market open, the risk increases — the stop-loss may trigger at a much worse price than originally calculated.
Bearish Pennant on the NQ Futures Chart
Let’s look at the formation of a Bearish Pennant in a broader context on the first chart, and on the next one, we’ll examine some interesting details on the footprint.
(1) A news event triggered a strong bullish impulse. However, over time, the effect of the news faded, eventually leading to a reversal downward.
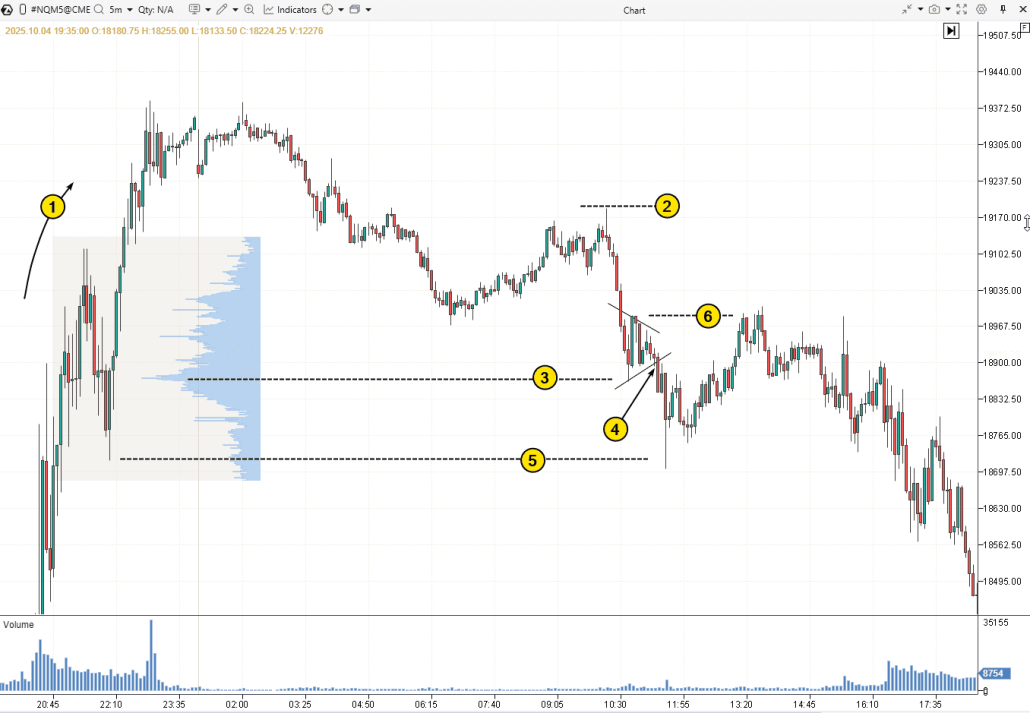
A small yet effective upthrust with a peak at level (2) marked the starting point for the accelerating downward movement, which later turned into the flagpole for the Bearish Pennant (denoted by converging lines).
From a volume analysis perspective, the price bounced off the level of significant volume (3) from the previous day (visible on the profile), before entering a consolidation phase, but only temporarily.
The breakdown from the Bearish Pennant at (4) indicated that the downtrend could continue. However, the bears failed to gain significant ground as the price fell below a key minimum from the previous day at level (5). In the terminology of the Smart Money Concept, the price dropped into the liquidity zone (BSL) (a bullish sign).
Trading based on the classic Bearish Pennant pattern rules in this example could have led to frustration: although everything seemed to start well after the bearish breakdown at point (4), the price then rose to level (6), where the stop-loss should have been placed. Moreover, after the stop-loss triggered, the market continued downward, as the hypothetical seller had originally anticipated, but incurred a loss where there should have been a profit.
This highlights the importance of volume analysis, which helps to complement information and better understand the reasons behind price movements. For example, here’s how the breakout of the aforementioned Bearish Pennant looks on the footprint:
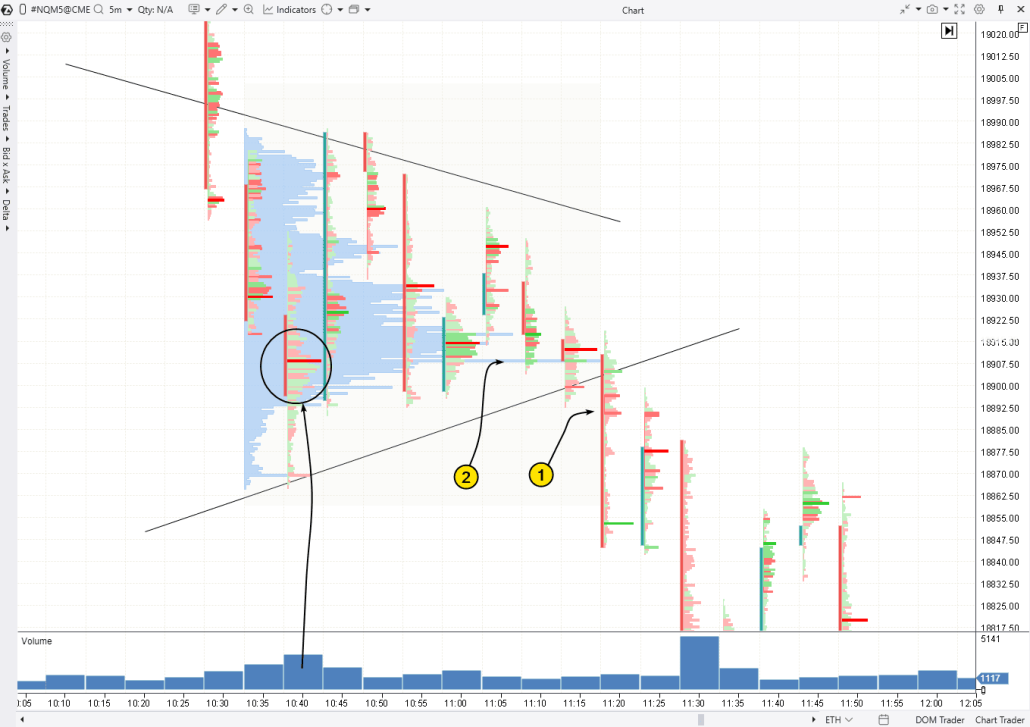
The circle marks the area of high trading activity, after which the “bear pennant” began to form.
(1) Selling pressure (noticeable through the bright red market-sell clusters) at the support breakdown. This could have been used as confirmation for the continuation of the downtrend, as well as a level for entering a short position on the next candle (testing the breakdown), supported by the dominance of the sellers.
(2) The significant volume level could have been used as a reference for placing a stop-loss. In this case, the risks were limited
Bearish Pennant on a Cryptocurrency Cluster Chart
A Bearish Pennant on the Bitcoin price chart formed with the typical heightened volatility seen in cryptocurrency markets.
Flagpole peak (1) and bottom of the flagpole (2): The market formed a consolidation in the shape of a Bearish Pennant after sellers broke through the psychological level of 80k.
Breakdown of the lower boundary of the pattern (3) and a potential entry point into a short position, with a stop placed above the significant volume level of 79,700 or, for example, 79,900 (one of the pattern’s peaks).
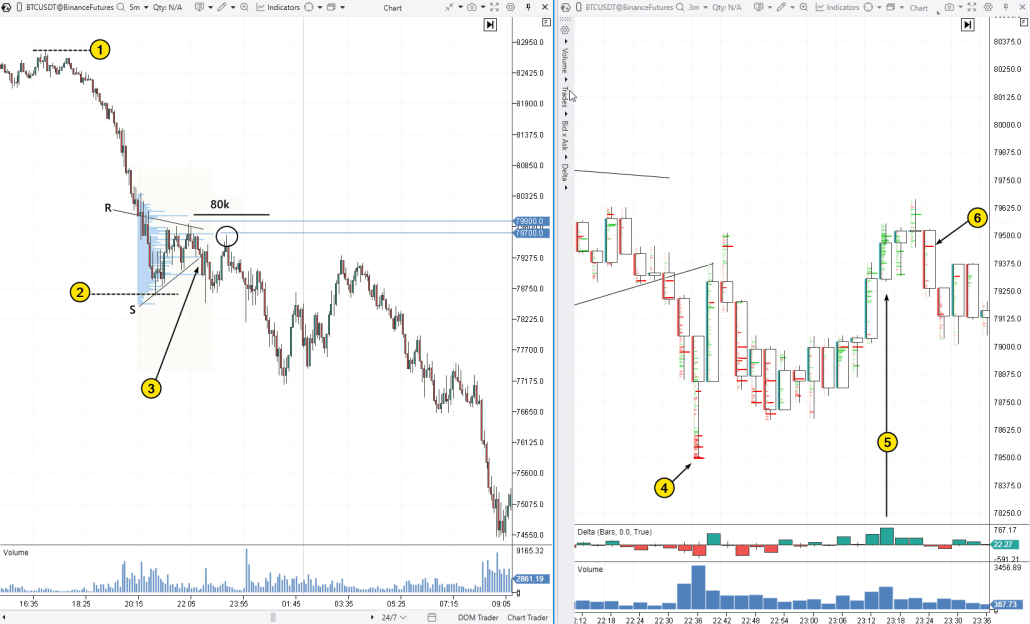
The chart on the right in Footprint Mode provides more details for a better understanding of the situation and helps determine a more precise entry point.
Local sales climax (4), followed by the price bouncing into the breakdown zone of the pattern.
Spike in positive delta (5), highlighted by bright green clusters. However, how effective are the buyers? They can’t boast significant progress in terms of continued growth (above the Bearish Pennant on the left), unlike the sellers. A small effort (6) resulted in a noticeable decline, trapping the buyers.
This example emphasizes once again how ATAS volume indicators can be useful for understanding market dynamics in various situations — particularly when trading a Bearish Pennant pattern.
Learn More:
Tips for the Bearish Pennant Trading
✔ Consider the context. A successful Bearish Pennant is formed in the context of a general downward trend.. Don’t trade the pennant out of touch with the market.
✔ Control your timing. Don’t enter the trade prematurely. Wait for the breakdown of the pennant’s lower boundary — anything that happens before this point could be a premature entry, at least according to classic rules.
✔ Seek confirmation from volume indicators. An increase in volume during the breakdown indicates the effort of sellers breaking through the support. Detailed study of the footprint may provide additional confirmations, such as a delta imbalance.
✔ Plan your trade. Determine where the price might be headed and what you will do if the market moves against you. Always manage your risks.
Differences from Other Patterns
The features of the Bearish Pennant outline and the existence of similarly named patterns in technical analysis can sometimes confuse beginner traders, leading to questions.
What’s the difference between Bullish and Bearish Pennants?
Both patterns have a similar shape (a triangle after a sharp move), but their key difference lies in the direction of the trend.
- A Bullish Pennant forms after an upward movement and signals the continuation of an uptrend.
- A Bearish Pennant, on the other hand, forms after a decline and signals the continuation of a downtrend.
Flag vs. Pennant: What’s the Difference?
“Flag” and “Pennant” are similar terms commonly used in real life, but in trading, they have distinct characteristics. Both patterns are related to continuation trades in the existing trend, but their differences lie in the form of consolidation:
- Flag: A small parallel channel, sloping against the main trend.
- Pennant: A narrowing triangle. Ideally, it should be symmetrical and aligned along the horizontal axis.
FAQ on the Bearish Pennant
How to Identify a Bearish Pennant?
ABearish Pennant is recognized by three key characteristics:
1. Flagpole, or a sharp downward impulse at the start of the pattern. This is a strong move down, often triggered by unexpected significant news.
2. Consolidation phase. The price slows down its fluctuations, forming a small symmetrical triangle. It may slope slightly up or down. Typically, trading volumes decrease, signaling a wait-and-see stance by market participants.
3. Вreakdown. The price breaks out downward from the pennant with a new impulse and increased volume, signaling a potential continuation of the trend.
How to Interpret the Bearish Pennant?
The interpretation is based on the assumption that after the first impulse, the market forms a temporary balance between supply and demand. A breakout below the pattern’s lower boundary signals that the sellers are back in control, creating an opportunity for short trades after the breakout.
What is the Success Rate of Trading the Bearish Pennant?
Different sources provide conflicting information.
For example, the resource Liberated Stock Trader, which focuses on stock market trading, concludes that the Bearish Pennant has a low success rate, with a win percentage of 54%. This is much lower than the Inverted Cup and Handle pattern, which shows a success rate of 82%.
According to various sources, the success rate when trading Bearish Pennants ranges from 32% to 72%. This discrepancy can be explained by the diversity of financial markets (instruments, timeframes, economic cycles), as well as the subjectivity in defining the Bearish Pennant and the flexibility in formulating rules for statistical collection. Unfortunately, this wide range does not provide a clear understanding of the practical application of the pattern.
Should You Trade the Bearish Pennant?
You can easily test this for yourself, taking into account your personal preferences and trading style, without risking real capital.
To do so, use the ATAS Market Replay feature, which allows you to practice in a risk-free environment.
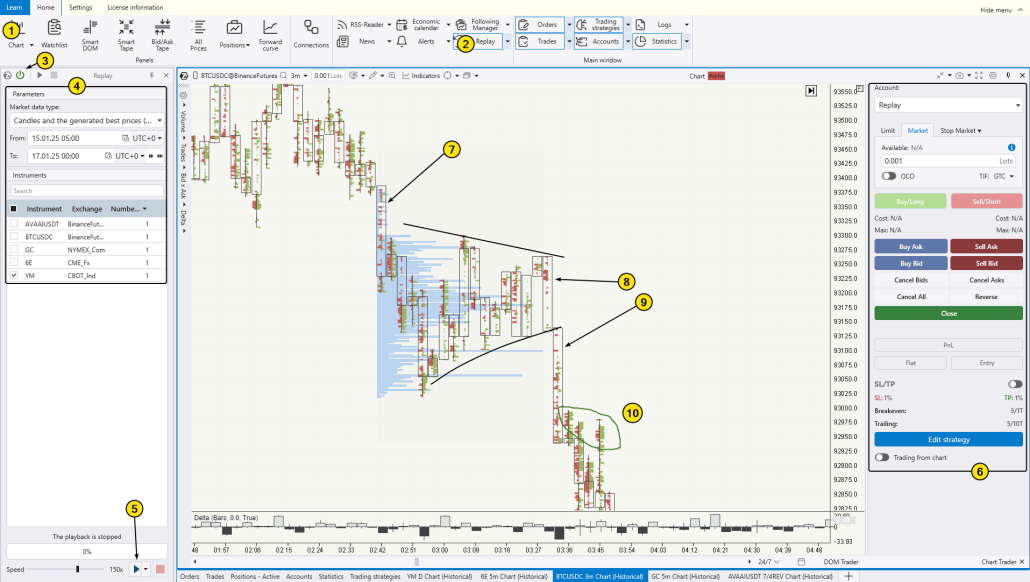
The screenshot above provides another example of a Bearish Pennant (marked with black converging lines) on a cluster chart:
(7) — The selling pressure led to a price drop. Although it’s not as prominent as recommended when assessing the flagpole’s size, the actual dominance of market-sell over buy orders adds confidence to the assumption that the market is more likely to continue the downward trend.
(8) — Another effort from sellers, pushing the price down from the upper boundary of the Bearish Pennant.
(9) — Another attempt to continue the progress after the breakdown below the lower boundary of the Bearish Pennant. Pay attention to how effective the sellers are.
(10) — Buyers tried to become active but got trapped in the upper wicks of the candles.
We hope that by now, you have a full understanding of what a Bearish Pennant is.
Conclusions
A Bearish Pennant is a continuation pattern. It is commonly found on various chart types and is typically interpreted as a pause (a breather) before the downtrend resumes. While the examples on the charts above show that the price can form significant declines, there is no guarantee that the trend will continue.
Advantages of a Bearish Pennant
✔ Trading in line with market phase shifts. You can enter at the beginning of the trend’s impulse after the consolidation phase ends.
✔ Attractive Risk:Reward ratio, especially if the pennant is “tight” and the flagpole is “tall.”
✔ Compatibility with volume analysis (like all chart patterns in trading).
✔ Suitable for various timeframes, making it a versatile tool for different types of traders.
Disadvantages of a Bearish Pennant
✘ Market risk. A breakdown of resistance may turn into a bull trap.
✘ Human error. Trading based on chart patterns often involves subjectivity and unclear rules for defining entry signals, stop-loss, and take-profit levels.
✘ When trading Bearish Pennants, it is important to consider the broader context and additional indicators, which can be challenging — especially for novice traders.
✘ Sharp support breakdowns. Often, the breakdown is abrupt, and entering a short position can occur at a worse price than anticipated.
✘ Psychological pressure. Emotionally, it’s hard to short an asset at a local minimum, fearing a potential bull trap.
Gathering data on the profitability of trading Bearish Pennants is a task filled with uncertainty and subjectivity. However, the useful tools available on the ATAS platform can help increase your trading efficiency (through volume analysis) and allow you to practice trading virtually any pattern in the Trader Simulator.
Do not miss the next article on our blog. Subscribe to our YouTube channel, follow us on Facebook, Instagram, Telegram or X, where we publish the latest ATAS news. Share life hacks and seek advice from other traders in the Telegram group @ATAS_Discussions or on Discord.
Information in this article cannot be perceived as a call for investing or buying/selling of any asset on the exchange. All situations, discussed in the article, are provided with the purpose of getting acquainted with the functionality and advantages of the ATAS platform.