
How Does a Bull Trap Work?
A bull trap happens when there are false breakouts of resistance levels. The processes involved are most clearly visible through cluster charts (footprint). To illustrate this concept, let’s look at a bull trap example on a 2-hour footprint chart of Nasdaq 100 futures, using the Delta indicator.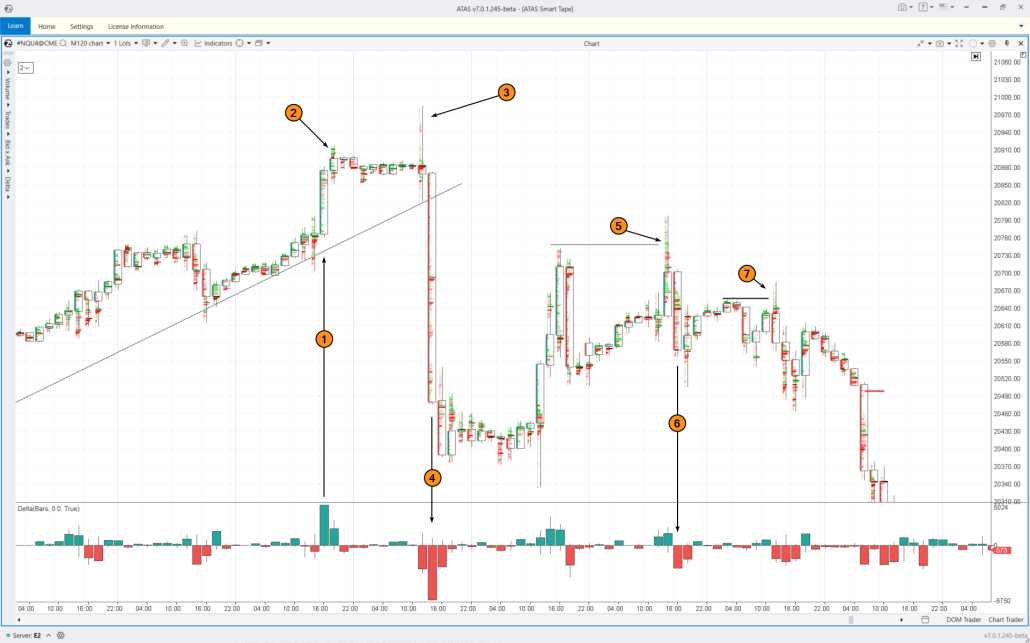
Why Bull Traps Occur. The Psychology Factor
Herd mentality happens when mostly inexperienced traders follow others instead of doing their own analysis. When major peaks are forming (and before prices start to drop), news feeds, social media, and trading forums are often filled with optimistic posts about the asset’s potential for further growth. This boosts the herd mentality, leading more traders to buy without careful analysis. FOMO (Fear of Missing Out) is triggered simply by watching prices rise quickly. Continually higher prices (especially without significant pullbacks) create the illusion of unstoppable growth, making buying seem like the only smart move — and the sooner, the better. Confirmation bias. Traders look for and focus on information that confirms their existing beliefs about the market. In bull traps, this shows up as a selective focus on positive news and data that support the idea of a continuing uptrend. Overconfidence can lead to bull traps when a trader, who has recently had success with several “breakout” trades, takes a large long position, only to face losses as the price turns downward.How to Detect a Bull Trap on a Chart?
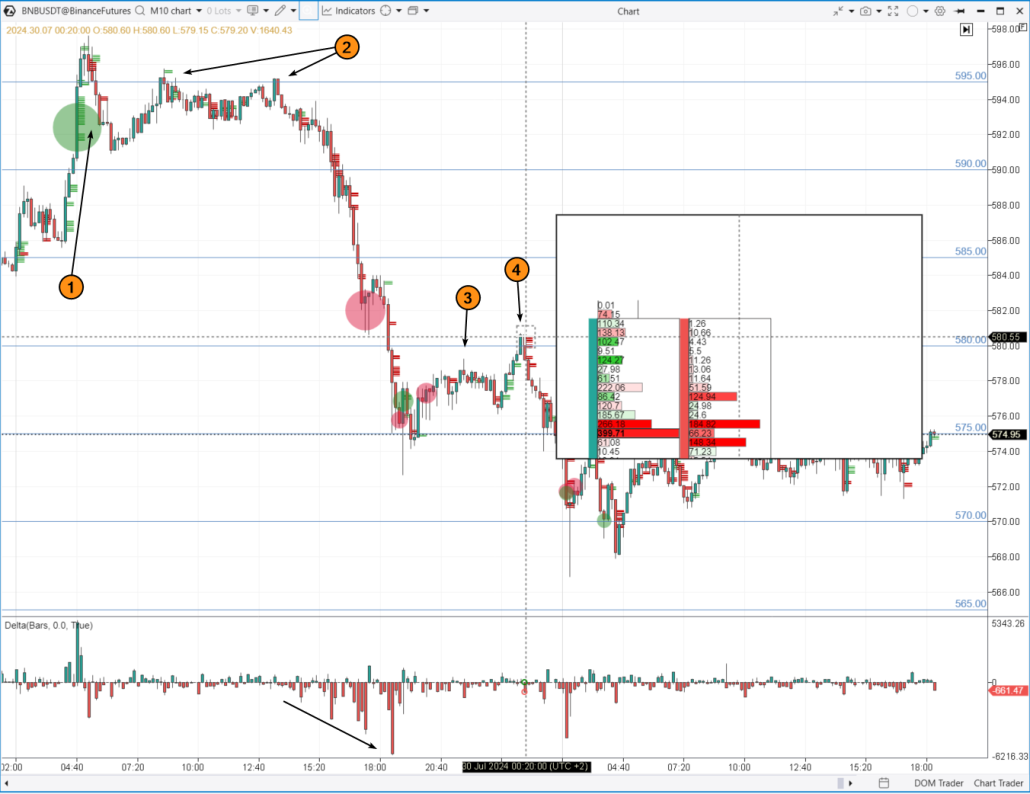
Drawing resistance lines is essential for identifying bull traps. Let’s examine a 15-minute Bitcoin chart from Binance Futures, featuring Delta and the Stacked Imbalance indicator.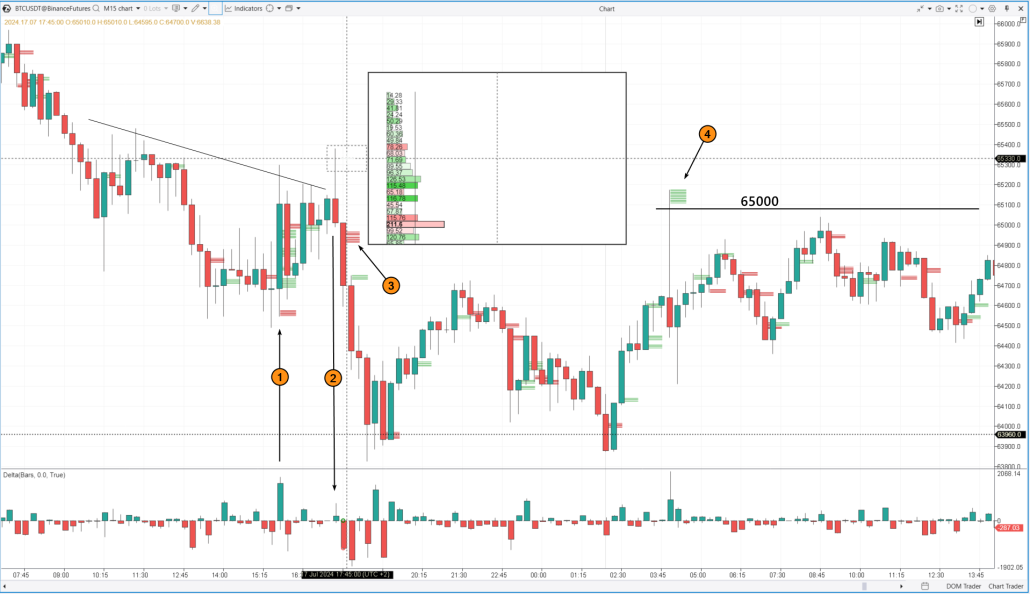
How Does a Bull Trap Occur?
Bull traps are usually caused by the following circumstances and factors: ✓ Technical factors. False breakouts from consolidation zones and buy signals from technical analysis indicators can initially appear as signals to enter a long position at the start of a new uptrend, but they can be misleading. ✓ News and events. Comments from officials or economic data can lead to a temporary price increase, which then turns into a decline as the market processes the information. ✓ Manipulation by major players. Different market participants have varying levels of capital and resources. Professionals often have better access to insider information, analysis, and trading systems. However, they need liquidity to execute large orders. Therefore, large investors or market makers might intentionally create false buy signals to lure smaller traders into the market and then create their own short lines at their expense. Example gold futures market, CME data.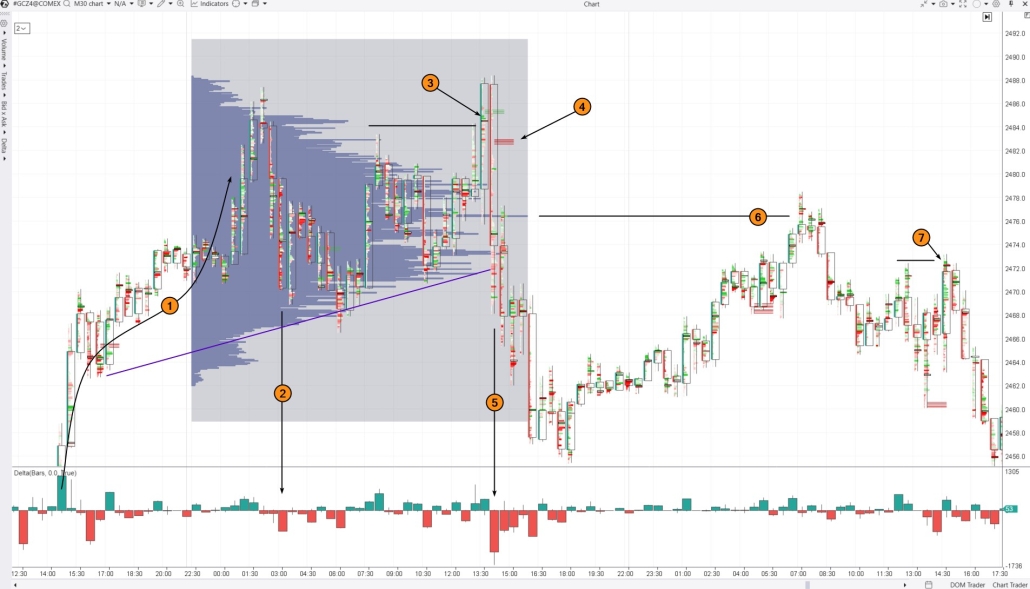
- where can they find more liquidity from buyers to establish a significant short position?
- how can they break through the support level below (shown in purple) at a lower cost?
How to Avoid Getting Caught in a Bull Trap?
Read footprint charts. Analyze how price and order flows affect retail traders, leading them to losses while professionals continue to profit. Monitor the trend. Be cautious about buying during resistance breakouts if the market is in a downtrend. Have strong reasons for buying. Do not enter long positions based on emotions. Use advanced volume indicators. Extremely high buying volume without corresponding price progress often signals a bull trap. Stay informed. Before major news events, the market often becomes volatile due to rumors and announcements, creating conditions for bull traps. Have a backup plan. The only way to completely avoid bull traps is to stop trading. Always have a plan if the price moves against you when you go long.How to Trade a Bull Trap?
The general strategy is as follows:- Draw a resistance line.
- Wait for the price to break above this resistance.
- Confirm that this breakout is actually a bull trap.
- Enter a short position with a stop loss and target.
Example 2. Trading a Bull Trap in an Uptrend
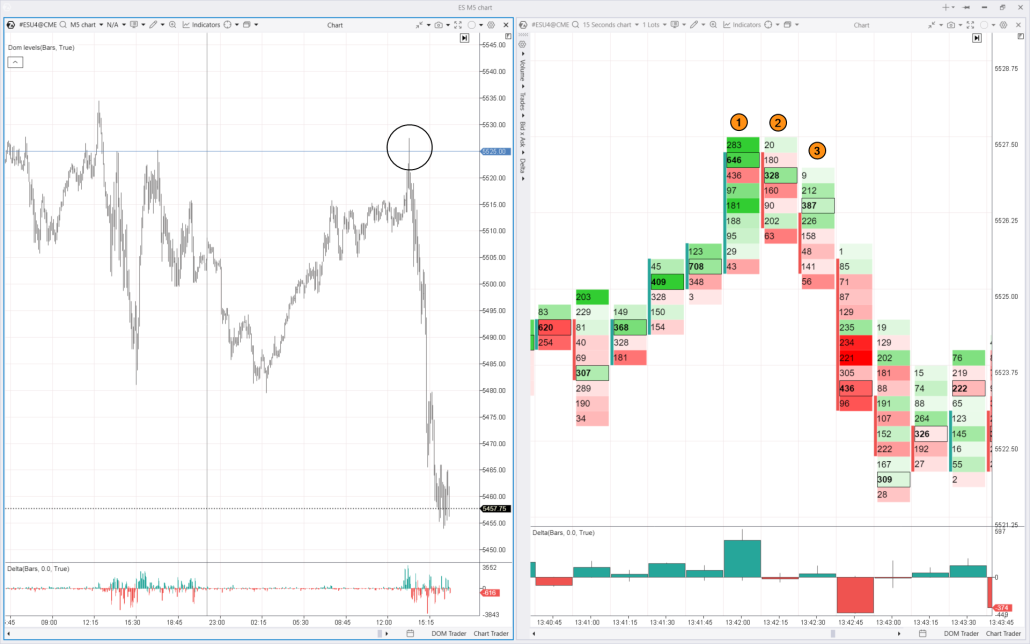
July 16, 2024, the S&P 500 futures market — this was the historical high at the time of writing, following a roughly 19% rise since the beginning of the year.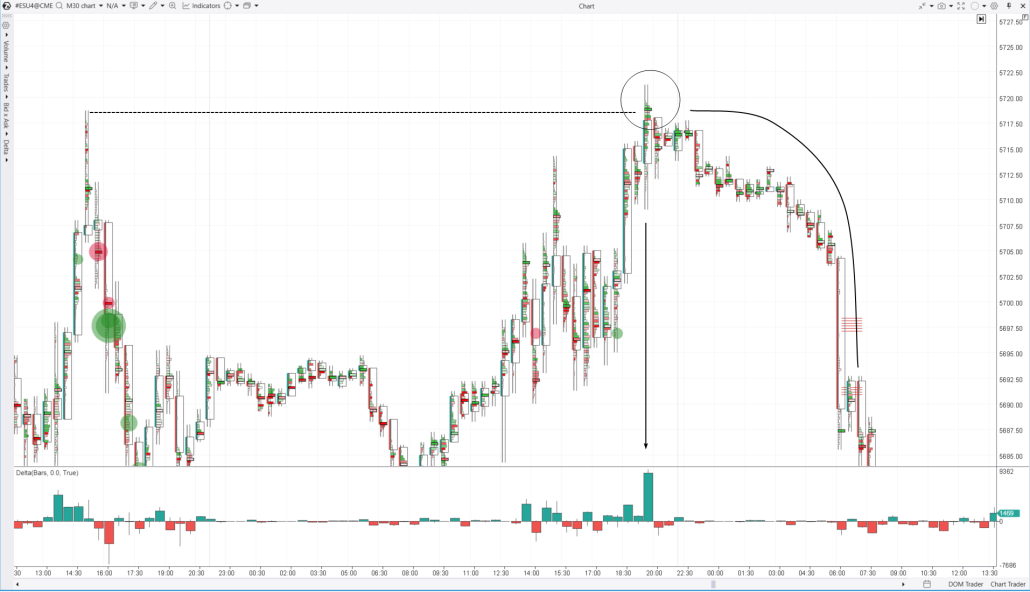
Delta indicates an abnormal spike in buys as the previous peak was broken. The candle closed below the bright green cluster. If this cluster represented genuine buying strength, the price would have risen. Instead, it started a gradual decline that accelerated. Is not that a bull trap?
Pros and Cons of Trading Bull Traps
Pros:
✔ Bull traps can appear in any market and on any timeframe. They can be used for both intraday trading and swing trading. ✔ They offer insight into how the market operates. ✔ This strategy takes into account the motives of major players. ✔ Footprint charts provide clear visual confirmations. ✔ You can enter short positions near market peaks.Cons:
✘ Success is not guaranteed. What appears to be a false breakout could turn into a genuine one if the price resumes its upward trend after a pullback. ✘ Trading bull traps often means going against the trend, going short after a period of price increases. ✘ It requires skill and practice. It takes time and experience to master understanding market behavior and forming hypotheses about levels where bull traps may form.FAQ
What is a bull trap in crypto?
A bull trap in crypto is a situation where an asset’s price temporarily rises above a resistance level, giving the false impression of a new uptrend, only to drop sharply afterward. This often leads to a significant downward trend.What is a bull trap rally?
It is a short-term, rapid increase in an asset’s price that lures emotional traders to open long positions.Why do bull traps happen?
Bull traps happen due to a mix of factors like market manipulation by major players, misleading technical signals, the influence of news or events, and the illusion of a steady price rise.When do bull traps most commonly occur?
They can occur on any instrument and time frame when resistance levels are broken by:- downtrend lines;
- psychological price levels;
- key and intermediate highs.
Which indicator detects bull traps?
There is no specific indicator designed to identify this pattern. The most effective way to spot a bull trap is by closely analyzing the interaction between price and volume during an attempt to break through significant resistance. Footprint charts are particularly useful for this, as they provide detailed insights into buying and selling dynamics.What is the difference between a bull trap and a bear trap?
The difference between a bull trap and a bear trap is that they are mirror opposites. Bear traps occur when support levels are broken.How to Turn Bull Traps into Profitable Opportunities
Trading is about navigating a system where one trader’s gain is another’s loss. In the context of bull traps, this means entering a short position when other traders make the mistake of buying during a resistance breakout. To test your skills in detecting bull traps, use the Market Replay simulator. This ATAS platform feature recreates real-time trading conditions using historical data. Traders can sharpen their skills in a risk-free environment and learn to use footprint charts to improve their effectiveness. To try the simulator, download the ATAS platform for free, install, and launch it, and then: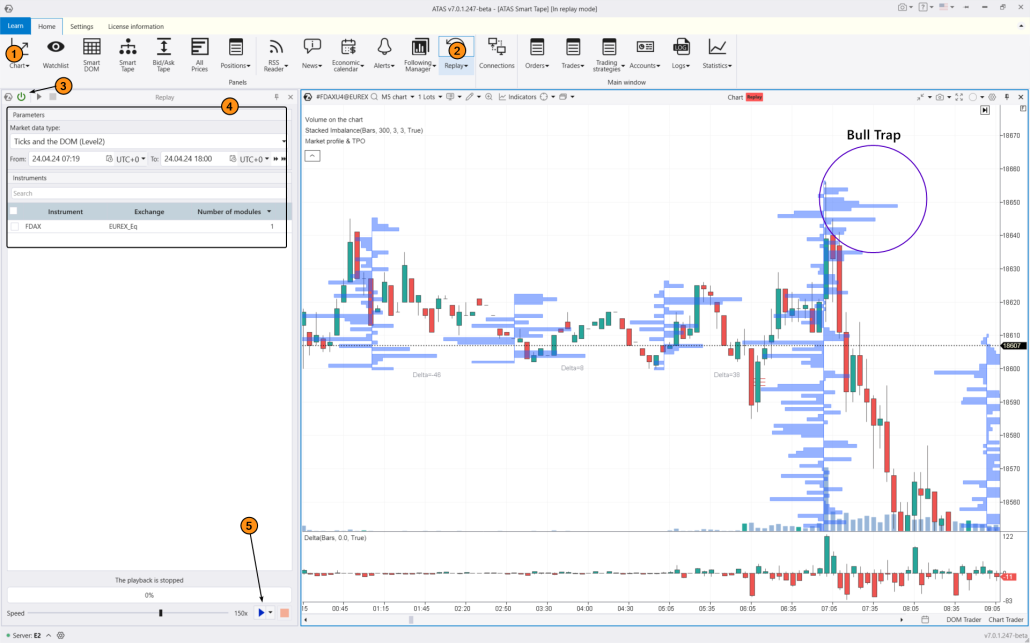
- use Chart Trader and other features to trade on the built-in demo Replay account and then analyze your performance;
- adjust the playback speed, and pause;
- analyze footprint charts;
- use more than 400 indicators;
- use drawing objects, for example, mark support and resistance levels;
- use various chart types (e.g., non-standard Range XV);
- use exit strategies;
- do much more to learn how to profit from situations where others make mistakes.
Conclusions
Bull traps clearly show that the market is designed in a way that makes it difficult for most participants to profit. Just like a machine with over 100% efficiency is impossible, consistent profits for the majority are equally unlikely. These traps happen because many retail traders have similar psychological patterns, and the price moves against them as it is the path of least resistance. Cluster charts and volume analysis indicators such as Delta and profiles enable you to see how buyers often enter positions during false price spikes, only to be caught off guard by sharp declines that follow. Download ATAS. It is free. Once you install the platform, you will automatically get the free START plan, which includes cryptocurrency trading and basic features. You can use this plan for as long as you like before deciding to upgrade to a more advanced plan for additional ATAS tools. You can also activate the Free Trial at any time, giving you 14 days of full access to all the platform’s features. This trial allows you to explore the benefits of higher-tier plans and make a well-informed decision about purchasing. Do not miss the next article on our blog. Subscribe to our YouTube channel, follow us on Facebook, Instagram, Telegram or X, where we publish the latest ATAS news. Share life hacks and seek advice from other traders in the Telegram group @ATAS_Discussions.Information in this article cannot be perceived as a call for investing or buying/selling of any asset on the exchange. All situations, discussed in the article, are provided with the purpose of getting acquainted with the functionality and advantages of the ATAS platform.


