The Bullish Pennant is a chart pattern in technical analysis that traders use to enter a position in the direction of an emerging trend.
Below, you will find useful tips for trading this popular pattern. We will explore in detail how to use professional indicators for volume analysis to improve the accuracy and effectiveness of trading with bull pennants.
What is a Bullish Pennant?
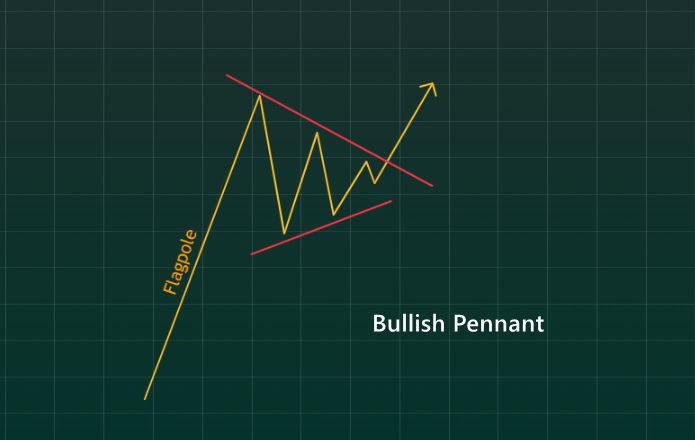
The bullish pennant is a continuation pattern in an uptrend. It forms after a period of price growth, when bullish momentum temporarily slows down. Traders expect the pattern to lead to the resumption of the rally with a new impulse.
Characteristics and Components
The components of the bullish pennant pattern include:
- A pronounced uptrend, known as the flagpole.
- A consolidation period, during which price fluctuations slow down, forming a narrowing triangle between support (S) and resistance (R) lines.
- A resumption of the uptrend after breaking through resistance.
The bullish pennant pattern (if we don’t focus too strictly on its exact shape) is quite commonly found on the charts of stocks, futures, and cryptocurrencies.
Understanding the Pattern: How Does the Bullish Pennant Work?
The bullish pennant is not a candlestick pattern. Analysts do not focus on the OHLC (Open, High, Low, Close) values of specific candles, but instead pay attention to the shape formed by the collective candles.
- The flagpole should be as steep as possible. A nearly vertical price increase (for example, after a news release) signals the start of an impulse.
- The narrowing triangle should be tight. This means the distance between the boundaries of resistance (R) and support (S) should be minimal, making the pennant more distinct.
Example of a Bullish Pennant on a Chart
The chart of the DAX stock index futures below demonstrates an example of a bullish pennant:
- A-B: A period of sharp price growth, identified as the flagpole.
- R-S: Two converging lines that form a pennant with the flagpole, visually resembling the shape of a pennant.
- C: The breakout level, used by traders as a signal for continuing the uptrend.
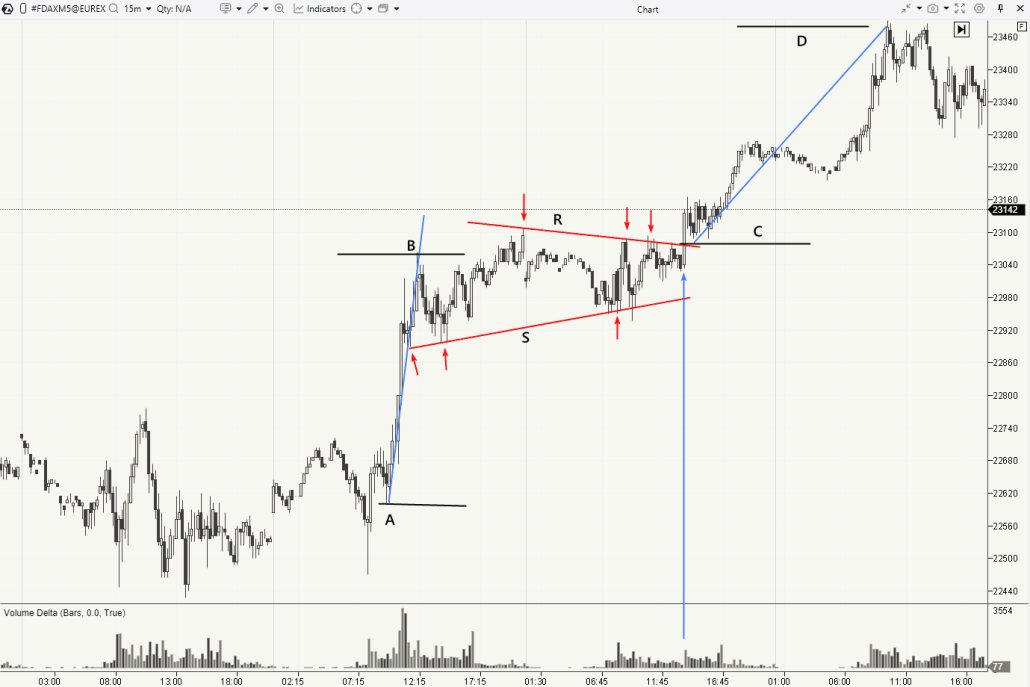
Notice the arrow pointing to a volume spike — this is a sign of a genuine bullish breakout.
According to classic technical analysis, you should measure the distance from A to B and project it upward from the breakout level. This will help you find level D, which will serve as the target for the price movement after the breakout of the bullish pennant.
Psychology Behind the Pattern
Understanding the psychological factors behind the formation of the bullish pennant will help you trade the pattern with more confidence and accurately interpret the data provided by volume analysis indicators. In any case, patterns reflect fluctuations in market sentiment and the shift of initiative between bulls and bears.
✔ Buyer Sentiment: After a price increase, buyers may be reluctant to pay higher prices for an asset that was previously available at a significantly lower price. Additionally, there is a temptation to lock in profits from a long position if it was opened earlier.
✔ Seller Sentiment: After a price increase, a sufficient number of market participants are willing to take risks — either trading against the trend in anticipation of a pullback from overbought conditions or trying to catch a trend reversal.
As these sentiments dominate the market, the bullish pennant forms on the chart.
How to Trade the Bullish Pennant
Traders generally use the bullish pennant to enter a position, anticipating the end of the consolidation period (between the support and resistance lines) and the continuation of the uptrend. Volume analysis during the breakout can provide valuable confirmation signals for the authenticity of the breakout.
Learning to Trade Breakouts
Let’s take a closer look at each theoretical aspect of trading the bullish pennant pattern, then move on to practical examples on real charts.
How to Find the Entry Point?
Since determining the resistance line is often subjective and uncertain due to “noise” in price fluctuations, traders must make different decisions when entering a long position during a bullish pennant breakout. These include:
- Setting a Buy Stop just above the resistance line (R).
- Setting a Buy Stop just above the last high that forms part of the resistance line.
- Entering manually when the “signal” candle closes above the resistance line (R).
- Waiting for a retest of the breakout level.
Each of these methods has its own advantages and disadvantages, which will become more apparent when further analyzing bullish pennant patterns.
Where to Place the Stop-Loss?
Technical analysts most often use the following approaches:
- Set the stop-loss below the support line (S).
- Set the stop-loss below the intermediate low before the breakout of resistance. This is often the minimum level in the “trading range” before the breakout, and can be more visible on smaller timeframes.
Both approaches are suitable, as shown on the chart with the bullish pennant above.
Where to Set the Take-Profit?
As mentioned earlier, traders measure the length of the flagpole and project it upward from the breakout level. The idea is that the new bullish impulse (or multiple impulses) will be at least as large as the one that created the flagpole. Alternatively, as discussed in the article on ATAS protective strategies, traders may set a trailing stop, allowing the market to close the position on its own.
Regardless, it’s important to evaluate the risks and their alignment with the expected reward. If the breakout turns out to be false, the loss should not be catastrophic.
Bullish Pennant on the Gold Price Chart
The screenshot below shows (on the left — the hourly context, and on the right — the breakout details on the 15-minute chart) fluctuations in the price of gold during spring 2025, when financial market participants faced uncertainty due to Trump tariffs on international trade. The tariffs were sometimes imposed, sometimes delayed, with exceptions made, then increased, and other countries responded with countermeasures. This raised concerns about a possible recession in the U.S. and other countries, and also increased gold’s appeal as a safe-haven asset.
The arrow (1) shows the surge in gold prices triggered by these news events. From a technical analysis standpoint, this rise can be classified as the flagpole of the bullish pennant pattern, after which price fluctuations slowed between the narrowing support and resistance lines (the boundaries of the pennant).
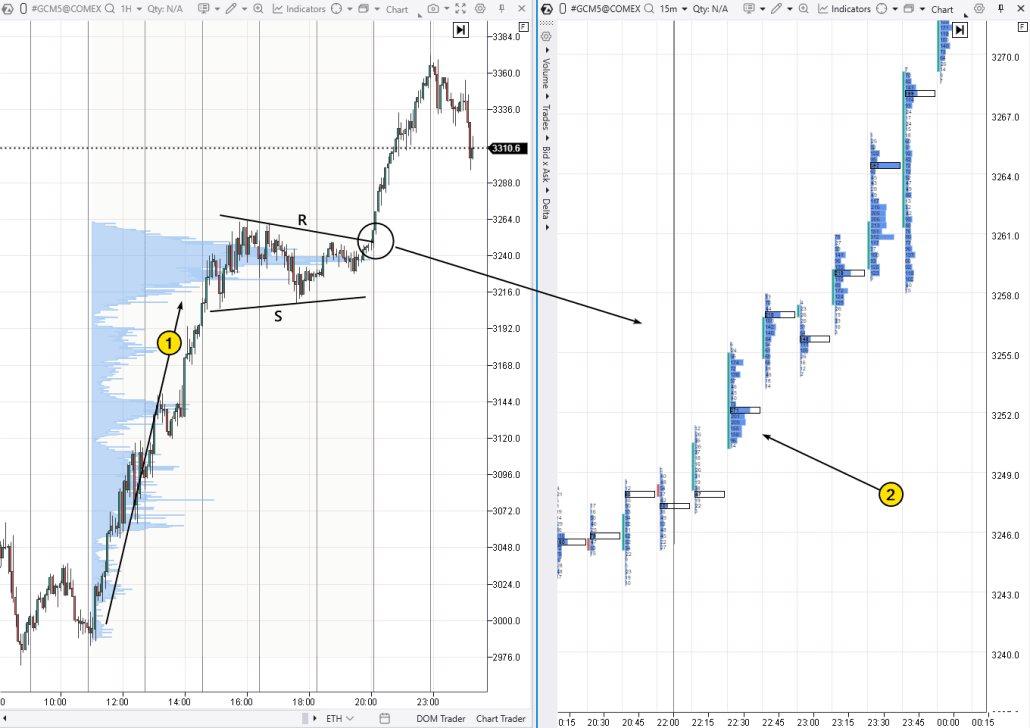
The footprint chart on the right allows for a detailed examination of the breakout of resistance. The number (2) marks the cluster of trades reflecting the bulls’ efforts to break through resistance (R). The flow of market buys absorbed the sell orders in the order book, which allowed the price to break through to historical highs.
However, it’s important to note that the target of the bullish pennant pattern (at least on the first attempt) was not reached, as a bearish impulse began to form on the right edge of the chart. This also highlights how useful the Market Profile and TPO indicator can be for analyzing the situation.
How Can Market Profile Help in Analyzing and Trading the Bullish Pennant?
Market Profile can be useful in various ways, such as:
✔ The bulge on the profile helps confirm the formation of the pennant.
✔ Breakouts from the VAL and VAH levels can serve as triggers for entering a position.
✔ The POC (Point of Control) of the pennant is used as a stop-loss level.
✔ Analyzing the profile on a lower timeframe helps confirm the authenticity of the breakout and reduce risks, providing a more accurate entry point.
More on the Indicator:
Bullish Pennant on the NQ Futures Footprint
The chart below shows two examples of the bullish pennant pattern from the Nasdaq 100 futures market. These patterns formed within the day, confirming the applicability of the pattern for detection on shorter timeframes.
Example 1. The first bullish pennant formed when the price broke through local resistance (shown as a dashed line) and surged upward (2). However, it fluctuated between the R1 and S1 lines for some time. After the breakout of resistance level R1 in the first bullish pennant, target calculations (starting from point 1) suggested a level near 19650 points. However, the price did not reach that level in practice.
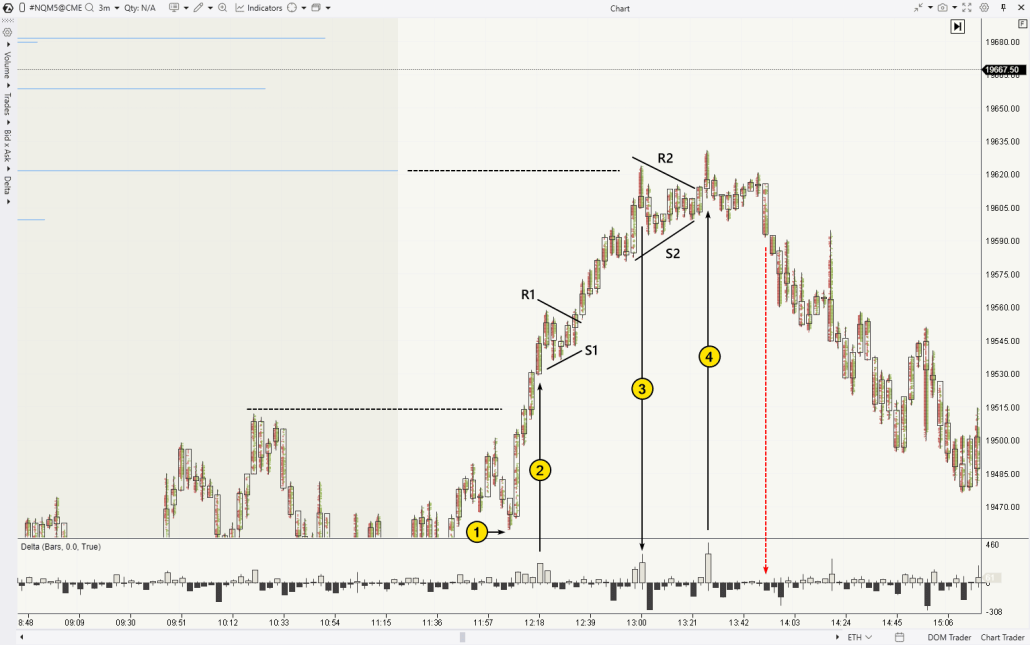
Example 2. Price fluctuations between R2 and S2 give a reason to consider the second bullish pennant, although the flagpole is less distinct here (and the pennant is not tightly compressed). Furthermore, this pattern gave a false signal, as the bullish breakout (4) turned out to be false, and the price reversed downward.
However, the value of this example lies in the observations related to the analysis of price interaction and volume indicators:
✔ The price reversed downward from resistance (the upper dashed line), which was formed by the volume level from the previous day.
✔ Delta shows how sharply (3) the delta readings changed: from extremely positive delta (buying climax) to extremely negative on the next candle.
✔ The red arrow indicates that there was a minimal amount of market selling, but it was highly effective, pushing the price down (the candle closed at the lows, and the bearish momentum continued further).
- How to Read the Delta Indicator
- How to Read the Cumulative Delta Indicator
- On Support and Resistance Levels Using Horizontal Volumes
Failed Pennant
The chart of Bitcoin’s price (from Binance Futures data) provides an example of a bullish pennant. It formed between the R and S lines after the price sharply surged, creating a flagpole from A to B.
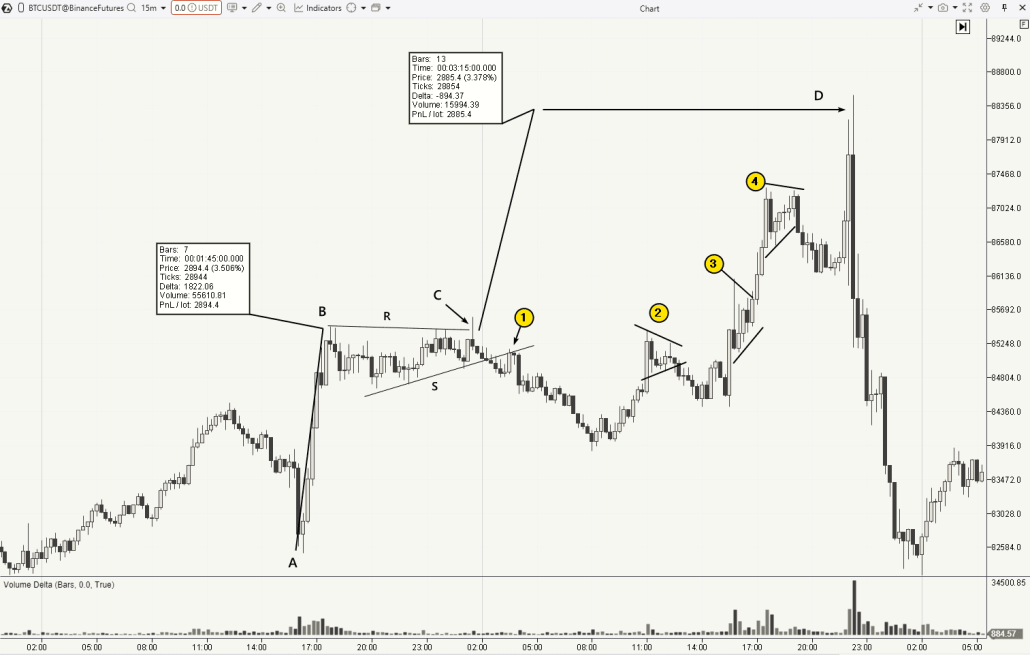
In theory, the trader should have observed the bullish breakout of the resistance line (R) at point C, expecting the continuation of the upward trend with a target level at D. Although history shows that the price eventually reached this level (and it clearly acted as resistance), here’s what happened:
- The breakout at point C turned out to be false.
- After that, the price broke through and tested (1) the support level (S).
- On the way to the top, near level D, the price formed narrowing shapes (2, 3, and 4) that resembled the bullish pennant pattern.
Now, let’s look at how the price formed the breakouts of this pattern using the footprint chart.
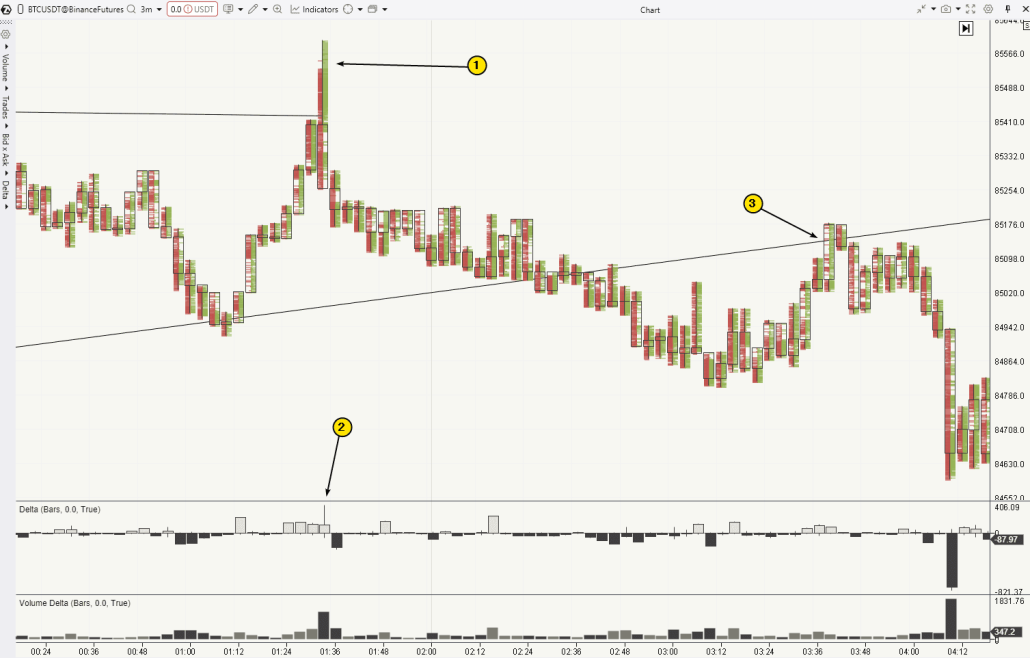
The number (1) marks the false breakout of resistance. Interestingly, according to the clusters, there was a surge in market buys, but the price closed near the lows. The upper tail on the delta (2) suggests that after the market buy surge, sellers sharply intensified their activity. If we analyze the price action and delta using the “effort-result” principle, it becomes clear that buyers demonstrated extreme inefficiency. On the other hand, sellers acted effectively — they continued to pressure the price, eventually leading to a breakout of the lower boundary of the bullish pennant.
The number (3) shows the test of the breakout of the lower boundary of the bullish pennant. Again, we see the inefficiency of the buyers: there are many green clusters, but the price does not rise on the next candle and then drops below the levels where these green clusters formed. This resembles a bull trap in trading.
Overall, the closer we get to the conclusion of the bullish pennant pattern review, the more evidence we have that footprint charts and skills in reading volume indicators can significantly improve the effectiveness of trading graphic patterns.
Comparison of Bullish Pennant with Other Chart Patterns
To confidently navigate through the numerous chart patterns in technical analysis, take a look at our trader’s cheat sheet: Checklists for Trading Patterns.
Bullish Pennant vs. Bullish Flag
Both patterns are similar in that they are continuation patterns for an uptrend after a consolidation period. Another common characteristic is the method for calculating the target (measuring the height of the flagpole and projecting it from the breakout level of resistance).
However, the bullish pennant and bullish flag differ in the shape of consolidation, which is reflected in the name of each pattern. In a bullish pennant, the consolidation forms a narrowing triangle, while in a bullish flag, the price fluctuates between parallel support and resistance lines.
Bullish Pennant vs. Bearish Pennant
These patterns are opposite to each other. A bearish pennant forms in a downtrend and signals its possible continuation. All the rules that apply to the bullish pennant also apply to the bearish pennant, but with a “mirror image.”
How Does the Pennant Pattern Differ from the Wedge Pattern?
All patterns are based on narrowing lines, with price consolidating between them after a sharp impulse. The main difference is that in the bullish and bearish pennants, the lines R and S converge evenly, meaning the central axis of the triangle is horizontal. In contrast, in wedges, the lines are tilted: in an ascending wedge, they tilt upward, while in a descending wedge, they tilt downward.
✔ Ascending Wedge: This pattern occurs when the price narrows between two slanted lines going upward. It often signals a possible reversal downward, especially in the context of an uptrend.
✔ Descending Wedge: This pattern occurs when the lines converge downward. It can signal a probable reversal upward, especially in the context of a downtrend.
FAQ
Can Pennants Be Both Reversal and Continuation Patterns?
By definition, reversal and continuation patterns are two opposite concepts. Therefore, they cannot be the same pattern simultaneously. However, there are situations where a continuation pattern fails, and it could be interpreted as a reversal pattern.
What is the Success Rate of a Bullish Pennant?
This is an important question, and the answer can be found in various studies. One such study is the success probability statistics for trading with the bullish pennant pattern, compiled by the renowned analyst Thomas Bulkowski. According to his research, the probability of success with an upward breakout is around 54%, and 35% of trades reach the target price level.
When is the Best Time to Use a Bullish Pennant in Trading?
The bullish pennant is especially effective in a strong uptrend, when the price goes through a consolidation phase after rising. It is recommended to use it on smaller timeframes for short-term trades, where the breakout is more evident.
How to Avoid False Signals When Trading with the Bullish Pennant Pattern?
To reduce the risk of false signals, it is important to use additional indicators, such as volume analysis or oscillators. Also, be attentive to the market context and avoid trading the pattern during periods of high market uncertainty.
You can check if you can consistently profit from trading bullish pennants by using the ATAS Market Replay trading simulator.
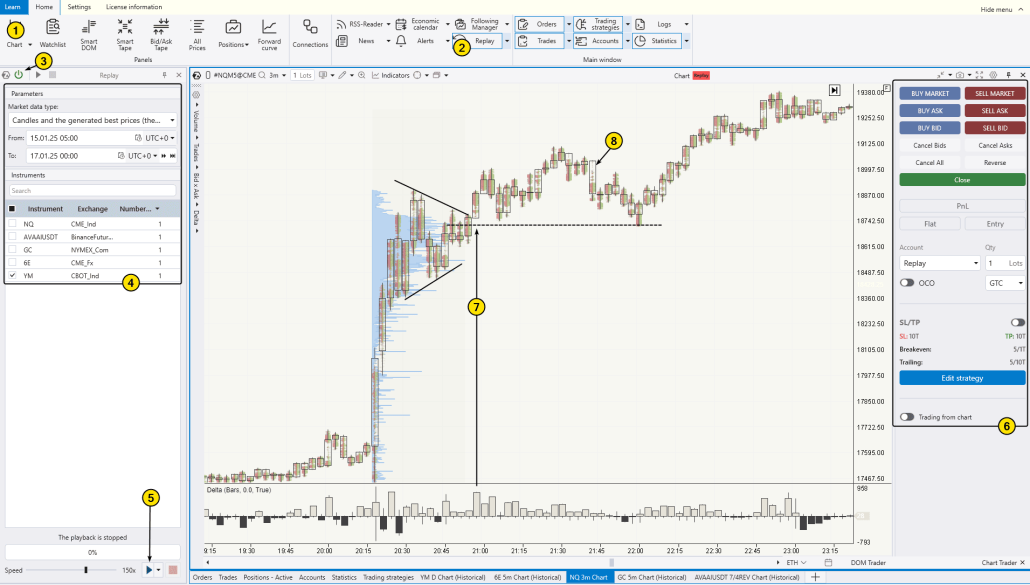
The attached chart (this is the NQ futures) shows how, after a news impulse during the U.S. trading session, a pennant formed, and then the price broke through (7) its upper boundary. However, the impulse did not continue strongly because the trading session was ending (and the initial reaction likely accounted for the news impact). Notice the absence of trading activity “inside” the descending candle (8) — this is a bearish sign. After that, the price tested the high-volume level of the pattern — and it acted as support.
Conclusions
The bullish pennant frequently appears on various types of charts and is usually interpreted as a pause (a breather) before the continuation of an uptrend. However, there is no guarantee that this will actually happen.
Advantages of the Pattern:
✔ It appears frequently across different markets.
✔ It aligns with market logic, which suggests that markets alternate between trending and consolidating phases.
✔ A compact pennant and long flagpole provide an attractive risk-to-reward ratio.
Limitations and Disadvantages of the Bullish Pennant:
✘ Market Risk: The breakout of resistance can turn into a bull trap.
✘ Trading based on chart patterns is subjective and involves vague rules for determining entry signals, stop levels, and take-profit levels.
✘ When trading bullish pennants, it is important to consider the broader market context and use additional indicators, which can be challenging — especially for novice traders.
Collecting data on the effectiveness of trading the bullish pennant can be a difficult task due to its subjectivity and uncertainty. However, with the tools provided by the ATAS platform, you can significantly increase your trading confidence. Use volume analytics and the replay simulator to not only improve your skills but also start trading with consistent profits.
Do not miss the next article on our blog. Subscribe to our YouTube channel, follow us on Facebook, Instagram, Telegram or X, where we publish the latest ATAS news. Share life hacks and seek advice from other traders in the Telegram group @ATAS_Discussions or on Discord.
Information in this article cannot be perceived as a call for investing or buying/selling of any asset on the exchange. All situations, discussed in the article, are provided with the purpose of getting acquainted with the functionality and advantages of the ATAS platform.