Consolidation trading definition is when the price gets stuck in a range without a clear trend. This state is often called “sideways movement,” “flat,” range, or “choppy”—these aren’t exact synonyms, but they’re close in meaning.
During consolidation, market participants redistribute volume. On regular candles, it often looks like “noise,” making it easy to confuse with a pause before continuation—or mistake it for a reversal.
What Is Trading Consolidation
Trading consolidation is a market phase in which price stops trending and moves within a relatively narrow range. It usually reflects a temporary balance between buyers and sellers before the next directional move begins.
Trend = imbalance
Price shifts intensely in one direction
because supply/demand are
clearly unequal
VS
Consolidation = balance
Price “hangs” in a range because the
market temporarily reaches
equilibrium
The market is “gathering energy” for its next move. Price swings narrow as participants agree on a fair price range for the moment.
For example, if oil futures consolidate around $60, buyers and sellers — both large and small — are actively trading within that range and have reached a temporary agreement that this price is fair. This lasts until a new catalyst appears: news, volume shifts, changing sentiment, etc.
Start now!
Try ATAS free with no time limit
Consolidation Example
E-mini S&P 500 (ES) futures chart:
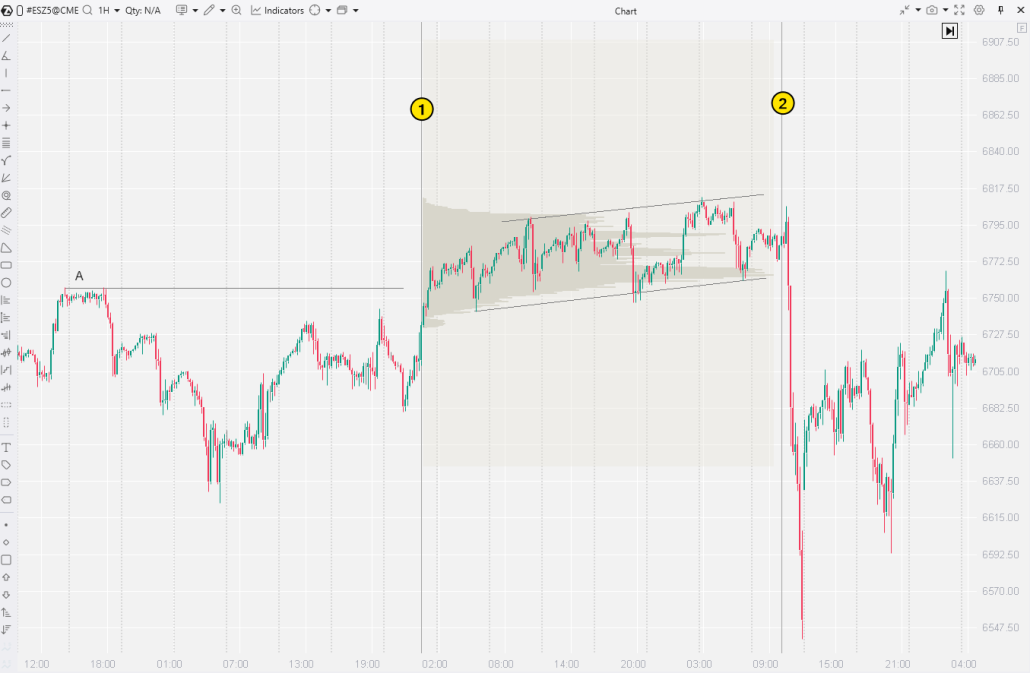
After reaching the previous peak A, growth slowed, and the price entered balance mode. Two clear signs appear on the chart:
- You can draw a local ascending channel using the extremes (conditional support and resistance levels).
- Price entered a sideways range: between lines 1 and 2, consolidation forms — a temporary “fair” price zone.
Important: bullish factors remained in play, but traders weren’t ready to buy near the historical peak, as if sensing external factors that would push the price down.
💡 Near significant levels, markets often shift from impulse to balance—directional movement loses momentum. What happens next depends on where volume accumulates and whether a new imbalance emerges.
To assess balance and imbalance within the range, add the Market Profile & TPO indicator to your chart. Where price spent more time, and the most volume traded, the profile bulges — this is the consolidation zone.
Its center — Point of Control, or POC — is that “fair price” where the market found agreement.
Other indicators for identifying consolidation:
1. Bollinger Bands: During consolidation, the bands narrow.
2. ADX (Average Directional Index): The value drops below 25 (or 20), showing no clear trend.
Consolidation Risks
Important! Consolidation lasts longer than trending movement. That is, markets remain in a state of balance more often than in a state of sustained impulse.
This is an unfavorable time for many traders:
- Price fluctuations appear chaotic and turbulent, making them difficult to analyze.
- Price often returns to the middle of the range — false breakouts and sharp reversals occur more frequently.
- Stop-loss levels trigger more often because the price keeps fluctuating.
- Profit potential within the range is small.
Another risk is psychological: when there’s no clear direction on the chart for a long time, there’s a desire to “do something” instead of calmly waiting for a clearer structure.
Sometimes consolidations look so neat that you want to perceive them as a ready-made pattern. In practice, this is more of a perception trap: while the market is in balance, it constantly tests the range boundaries — and that’s exactly why it’s important to rely on volume and structure, not just on shape.
And yes, the market doesn’t do without consolidations: this is a natural redistribution phase that often precedes the next imbalance — the question is just how to recognize it in time.
Trading Consolidation Patterns
Rectangle (Range / Box)
A classic consolidation trade pattern: price moves between clear horizontal support and resistance levels.
Example. BNBUSDT futures chart with a simple vertical volume indicator.
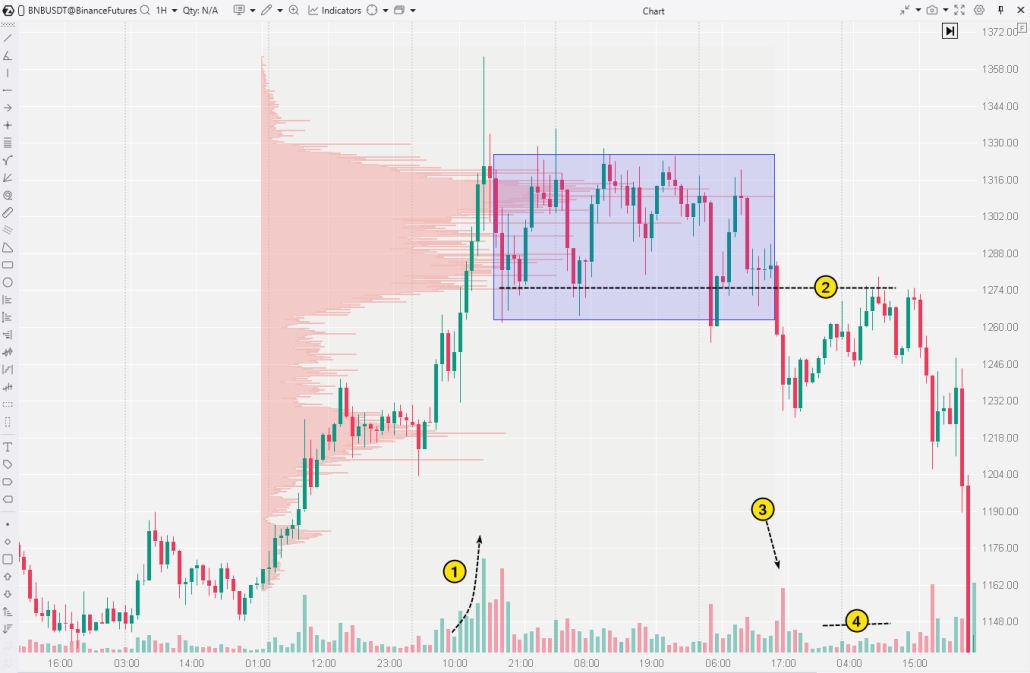
Additional volume analysis reveals this is not just consolidation, but a Wyckoff distribution phase:
- Accelerating growth toward the psychological level of 1300 was accompanied by climactic volumes.
- Price entered a range with support at the level marked by the dashed line.
- Sellers attempted to push through support.
- Price returned to test the former support level on low volumes — a possible sign of weakening demand.
Market Profile & TPO shows that after the sharp rise, activity remained high, but price couldn’t hold at new highs. This often happens when “smart money” sells contracts to retail buyers attracted by positive news and “to the moon” price dynamics.
💡 More about Rectangle Pattern
Triangle
Price moves between two converging lines—forming a triangle with a sharp point directed to the right. Depending on the slope of the boundaries, triangles can be symmetrical, ascending, or descending.
Example. Gold futures, with the Delta indicator for additional context.
The example shows the famous October reversal in the gold market. After price formed a double top at historical highs around the $4380 level, volume declined (1) on the second peak — suggesting a shortage of traders willing to buy at such high prices. This became a harbinger of the subsequent bearish dynamics.
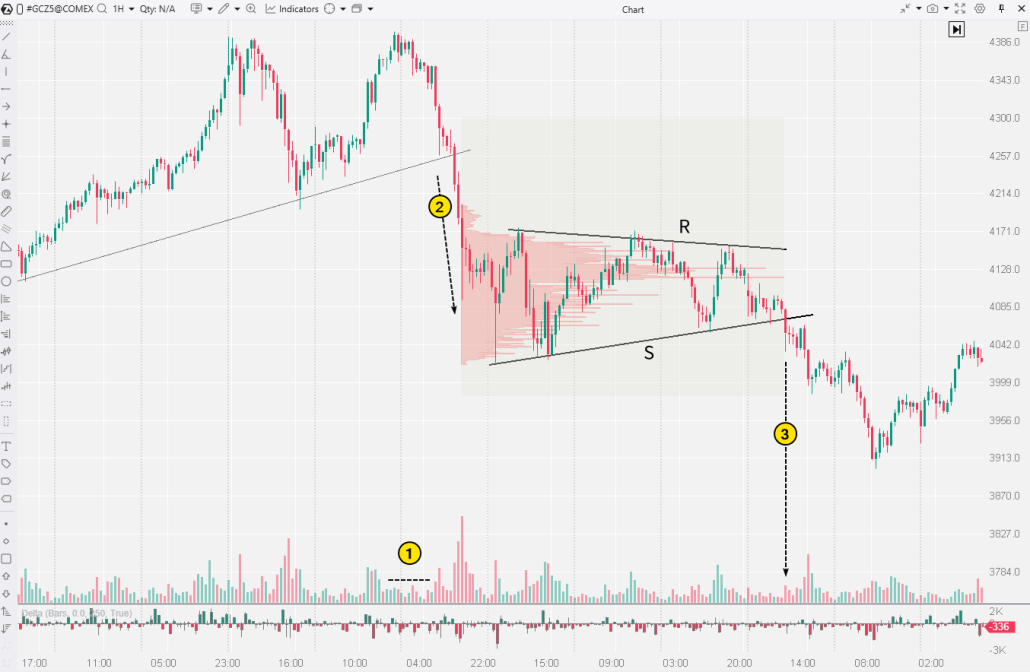
Price initially broke the ascending trendline around $4257, then the decline accelerated on rising volume (2).
The sharp movement, noticeably changed market behavior: directional pressure weakened, and participants began acting more cautiously — this often leads to reassessment and reduced impulse effectiveness.
These fluctuations after the volatility spike led to consolidation formation—taking the shape of a narrowing triangle between resistance R and support S. The pattern was broken on the sellers’ effort (3), confirming the downward balance shift.
Flags and Pennants
Consolidations within a strong trend typically indicate its continuation.
💡 More about flags and pennants:
✓ Top 7 Chart Patterns
✓ Cheat Sheet for Patterns
✓ Bearish Pennant
✓ Bullish Pennant
Consolidation Analysis Strategies
Traders typically consider two basic scenarios:
Reversal — indicating the consolidation continues
Breakout — signaling the consolidation has ended and a trend is beginning
Strategy 1: Range Movement Analysis (Range Scenario)
🎯 Essence: Focus on price reactions at the lower boundary (support) and upper boundary (resistance).
💡 Context: If consolidation formed after a rise, check whether the bullish context persists (and vice versa after a decline). However, the deciding factor is the actual price and volume reaction at the range boundaries—not assumptions.
Example. Apple (AAPL) stock chart, 10-minute footprint
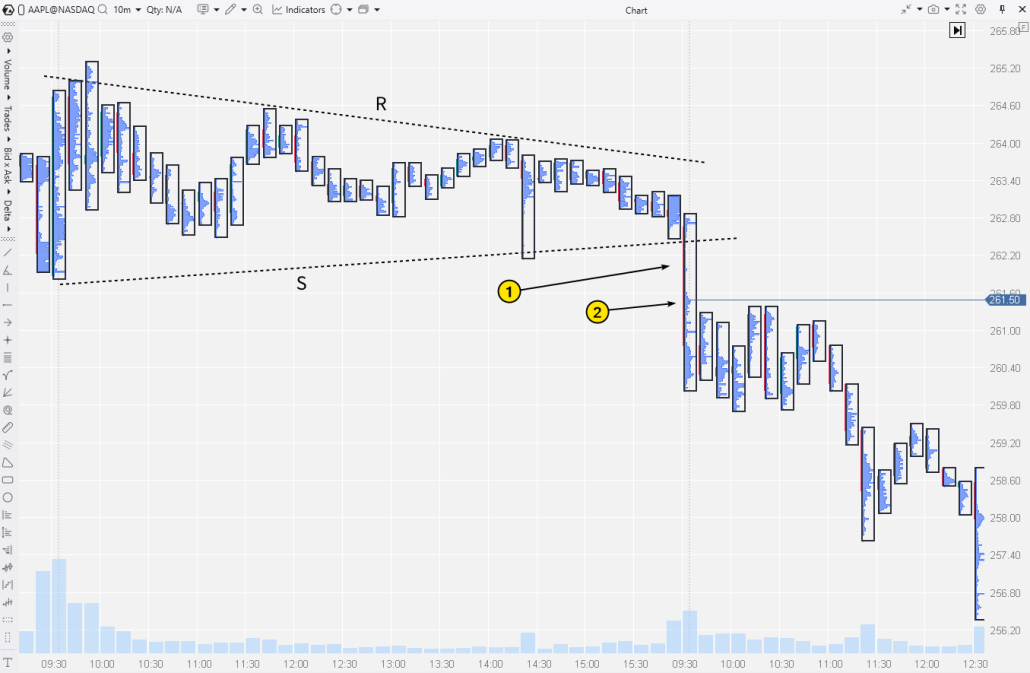
The left side of the chart shows balanced movement forming an R–S triangle.
At the next day’s opening, the movement changed:
- At the session’s start, the price declined with virtually no counteractivity, as shown by the thin profile (1).
- Buyers appeared around the $261.50 level. First consolidations after imbalances often become important levels.
In this example, the $261.50 level acted as resistance and became the upper boundary of the consolidation that formed in the first hour after the opening decline.
How to use this in analysis:
- If you’re interested in a short position, treat the $261.50 area as the key upper range boundary. Watch the price reaction, expecting a reversal down into the consolidation area.
- Assess whether to take profit near the lower consolidation boundary, based on the downtrend’s continuation.
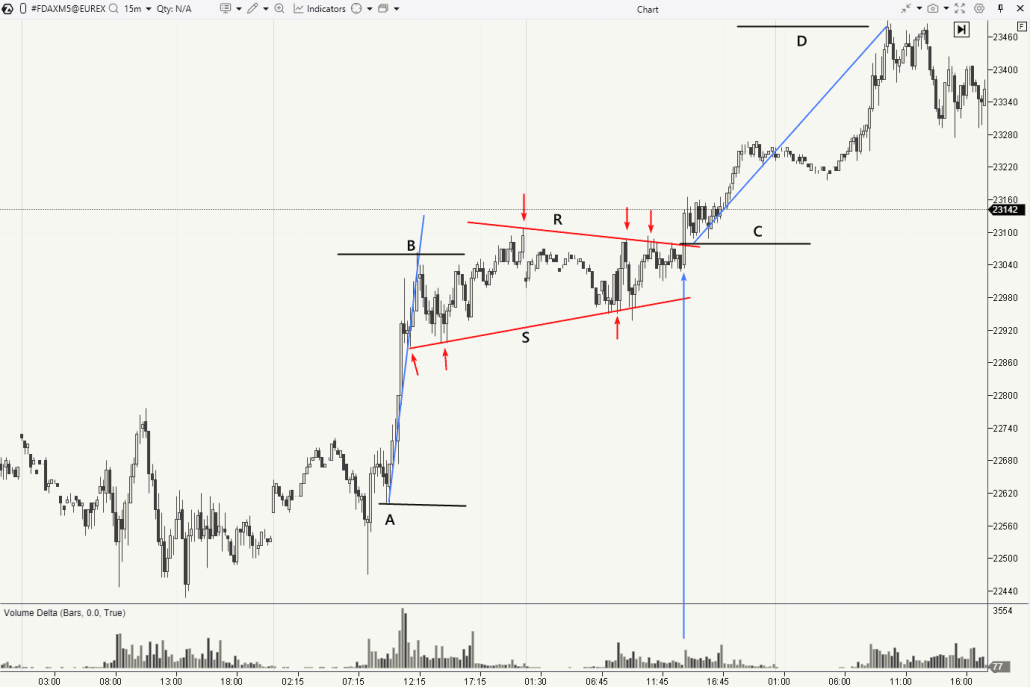
Strategy 2: Breakout Analysis (Consolidation Breakout)
Essence: Wait for the price to exit the range by breaking support or resistance. Then enter the breakout direction.
Example. The hourly euro futures chart shows a bearish reversal characterized by a candle with very high volume and a long upper shadow — signs of the Upthrust pattern. The subsequent decline to 1.1790 confirmed the reversal. At the same time, density formed on the decline profile between levels (2) and (3).
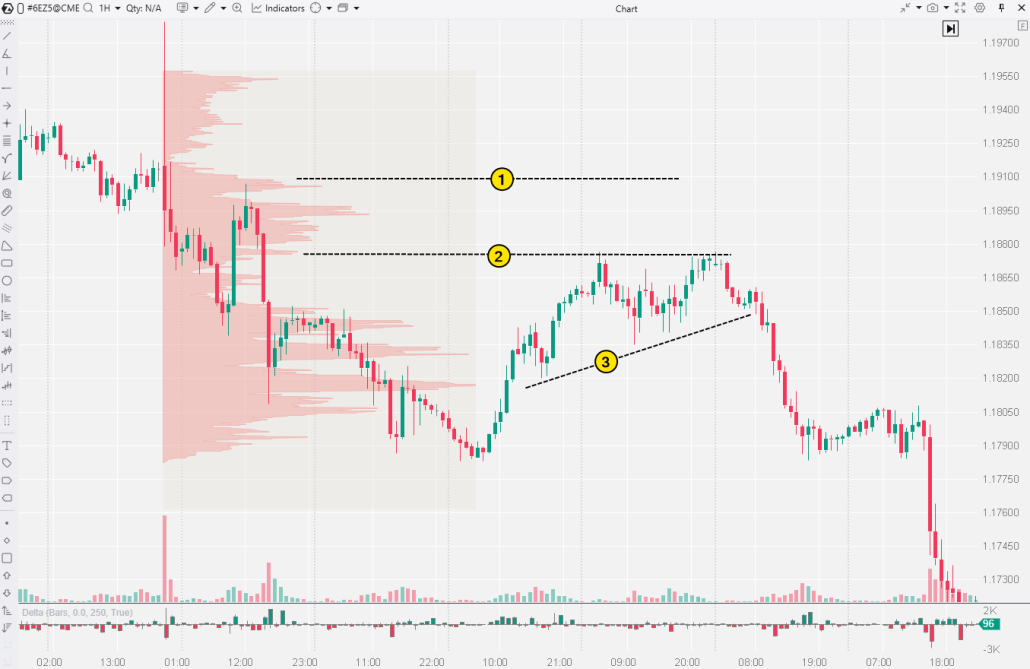
After recovering from 1.1790, a consolidation pattern formed between:
- the lower boundary of density (2), reinforced by the nearby 50% Fibonacci retracement level;
- the local trend line (3).
Since price entered the consolidation from above after a powerful upthrust, a bearish breakout was expected. Here’s what the breakout looked like on the lower timeframe cluster chart.
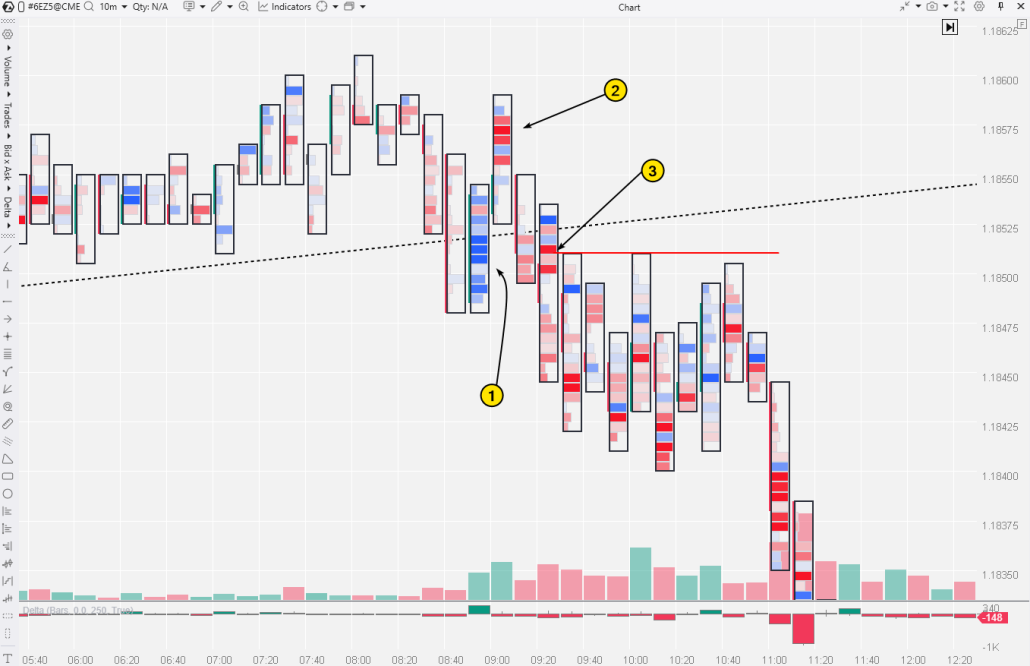
At the European session opening, we see that:
- buyers tried to prevent the decline (1);
- bears became active—shown by the red sell clusters (2 and 3), which broke through the lower consolidation boundary.
The bright red cluster (3) later acted as resistance. Thus, cluster chart analysis confirms the breakout’s authenticity.
You don’t just believe in the breakout — you see aggressive selling (red clusters) pushing price down. This is an analysis based on facts, not guesswork.
Pros and Cons of Working with Consolidations
Advantages
- Clear strategy framework: Consolidation defines specific parameters for analysis—breakout versus reversal.
- Time to analyze: Unlike a rapidly changing trend, consolidation lets you calmly assess the market, build a profile, and analyze delta or other indicators to prepare your action plan.
Disadvantages
- Unclear boundaries: Support and resistance don’t work with tick-level precision. Subjective interpretation complicates building consolidation zones.
- False breakouts (fakeouts): The main risk for breakout traders—price breaks through the level, “collects” stops, and immediately reverses back into the range.
- Psychological pressure: Boredom during a lull provokes impulsive trades, while false breakouts create the feeling that the market is deliberately “hunting” for your stops.
FAQ
What is consolidation in trading?
Consolidation is a temporary market state where trading occurs within a sideways range. There may be a slight tilt, but no clear trend. It signals a balance between buyers and sellers.
What’s the difference between a flat and a consolidation?
Flat and consolidation meaning in trading are similar. If there is a difference, it’s this:
Consolidation—a pause in an active trend when the price temporarily narrows its range of movement after an impulse.
Flat—a prolonged period when the market has no clear direction. Price can drift aimlessly for weeks. A flat doesn’t always end with an impulse.
📖 More about flat
How to determine the direction of a consolidation breakout?
With certainty—you can’t. The breakout direction cannot be predicted with 100% certainty. However, cluster chart analysis and footprint patterns provide valuable clues — you’ll find examples in the articles linked and throughout our blog.
What markets and timeframes are best for working with consolidations?
There is no single “best” market or timeframe—it depends on your ability to correctly identify consolidations and make disciplined trading decisions. Professional ATAS tools for volume analysis help increase efficiency.
A common consolidation trading strategy: identify consolidation on a higher timeframe (e.g., H1), then switch to a lower timeframe (e.g., M5) to pinpoint your entry and get additional confirmation.
💡Note: In volatile cryptocurrency markets, consolidations are often more aggressive.
How to learn to analyze consolidations?
Use the ATAS Replay simulator. It reproduces history as if trading were happening in real time. You don’t risk your actual funds while practicing decisions in real market conditions. You have access to many useful features: tick data, all types of footprint, all available indicators, and even speed control.
Conclusion
Consolidation is a fundamental phase of the market cycle. Markets spend most of their time fluctuating within consolidations rather than trending.
Consolidation reflects the balance between supply and demand. It can signal market stability or a temporary pause within a larger trend.
Traders must identify consolidations on the chart — their boundaries in time and price — and act accordingly. Using trend strategies during consolidations leads to losses. Stop guessing whether a breakout will be real or false. Start seeing what’s actually happening inside the market.
Download ATAS for free and use its advanced tools to analyze exchange data based on facts, not guesswork.
Information in this article cannot be perceived as a call for investing or buying/selling of any asset on the exchange. All situations, discussed in the article, are provided with the purpose of getting acquainted with the functionality and advantages of the ATAS platform.
Subscribe
Get the latest ATAS news delivered conveniently