A double bottom and a double top are popular technical analysis patterns that indicate a trend reversal.
In this article:
double top and bottom patterns in detail;
how to trade;
advantages and disadvantages;
ways to improve double bottom and double top pattern trading with professional tools for volume analysis.
The article has numerous chart examples with explanations and links to relevant articles.
How does the pattern look on the chart?
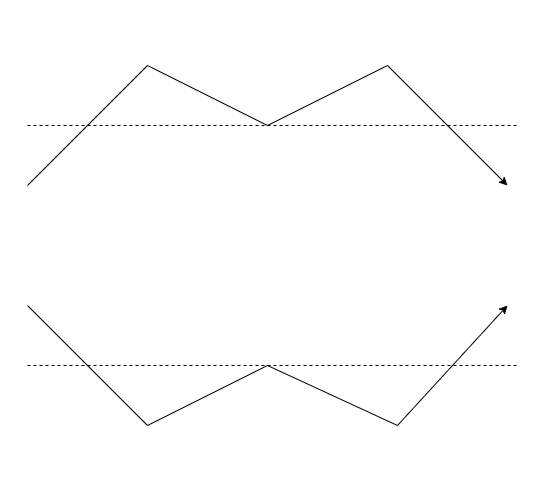
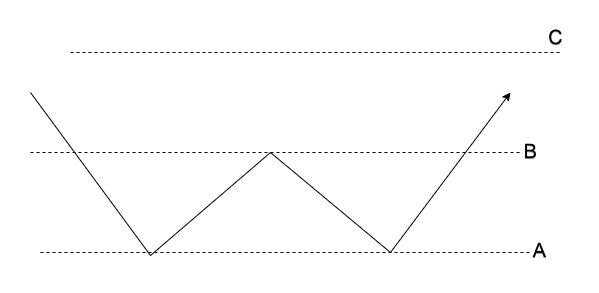
A double top resembles the letter “M”, a double bottom resembles the letter “W”.
The picture above schematically shows the patterns:
the double top (top picture);
the double bottom (bottom picture).
The dotted line, drawn through the intermediate peaks, is called the neckline.
Question: Does the second top (second bottom) have to reach the same level as the first one?
Answer: No. However, the level of the second top (second bottom) will occasionally coincide with the level of the first top (bottom), but it will not happen often. It is quite possible that the second top (second bottom) will be slightly above/below the first top (first bottom).
In fact, the double bottom and the double top are patterns that mirror each other.
Let’s have a look at the double bottom and then at the double top.
Double Bottom pattern example
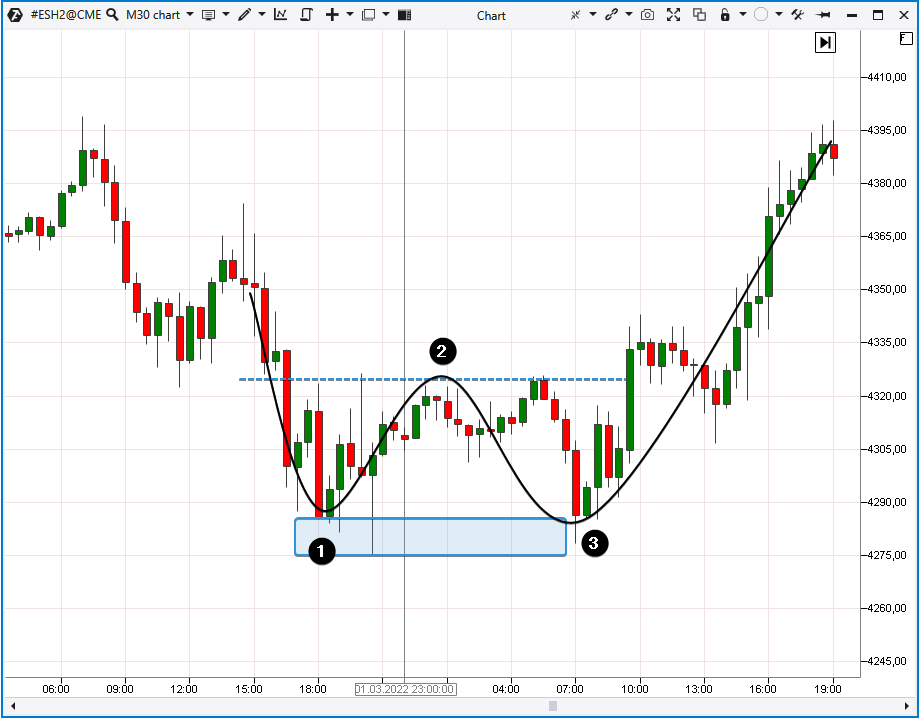
Let’s have a look at an example of the double bottom pattern from a real price chart for E-mini ES futures, the data was taken from the CME exchange, timeframe = 30 minutes.
The real chart shows that the pattern does not look as perfect as it does on the diagram.
Numbers indicate:
According to the first approach (to anticipate), you should open a short position when the price is in the support zone. The support zone occurs after the first top has been formed.
According to the second approach (to react after confirmation), you should open a long position after you have received some clear signals (confirmation) that the second top is being formed.
A variation of the second approach is to open a long position after a breakout of the neckline.
Question: Which approach should you use?
Answer: There is no ideal solution.
If you trade the double bottom according to the first approach, you accept the risk that the price will break the support zone and the downtrend will resume. If you trade according to the second approach, you might suffer great losses in case the pattern fails. The stop loss can be quite wide if you open a long position after confirmation.
Which approach to choose? Well, it depends on your personality and risk tolerance.
Question: Where to set stop-losses?
Answer: The conventional wisdom says that if you follow the first approach (to anticipate), you should set a stop-loss a bit lower than the first low. If you follow the second approach (to react), you should set a stop-loss close to the second low.
It is believed that a trader should exit the position once the pattern is broken. However, keep in mind that conventional wisdom is often wrong.
Double Top pattern example
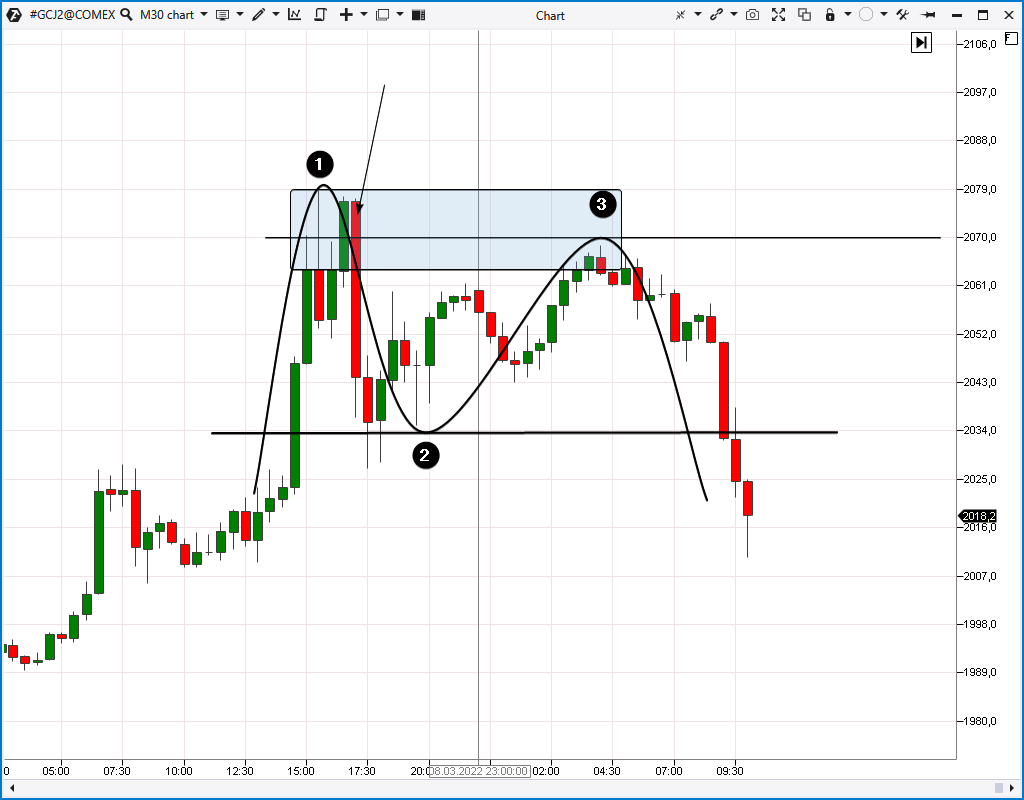
In the example below, a double top pattern is formed on the gold futures chart, M30 timeframe, the data was taken from the COMEX exchange.
Numbers indicate:
If the double bottom pattern has been formed on the chart between levels A and B, the price has the potential to reach level C, where AB = BC. Therefore, setting a take-profit at level C is considered the best solution.
Note that this calculation is often wrong “in both directions” because the price may either not reach level C or continue moving further.
This calculation can also be used for the double top pattern but in a mirror image.
How to trade a breakout test of Double Bottom and Double Top?
A breakout test is a popular method of trading by technical analysis patterns. The double bottom and double top are no exception.
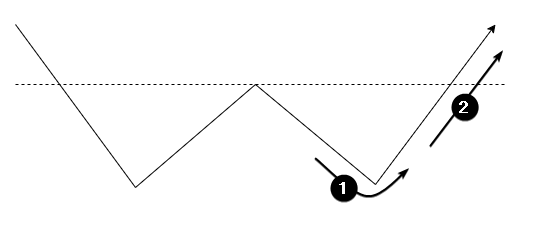
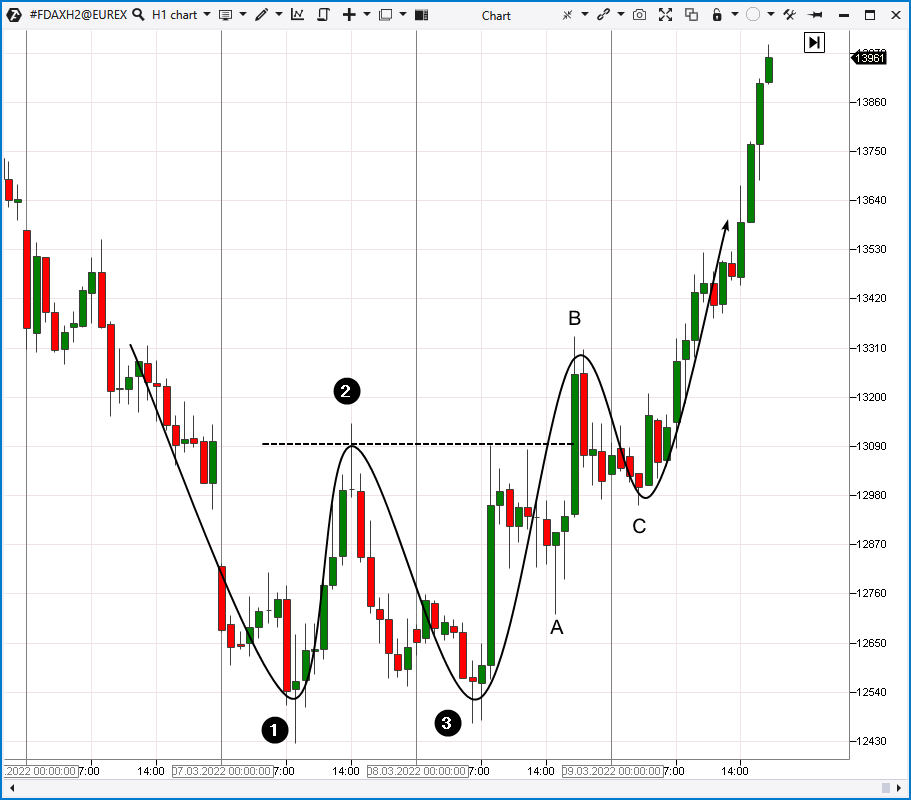
Let’s have a look at the idea of trading the double bottom breakout test. There is an example of a futures contract for the DAX index, H1 timeframe, EUREX exchange data.
Numbers indicate:
Letters indicate:
A – the first top.
B – the second top.
C – the neckline.
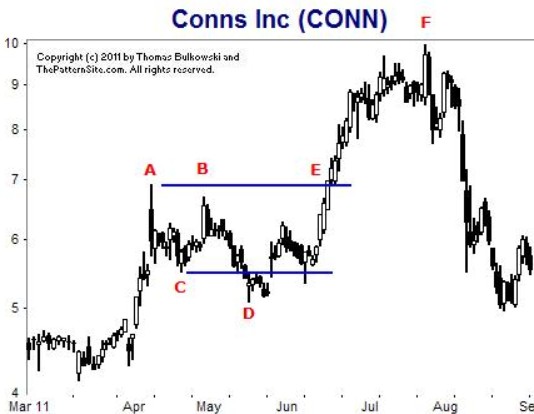
D – the breakout of the neckline. This is a classic sell signal. However, Thomas Bulkowski suggests considering this breakout as a false one and a part of the Busted Double Top pattern formation.
E – sellers close their positions at a loss, which strengthens the bullish momentum. This is an entry point for a long position by the Busted Double Top pattern.
F – the peak that was reached after the Busted Double Top pattern is +44% in this case.
According to Thomas Bulkowski’s statistics, there is a 36% chance that the busted double top will appear after the formation of the double top pattern.
How to improve Double Bottom and Double Top pattern trading?
Use the professional tools of the ATAS platform.
Try to use non-standard chart types that are available on the platform. For example, Range XV chart.
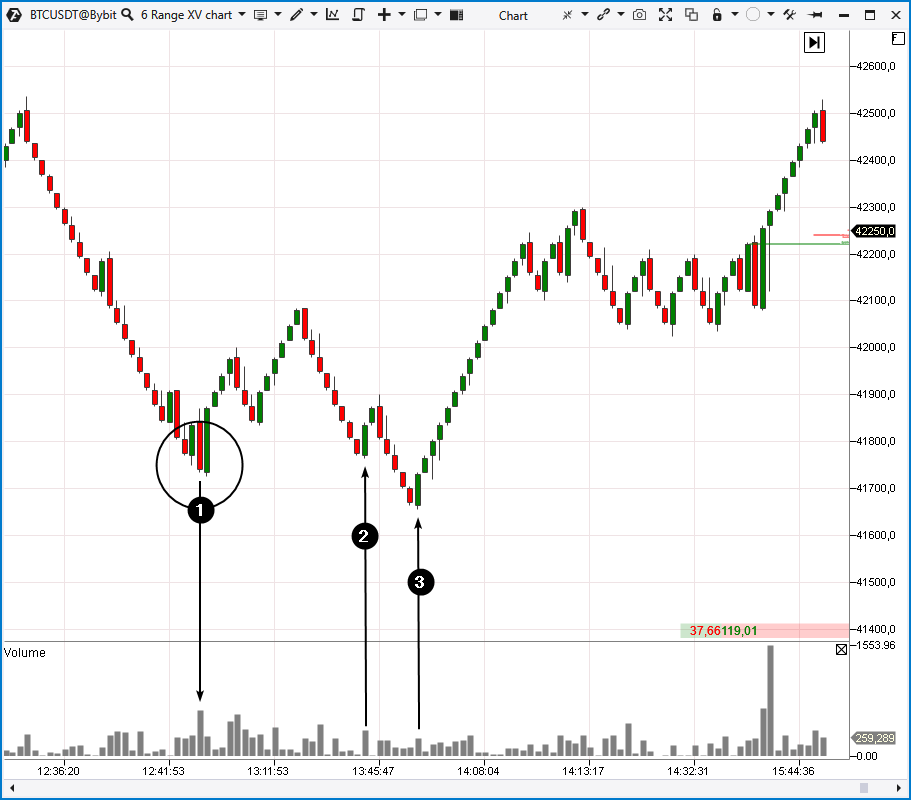
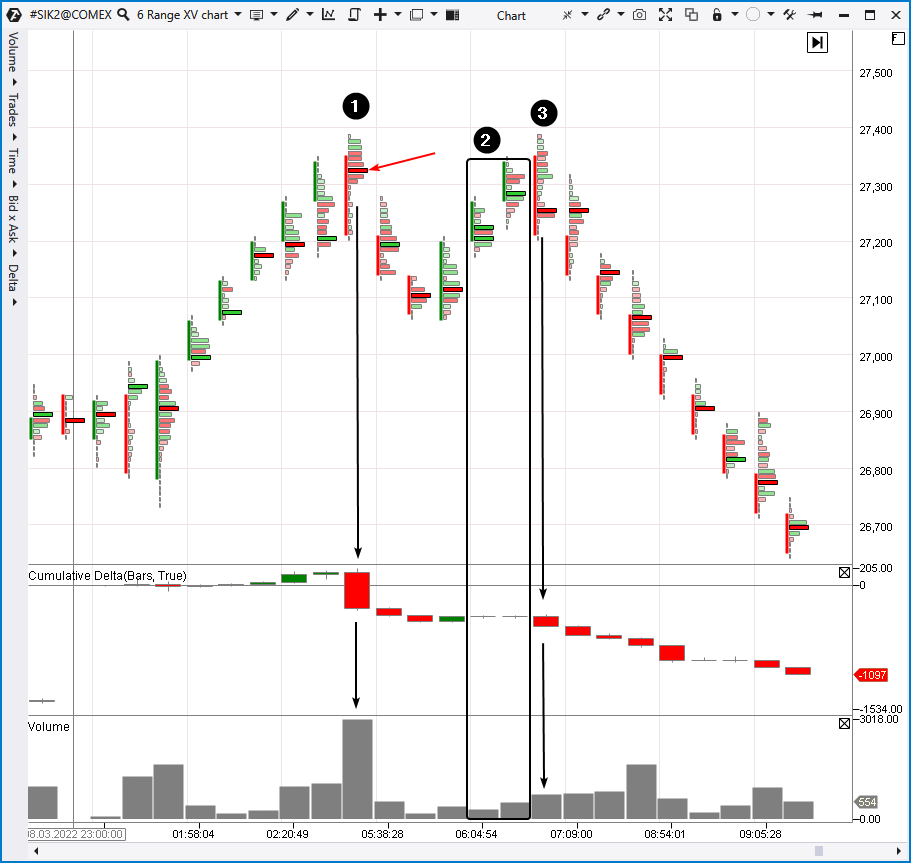
You can see a bitcoin price chart below.
Numbers indicate:
Number 1 indicates a bearish reversal candle. Moreover, the volume histogram has the highest bar and the delta is negative. There is a bright red cluster that stands out from all the rest (it is indicated with a red arrow). This is a clear sign of a seller appearing just above the 27,300 level.
Number 2 indicates a rise to the resistance level. Pay attention to volumes and delta. They are quite “weak”, which can be interpreted as “drying up” of buyers’ pressure. It is unlikely to overcome the previous top with such low volumes.
Number 3 indicates a bearish reversal candle. Volumes increase on a negative delta. It is a sign that a seller at the 27,300 level keeps being active, therefore, opening a short position with a short stop will be justified.
Buying exhaustion and a stable presence of sales indicate changes in the market nature. Apply this logic to read volumes and you will recognize double top and double bottom patterns more effectively.
Clusters help to recognize changes in the balance of supply and demand better.
How to improve Double Bottom and Double Top pattern trading?
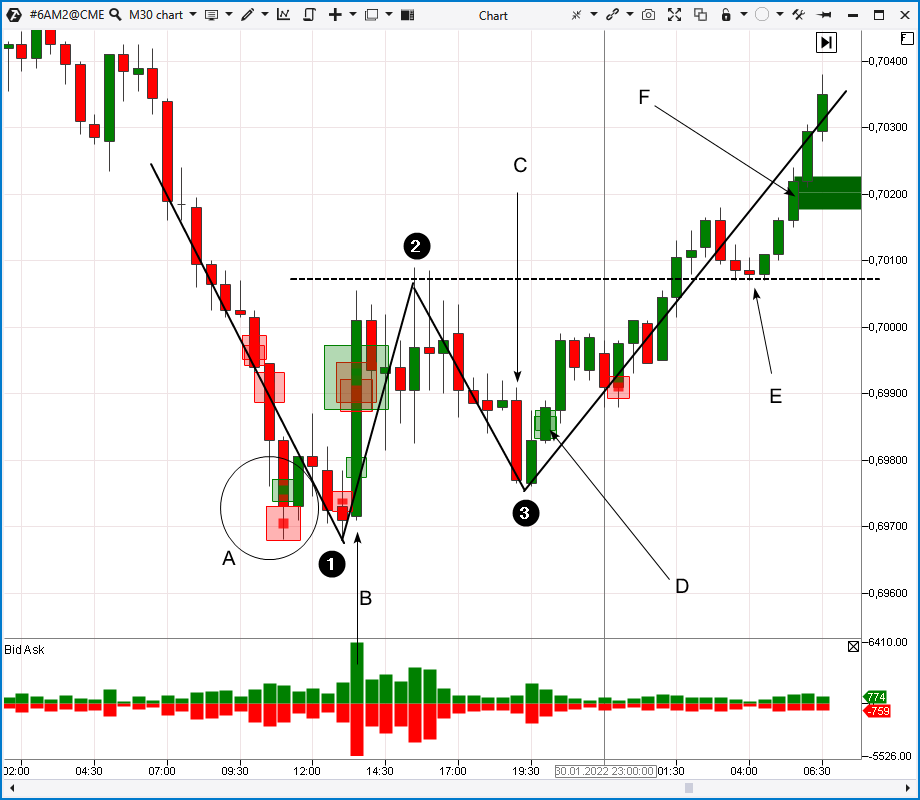
The picture below shows a 30-minute Australian dollar futures chart. BidAsk, BigTrades (it is displayed with red and green squares) and Stacked Imbalance indicators have been added to the chart.
Numbers indicate:
The first bottom.
The intermediate peak, a dotted line of the neck is drawn along it.
The second bottom.
Important moments:
When the first bottom is being formed (A), trading activity increases and the decline accelerates, which is typical for panic selling. Note that the events take place after the bearish breakout of the 0.7 psychological level. Surely, traders were scared to see that the price broke this round level and started to fall even faster. Big Trades signals are frequent, which means that major traders are active. You can find further information on this topic in our series of articles about VSA, for instance, trend climax.
A wide bearish candle (B) is being formed between 1→2. The candle indicates an increase in demand. It is too aggressive for a regular pullback within a downtrend.
Selling pressure is decreasing towards the second bottom. Pay attention to a bearish candle (C), its volumes are low.
A big buy (D) can be noticed at a price rise that occurred after the second bottom had been formed. It seems like a major player made sure that the selling pressure was exhausted. The number of sellers willing to part with the Australian dollar below 0.7 is small, and the exchange rate is likely to increase. A buy at this point will be quite justified both in terms of perspective and in terms of acceptable risk.
Point (E) is a breakout test, there is a price decline on low volumes (it is a sign of a classic correction).
Point (F) indicates that demand exceeds supply.
How to start trading like a Pro?
We hope that chart examples of double bottom and double top patterns will be useful for you. If you would like to learn about chart patterns and make sure that volume analysis is extremely useful, download the ATAS platform.
You can register and download it for free. You do not need to give your bank card details.
You can continue using the program even after the 14-day trial period.
There is a demo account built into the ATAS platform, so you can practice trading without risking your real capital.
If you have any questions about installing or setting the program, contact the support service. Thank you for reading our blog, subscribe to our YouTube channel.
Conclusions:
In trading, double top and double bottom are patterns that are used to trade trend reversals in the forex, futures, stocks, cryptocurrencies markets and other financial assets.
The first top (bottom) represents a climax with high volumes and aggressive changes in price. Quite often, climaxes are accompanied by news or a breakout of the round level.
A highly aggressive movement from the first top (bottom) to the intermediate trough (peak) indicates the appearance of opposite market sentiments.
The second top (bottom) indicates that climax activity has weakened and there are conditions for a market reversal.
The problem is that a double top (double bottom) pattern occurs quite often because the pattern is very simple, it consists of only three points. Very often patterns are formed within the day. Of course, not all of them lead to a trend reversal.
Use confirmations from professional volume analysis tools to identify real patterns more effectively.
Download the free version of ATAS right now! Try a powerful cluster chart analysis tool for stock, futures and crypto markets.
Information in this article cannot be perceived as a call for investing or buying/selling of any asset on the exchange. All situations, discussed in the article, are provided with the purpose of getting acquainted with the functionality and advantages of the ATAS platform.