
The duality problem
At the beginning of studying volume analysis, a trader learns: Beginners often have the illusion that making trading decisions is quite simple – just spot a large positive delta on the chart, which indicates a big player, and follow their buying logic. But it is not that simple. Having noticed large volumes, you need to ask yourself basic questions:- Is it buying or selling?
- Whose buying or selling is it – professional traders or retail buyers? What motivates their decisions?
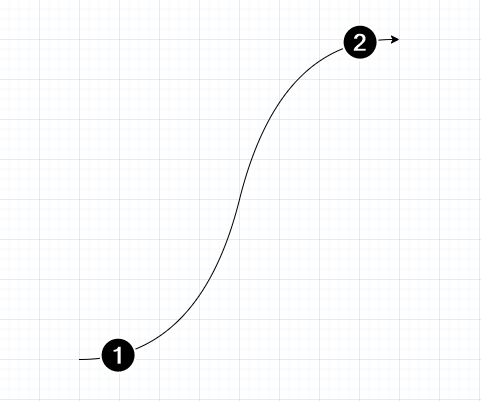
Trend diagram
Below is a diagram of a bullish trend (the opposite is true for a bearish one).
- the price can go up or down;
- the price can move on high and low volumes;
- volumes can represent buys and sells;
- buying and selling can represent totally different motives for professional traders and the mass of retail traders.
- The end of a rising market and bag-holding patterns
- No demand and no supply patterns
- Buying and selling climax patterns
- Shakeout & upthrust patterns
- Accumulations and distributions
Volume analysis examples
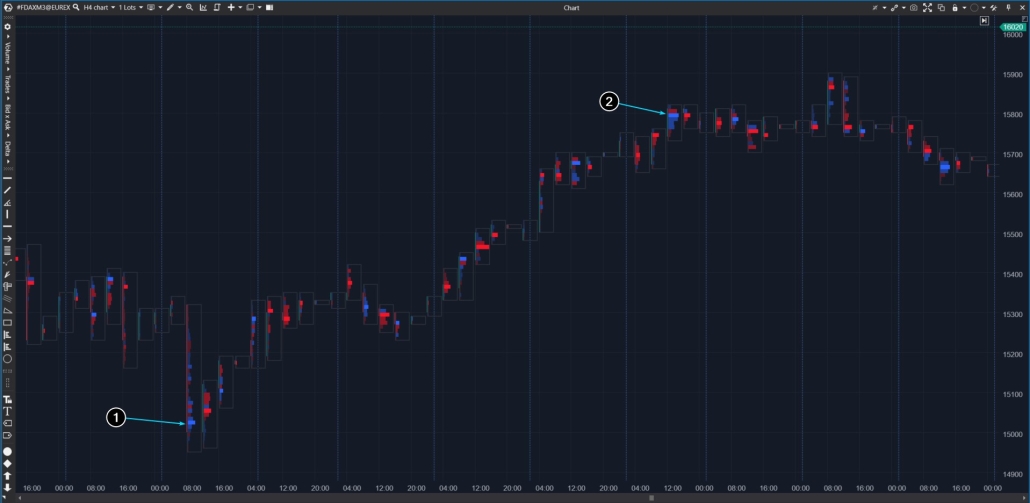
Example 1
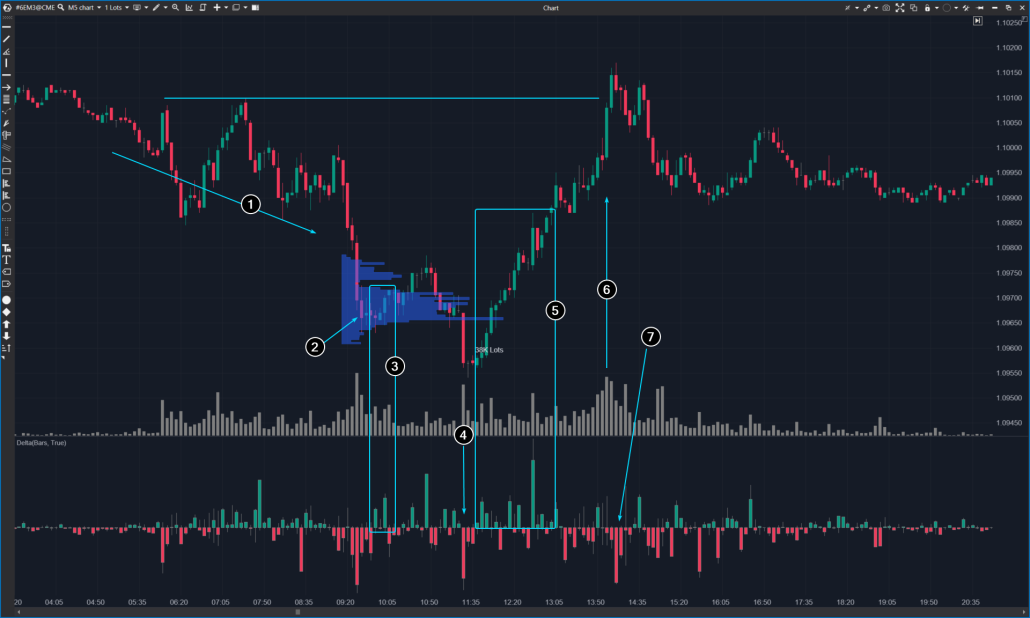
This is a timeline of one bullish day from the euro futures market. This is a footprint showing horizontal volumes inside each 5-minute candle. The delta indicator has also been added to the chart.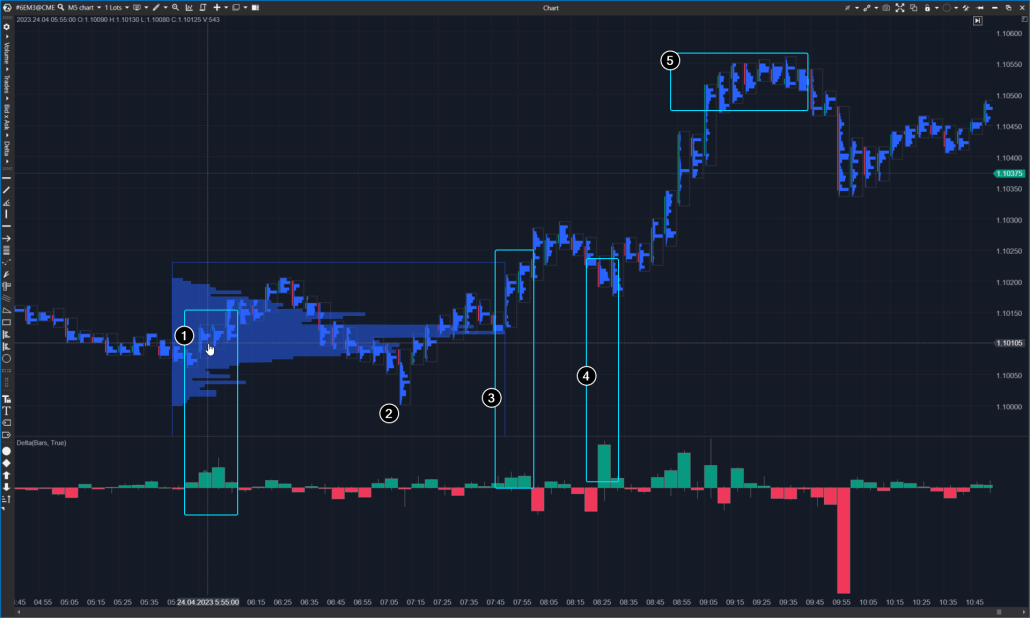
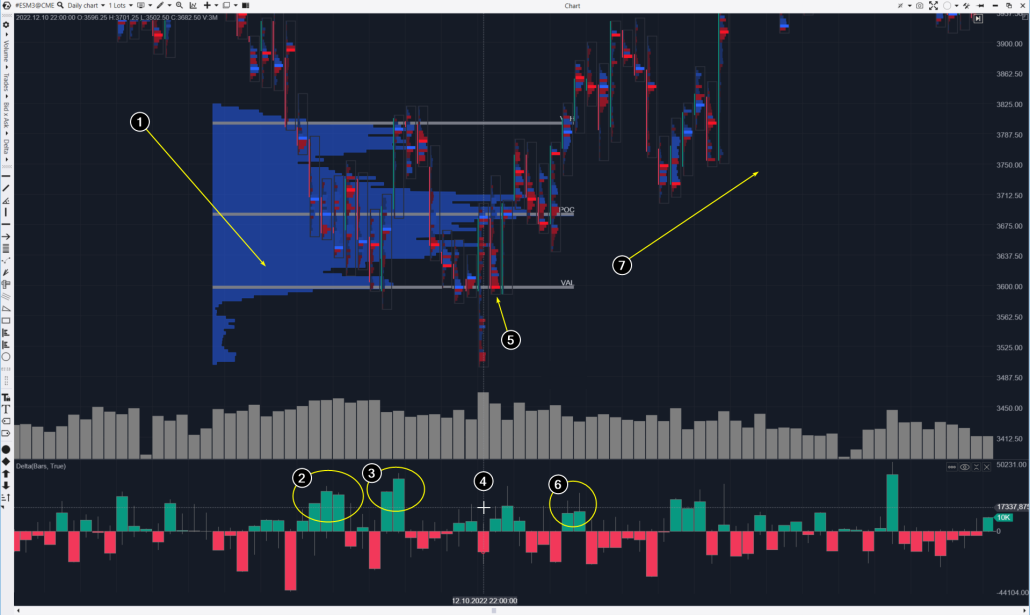
- There was a downtrend in 2022 amid rising inflation, Fed tightening policy, and concerns about a recession.
- A spike in positive delta indicates market buys. A hypothetical large player may have decided that the price had fallen enough (to the 3,700 level) to become attractive for accumulating a long position. Notice how bearish progress is slowing down.
- Another spike in buys occurred. However, those who had opened long positions in anticipation of a reversal acted hastily (this will be apparent in retrospect). The downtrend, which lasted for more than half a year, could not reverse so quickly. The price dropped from VAH to POC. Probably, a large player continued to form long positions.
- On October 12, amid an important news release, the price dropped below the VAL level. Sells that occurred at a minimum are likely to reflect the panic of retail traders (while a large player took advantage of this situation and bought from them, thereby completing the formation of a long position). Then the price rose to the POC level, and the session closed at the highs. Trading volumes were record-breaking, and the price dynamics indicated strong demand.
- The next day, the bears attempted to break through the VAL level, but their efforts were in vain, as the subsequent days revealed. It is worth noting the concentration of selling pressure in the market.
- A spike in positive delta indicates the efforts of a large buyer to break through the VAH level in order to push prices higher and establish an upward trend.
- Given the positive fundamental factors, the trader manages to achieve this – pullbacks to rising lows are holding at around the 50% level.
Conclusions
Believing that volume analysis is the key to making money on the exchange easily and quickly is a mistake and can lead to falling victim to an illusion. A trader who studies trading volumes using footprint charts, etc., increases the amount of important information available for analysis. But at the same time, the number of options for its interpretation also increases due to numerous probabilities:- the price can go up or down;
- the price can move on high and low volumes;
- volumes can represent buys and sells;
- buying and selling can represent totally different motives for professional traders and the mass of retail traders.
- allows you to download tick history from the futures, stocks and crypto markets so that you can get a detailed picture of the market;
- offers many benefits for traders who want to combine bounce trading with easy-to-use cluster charts and useful indicators.
Information in this article cannot be perceived as a call for investing or buying/selling of any asset on the exchange. All situations, discussed in the article, are provided with the purpose of getting acquainted with the functionality and advantages of the ATAS platform.


