
- why the following skills are vitally important for a trader: speed of thinking, learning ability, computer skills, consistency, discipline and intuition;
- what unique market analysis means allow looking “inside” the exchange chart and see real events that take place there;
- how major players manipulate the crowd opinion;
- how to organize online trading in order to increase chances of making profit.
Where to find money for online trading on the exchange
There is an opinion that trading is for wealthy people only. And an average person would need to pawn a flat or car in order to start trading on the exchange. Let us see whether it is so. So, in order to trade on the exchange you will need a minimum amount of money equal to the guarantee collateral (GC). Put this amount on your trading account and your broker will open you access to trading operations. Guarantee collateral is set by the exchange for each financial instrument and can differ depending on the asset value or popularity. For example, at the time of writing this article, you need to have RUB 16,725.48 on your account for one RTS index futures contract and the cost of one EUR/USD futures contract is USD 2,300 according to the Chicago Mercantile Exchange. These amounts might seem too big to put them at risk for someone, but no need to despair – there are cheaper financial assets. For example, one PAO Sberbank common stock futures contract is assessed by the exchange in the amount of RUB 2,993, while its volatility is not less than that of the instruments with bigger GC. A beginner trader needs to have RUB 14,965 for trading 5 PAO Sberbank common stock futures contracts without regard for the brokerage and exchange commissions. Volatility of this instrument is, in an average, 500-700 points a day. Thus, the myth about a huge amount of money, which is required to start trading on the exchange, stays a myth. In fact, in order to start online trading you will need an amount, which is not more than a half of an average monthly salary.Still, what to do if your pockets are empty? You can get a small startup capital borrowing money from your friends or getting a small loan. However, this is a dangerous way. We recommend you to trade on borrowed funds only if you have a clear strategy and positive results of applying it for, at least, half a year.
Trading platform. Review of instruments for a successful trader
Are you a beginner trader and want to get trading advantage over other traders? Do you have some online trading experience but want to move further in understanding the market?Try ATAS – a platform for trading and market data analysis. One of the main advantages you get when using the platform is a possibility of footprint analysis.
The term footprint consists of two words – foot and print – which means a trace or mark. These traces conveniently show details of the executed trades in the chart:
- at what time exactly they are executed;
- by bid or ask;
- buy or sell volume;
- delta change.
Footprint helps you to find answers to the questions: who took the initiative, what it lead to and, most important, how to trade in harmony with the market?
If you used to analyze a chart in the form of Japanese candles, you can compress footprint clusters into the candle format or expand candles to see each candle’s structure with one mouse move. It is very useful, because further moves secretly originate namely in candles.
Footprint makes it possible to detect an initiative trader or group of traders and gives understanding of initiative directed at the price movement or holding and also a possible stop of the price and beginning of its reversal.
How does it look like? Let us consider it in the chart below.
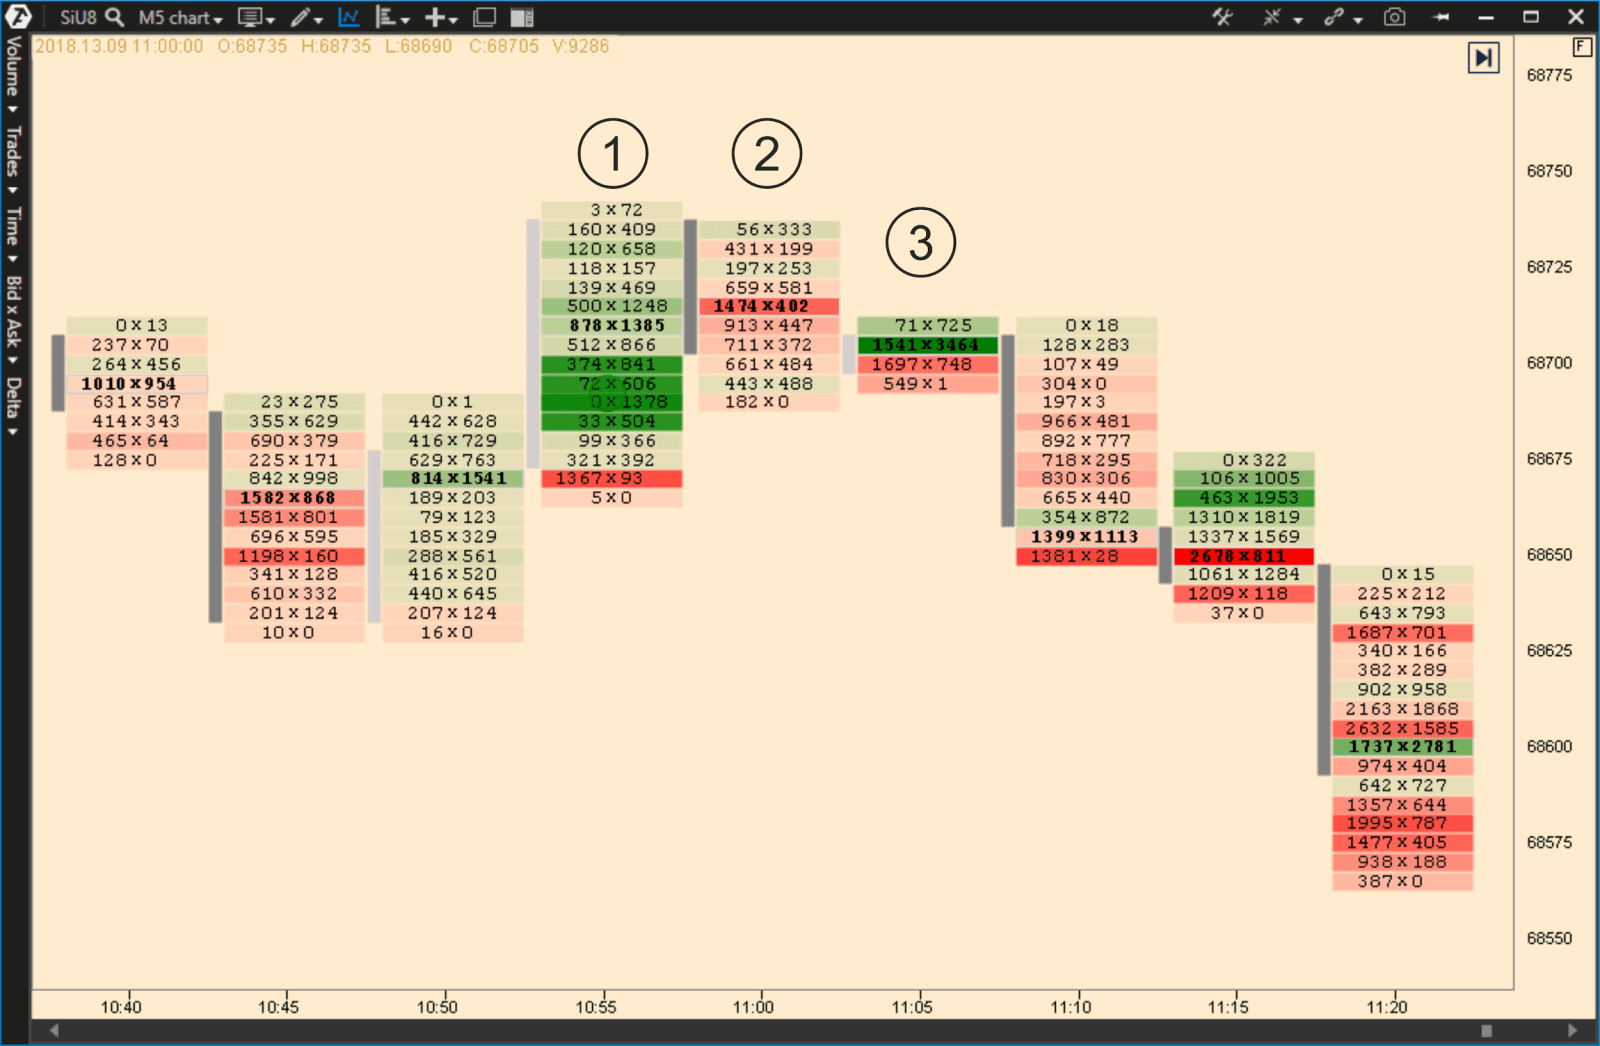
Select Mode in the upper chart menu and activate Clusters.
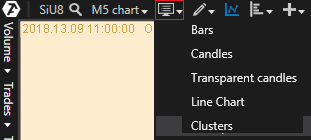
Then click ‘Bid x Ask’ in the left horizontal menu and select ‘Bid x Ask’ in the appearing submenu. Now your chart will look similar to the picture above except for color settings.
Moreover, other modes of cluster display will also be useful for you. For example, ‘Bid x Ask Ladder’ will serve for division of text information in a cluster and coloring by strength of the seller and buyer, while ‘Bid x Ask Histogram’ will help to display volumes in the form of a color histogram.
Volume values will be overlaid over the chart histogram in the ‘Bid x Ask Digital Histogram’ mode.
The ‘Bid x Ask Volume Profile’ mode will keep the volume values but will add a histogram of aggregate volumes by Bid and Ask into the cluster and will color each price level by the buy or sell priority colors.
You will see delta histograms in each cluster with priority coloring in the ‘Bid x Ask Volume Profile’ mode.
And the ‘Bid x Ask Imbalance’ mode will tell you where important levels of the change of balance between buyers and sellers are.
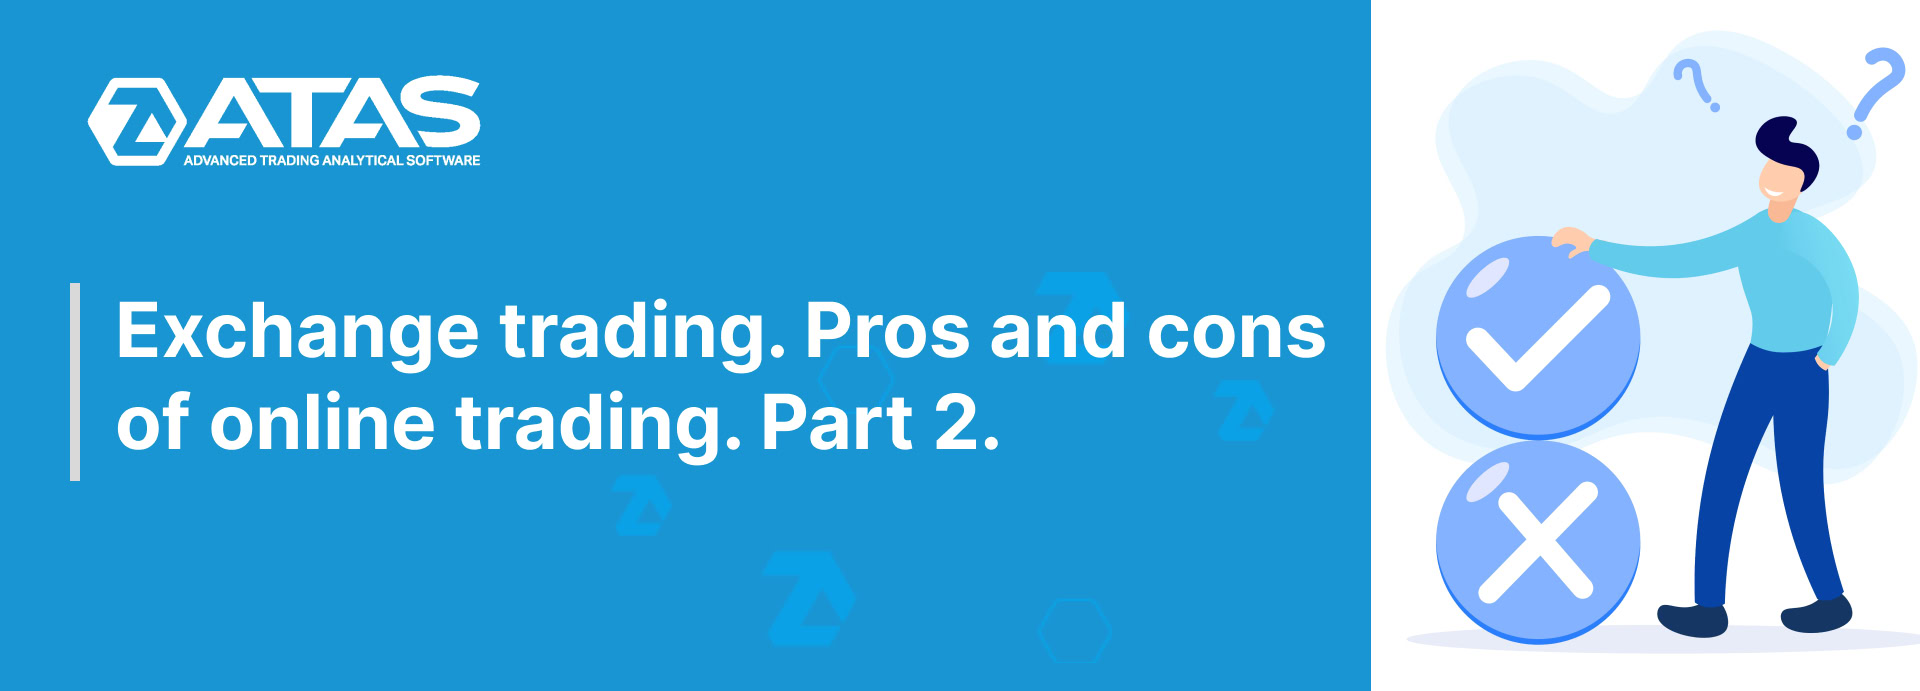
So, let’s come back to our chart. Each column with numbers is a well-known Japanese candle but under a microscope. It seems like it consists of small bricks. Each brick is a cluster (the name ‘cluster chart’ originates from here). Lines correspond with their price levels in each cluster. Numbers are divided with the ‘x’ symbol in each line and correspond with volumes registered at each price level. Volume to the left in each line contains information about sell trades by the bid price, while the right volume is the buy trades by the ask price. For example, we can find the value of 878×1385 in candle 1. This tells us that 878 contracts were executed for selling at a certain price level and 1,385 contracts at the same level were executed for buying. We should note that the considered cluster points to increased demand on behalf of aggressive market buyers, since the cluster mostly has green coloring (the cluster color is identified by delta).
But it is important to remember that the number of buyers always corresponds with the number of sellers in the market. That is, the whole demand at each individual price level is satisfied by means of the available supply and vice versa. If you see that the sell trades in the volume of 1,000 contracts took place at some price level at the bid price, it means that someone sold 1,000 contracts and someone bought these contracts. Furthermore, it is not important what the number of participants was from each side and whether they opened or closed their positions.
Now, let us consider each of the clusters separately, in order to mark important moments, and we start from cluster number 1:
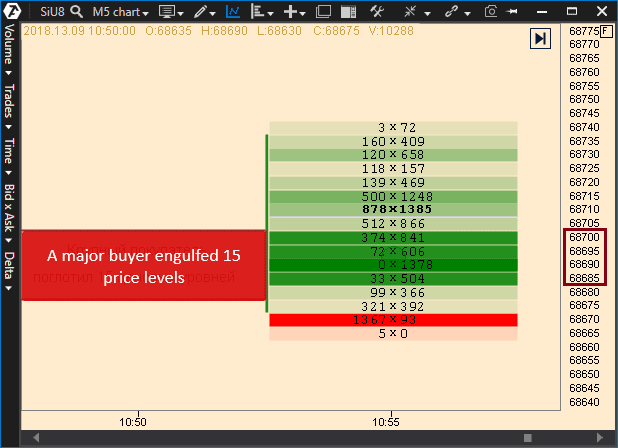
The Bigtrade indicator registered (in this cluster) a big trade of a buyer at price levels of 68,685-68,700, which aggregate volume was 1,932 contracts. Note that the volume of sells is extremely low in this price range and even equals zero at the level of 68,690.
Such a situation tells us that the seller chose to hide his activity, instead he posted limit sell orders and satisfied the whole demand of the buyer. The reducing volumes in the right part of the cluster tell us that the demand reduced while the asset cost moved to the level of 68,740, which indicates reduction of the buyer’s activity. In order to identify who is stronger in this situation, let us apply the method of sports score with awarding points to each side and with final calculation of points.
We give 1 point to the seller, since he prefers to hide his presence, which means he is smarter. Moreover, the volume of his supply is big enough for executing all buy orders. The score is 1:0 in favour of the seller.
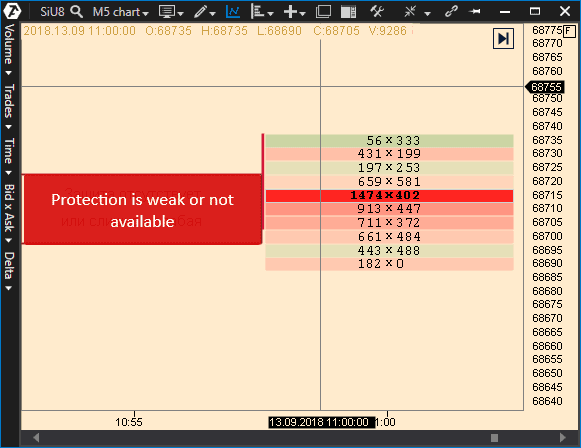
Check the next cluster marked 2. Red color predominates in it, which shows predominance of sellers. It should be noted here that the buyer either has no intention to hold this level or his volumes are insufficient for it, since emergence of an increased volume of limit buy orders was registered at the level of 68,715 and that volume was 1,474 contracts, however, they failed to hold the seller’s pressure, which means the seller scored again and the score is 2:0.
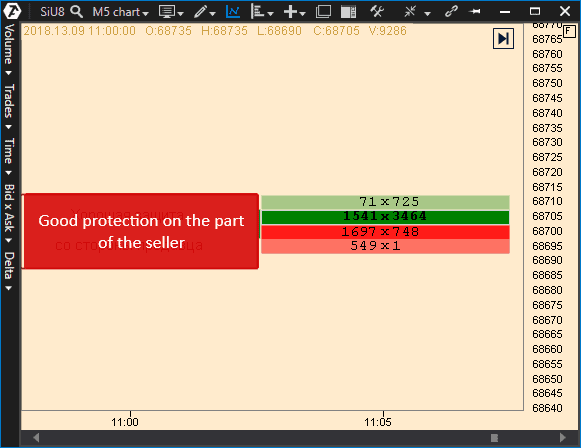
We registered one more splash of the buyer’s aggression in cluster 3, however, the price failed to overpass the resistance level, posted by the seller, and further clusters were traded in the descending trend. The seller scores again and the total score is 3:0 in favour of the seller.
Let us draw a conclusion regarding our battle and check where this situation in the candlestick chart with the 5-minute interval drove us to:
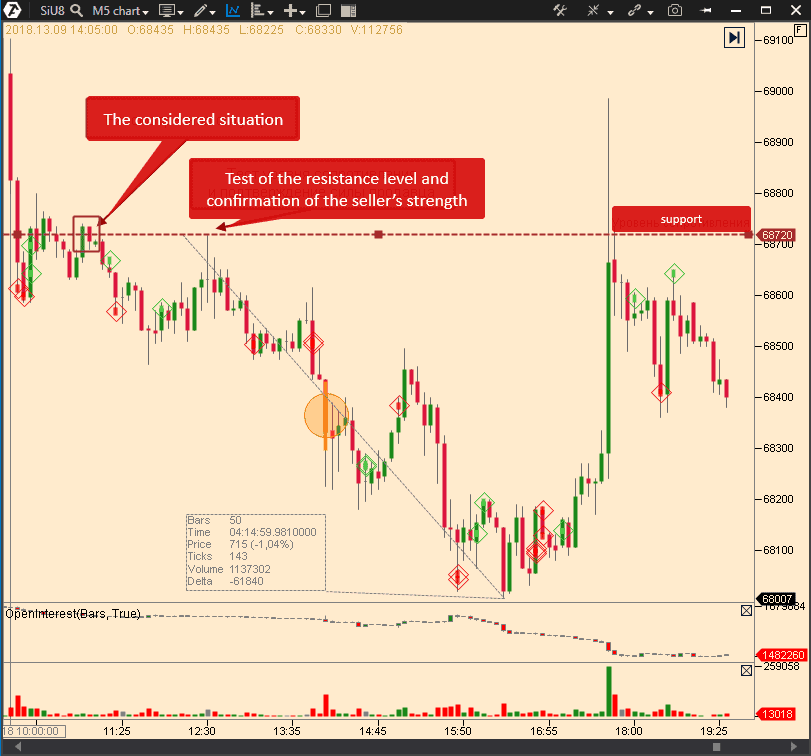
If you adjust you chart like this, you will always be able to detect aggressors and participants who take a stand against such aggressions. Since there are two forces in the market (buyers and sellers), you will be able to understand better who is stronger at the moment and to build your trading strategy with consideration of these data.
Now you see and know much more than if you would have looked in a bar chart only. The knowledge of traded volumes, as well as strength and weakness of the initiator, gives you an opportunity to judge about specific intentions of the market major players, who determine price movements.
Traders’ forums. Pros and cons of somebody else’s advice in trading
Apart from using the chart data, which is sufficient for profitable trading using the ATAS platform, traders look for additional information in various forums, where participants discuss markets, share their ‘secrets’ and opinions and publish their forecasts and expectations.A person, by his nature, is not inclined to think himself, instead he likes to use somebody else’s readymade answers. That is why a beginner trader will often look for answers at such resources hoping that someone clever will offer a universal model of profitable trading. But you should understand that the market is a struggle between different participants. And, like it is in any struggle, the winner is the one who is stronger, smarter, faster and has more resources. That is why, to lay just somebody else’s opinion or advice in the basis of your trading system is not the best way to increase efficiency of your trading.
At the same time, you should take into account the fact that popular forums and news resources might belong to persons who are your trading counteragents, the aim of whom is to make profit at the expense of unsuspecting readers. That is why, if you come across a profitable method or advice of a ‘skilled’ trader, you’d better try to understand why this trader decided to share this valuable information with you. Rather than wasting your time in search for a free Grail, we recommend beginner traders to figure out all intricacies of exchange trading with the help of ATAS, the platform for professional market analysis. Learn about its basic functionality here:
https://help.atas.net/en/support/solutions.
Trader’s diary. What it is and who really needs it
Every day in the financial market is different. Each session is a unique experience. A trader gets a portion of information for analyzing himself and his trading strategy from the results of his work during a day (profit or loss).Does the reason of losses lie in the strategy or trader’s actions? How to correct it? How to improve? How to trade tomorrow better than today? A trader needs to regularly analyze trading results, compare the plan with the real life and make corrections in search for unprejudiced answers to these vitally important questions.
Own trader’s diary, which contains trading statistics, ideas, observations and comments, is indispensable in this endless process.
For example, you can always use your diary to note down the reason why you entered into a trade and describe your observations. Later, you can check correctness of your judgements or detect the cause of error.
Use your diary to note down the arguments why you decided to close a trade and it will help you in future to understand why you didn’t hold it a bit longer. The ATAS platform provides you with a convenient interface for monitoring the equity curve and changes of your trading results.
While monitoring the market, you will notice some regularities and dependencies, which, of course, you’d better note down in your diary. For example, you will notice a stable formation of the technical analysis patterns in one financial instrument and will detect in another one that the traded volumes will result in predictable inertial price movements in one or another direction.
A diary is your personal assistant. It helps you to process your observations in order to make valuable conclusions later, saying: “yes, the diary confirms that this pattern often results in the market reversal and I can use it in my trading in future”.
It’s up to you whether your diary is digital or on paper. Just note that the ATAS platform has functions, which automatically register trading statistics and provide a possibility to load history and make comments.
In order to get access to these functions, select Statistics in the main window of the platform, set History for analysis of the past statistics or leave Realtime for analysis of the current trades.
The picture below shows how it might look like:
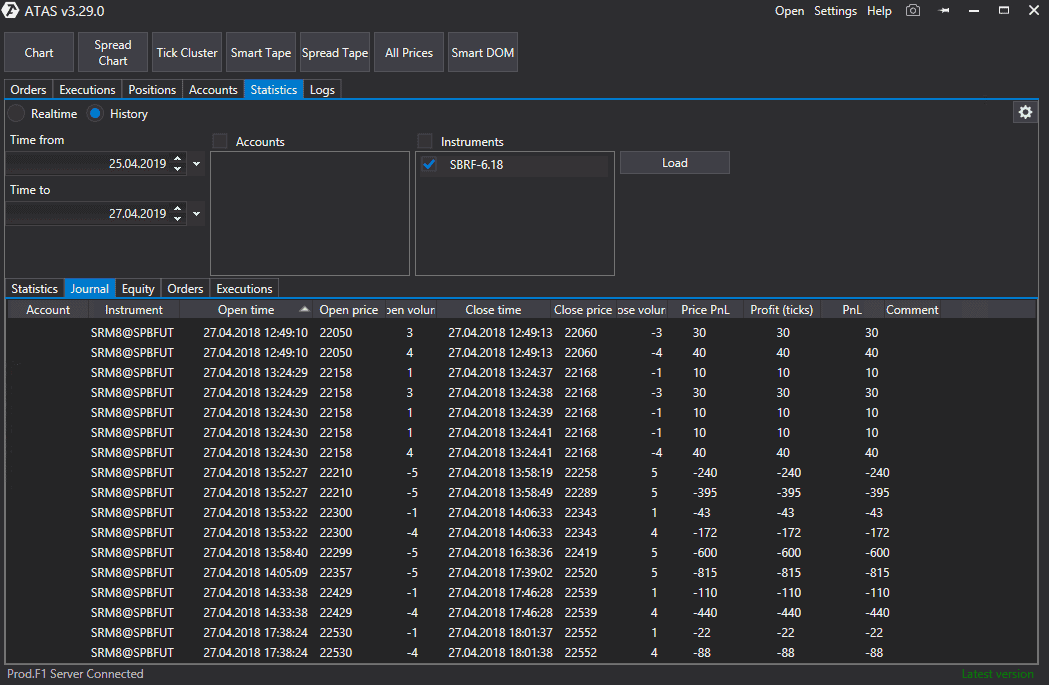
Now you can test on the history any observation you made, find regularities at the times of important reversals and monitor behaviour of buyers and sellers in any market at any moment.
Thus, keeping a personal diary with the help of the reach functionality of the ATAS platform becomes an efficient means for profitable online trading on the exchange.


