
What exhaustion of buying or selling pressure is
Traders can use different descriptions, but the idea remains the same. Exhaustion means a gradual decrease in the activity of buyers or sellers as the price becomes less and less favorable for them. When current prices become unfavorable for market participants, they naturally show less initiative. This is how the classical law of supply and demand manifests itself. In the following part of the article, we will show a few examples, but we must warn you that they will not be perfect references. In real trading, there will always be noise and other factors that distort the signal but a professional trader must recognize it on a chart in order to achieve their goal.Examples on charts
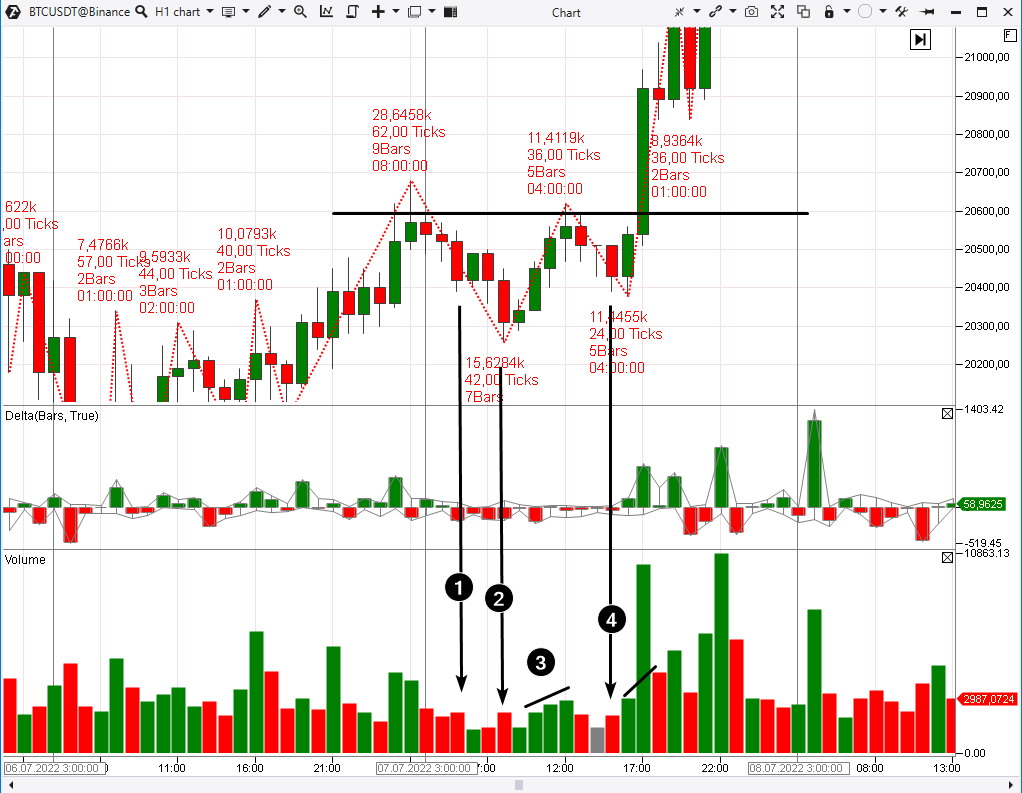
To identify exhaustion in the market, one should use the volume indicator and / or its derivatives (for example, delta). The first example is from the futures market for the British pound, the time frame is 15 minutes. A simple volume indicator has been added to the chart.
A gradual decline in volume (1) on bearish candles indicates the exhaustion of sellers’ pressure. Fewer traders are willing to sell contracts when the rate falls into the 1.1830-1.1840 zone.
A following increase in volumes on bullish candles (2) confirms that the sells have exhausted. The second example is selling exhaustion on the euro futures chart (hourly time frame) during a decline to the 1.000 psychological level. We have added not only the volume indicator, but also delta (what is delta in trading) and daily profiles.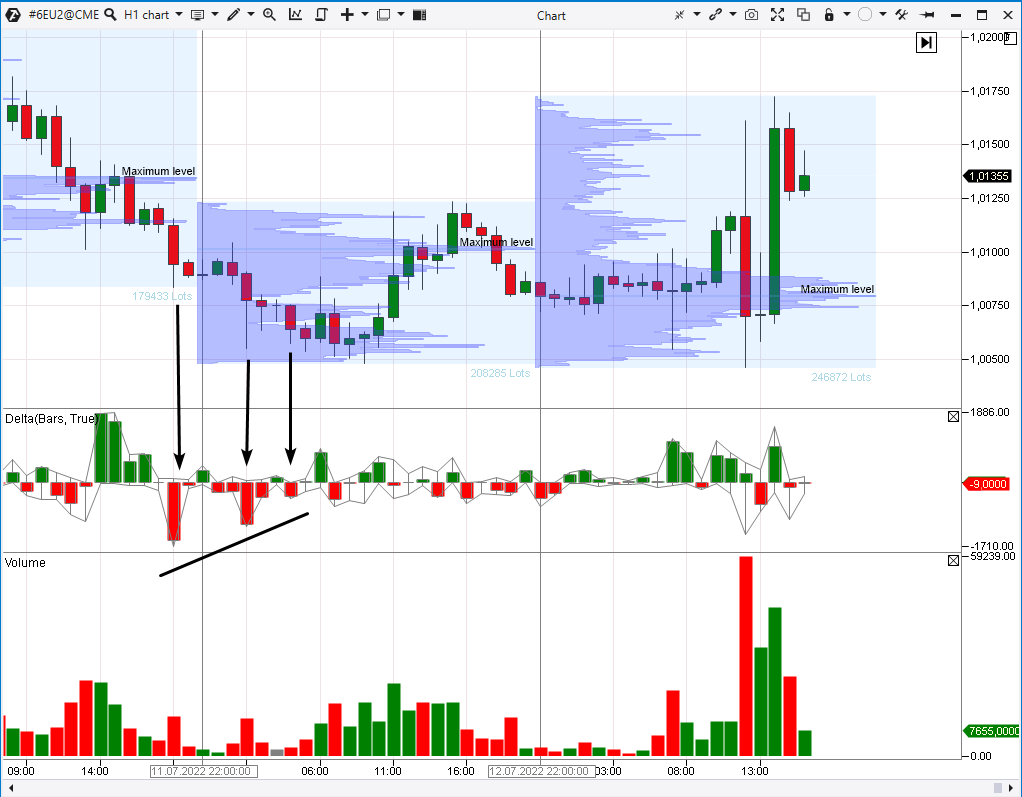
- on non-standard chart types,
- during spikes in volatility.
How to trade exhaustion signals?
Use ATAS indicators to improve your trading efficiency. Also, pay more attention to signals of selling exhaustion:- when the price drops to the support level,
- within a stable uptrend on the long-term time frame,
- amid strong bullish patterns.

How to start trading signals of exhaustion on the stock exchange
Volume exhaustion signals are a consequence of the natural law of supply and demand, which is applicable not only on the stock exchange, but also on any market. If you see buying exhaustion near an important support level, it offers the possibility to open a long position. Use the ATAS platform indicators to get an advantage in reading market sentiments from the price chart and volume confirmation of a bounce. Practice opening long/short positions when enterprising buyers/sellers enter the market after a selling/buying exhaustion signal.Conclusions
Double/triple bottom/top, head and shoulders, and other tech patterns can be confirmed by reading the volume indicators. A buying/selling exhaustion signal will be helpful in this case. How to trade these signals on the exchange? Patience, discipline, practice. And a convenient platform for work. Download ATAS. There are four good reasons for that:- It is free and you can continue using the program even after the 14-day trial period.
- You will be able to identify signals of exhaustion in the stock, futures and crypto markets.
- There is a demo account built into the ATAS platform, so you can practice trading without risking your real capital.
- The platform offers many benefits for traders who want to trade with easy-to-use cluster charts and useful indicators.
Information in this article cannot be perceived as a call for investing or buying/selling of any asset on the exchange. All situations, discussed in the article, are provided with the purpose of getting acquainted with the functionality and advantages of the ATAS platform.


