
Read in this article:
We will use the market of gold futures as an example in this article, but you can, as well, apply Fibonacci retracement levels in any other market with any timeframe.
Who Fibonacci is and where Fibonacci numbers came from
The mathematician Leonardo of Pisa lived in the 13th century and was one of the most famous scientist of his time. The Fibonacci name was derived from two words ‘filius Bonacci’ (son of Bonacci), written on the cover of the most famous work of Fibonacci – ‘Book of Calculation’. Sequence of numbers, which we call now Fibonacci numbers, originates from the problem about rabbits. Leonardo tried to solve the problem about how many rabbit pairs would be inside a fenced area in 12 months from the beginning of reproduction, if there is only one pair in the beginning of the process.Starting from the third month rabbits reproduce recurrently, which means that every subsequent number equals the sum of the previous two numbers: 0,1, 1, 2, 3, 5, 8, 13, 21, 34, 55, 89, 144, 233 and so on to infinity. By the way, if you are still wondering how many rabbits would be in 12 months, the answer is 233 pairs.We have a pair of questions after this historical excursus:
- why Fibonacci studied rabbits;
- how the results of the experiment with rabbits could be used in trading.
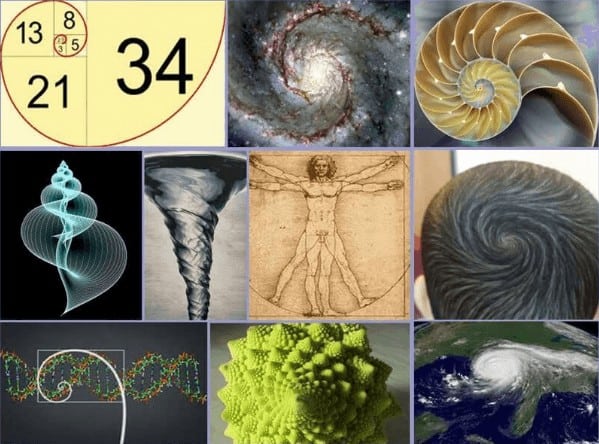
In fact, the mathematician Fibonacci was not interested in agriculture and didn’t plan to breed rabbits. He systemized knowledge of ancient Greeks and Indians in his ‘Book of Calculation’, introduced Arabic numbers and multiplication and analyzed various mathematical problems, including the one about rabbits. If we divide any number in the sequence by the previous number, we will get the number, which tends to 1.61803398874… This number is called ‘the golden ratio’, ‘Divine Proportion’ or one of the treasures of geometry. It attracted interest before Fibonacci. It is called by the Greek letter ‘phi’ in algebra.
| 1:1 = 1.0000 | which is lower than phi by 0.6180 |
| 2:1 = 2.0000 | which is higher than phi by 0.3820 |
| 3:2 = 1.5000 | which is lower than phi by 0.1180 |
| 5:3 = 1.6667 | which is higher than phi by 0.0486 |
| 8:5 = 1.6000 | which is lower than phi by 0.0180 |
If any number in the sequence is divided into the subsequent one we get the number, which is reciprocal of phi 1.618 (1:1.618) or 0.618. If we divide any number in the sequence by the number, which goes after the subsequent number in the sequence, we get 0.382. Here we found Fibonacci numbers in the form, which is familiar for traders.
What CFA and EWA are
EWA is the Elliott Wave Analysis. Fibonacci retracement levels are closely connected with the Elliott Wave Theory, because Fibonacci numbers are used for assessment of the wavelength.CFA is the Comprehensive Fibonacci Analysis. It emerged as independent of Wave Analysis for global markets with high volatility. Price corrections are mainly used in the Forex market for trading by CFA. Further on, we will consider CFA instruments: Fibonacci correction, projection and extension levels. The main idea of using CFA instruments is to find a level, from which the price would reverse. The instruments are used both individually and jointly. It is very important in CFA to build any Fibonacci retracement levels correctly, that is correctly identifying beginning and end of a level.
Correction and retracement levels
Correction or retracement is a movement against an existing trend. Correction ‘eats’ a part of the trend movement. The following Fibonacci numbers are most often used for the correction levels:- 38.2% of the previous trend movement;
- 50%;
- 61.8%;
- 78.6%.
Correction levels are built by candle shadows, that is by their high and low points. You need to find a trend, first, in order to build a correction level. All traders build trend lines differently – there is more creative activity in it than a systematic approach. If you have doubts, the ZigZag pro indicator will help you to identify the upper and lower points of a trend line. Since Fibonacci retracement levels could be unsymmetrical, pay attention to where the wave, by which you build levels, starts and ends. In case the trend is descending, there is 0% in the bottom and 100% on top. And it is vice versa if the trend is ascending. If someone gets confused with sides or used to build correction levels always in one direction, the trading and analytical ATAS platform can arrange mirror reflection of levels in one click.
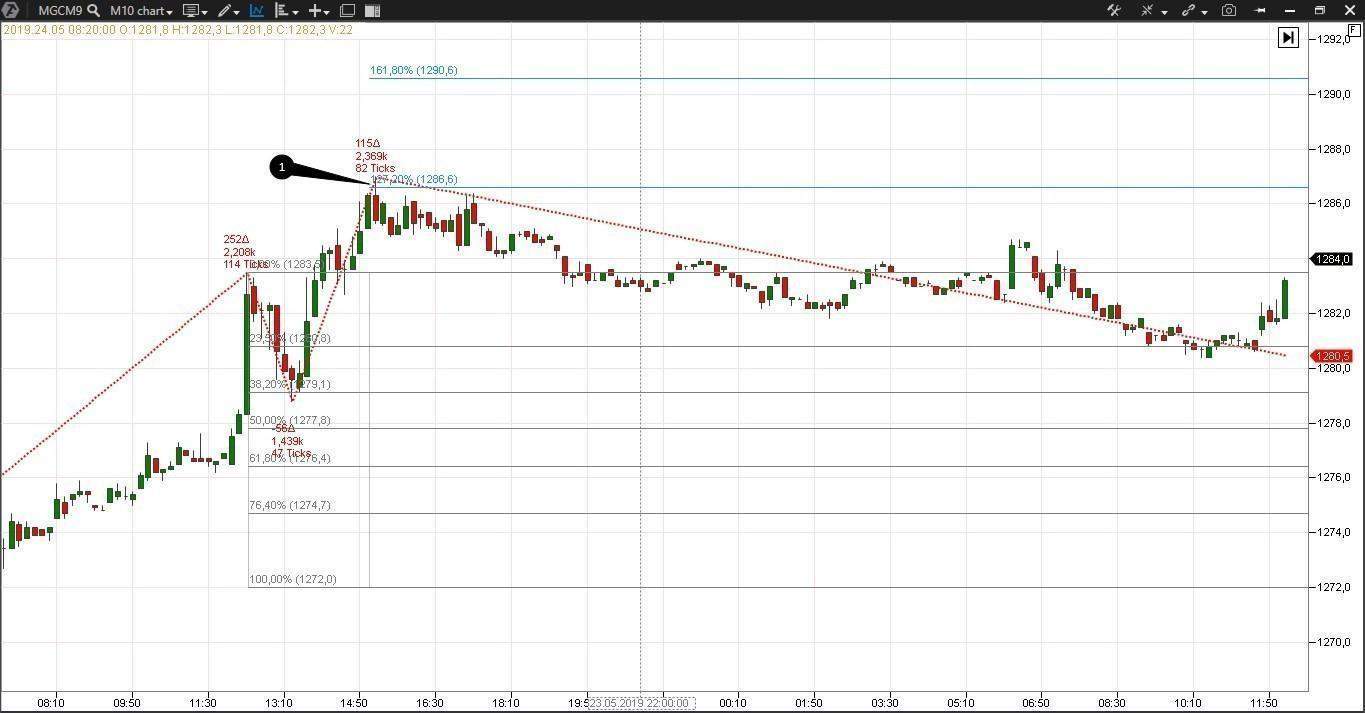
Example. Let’s build correction levels in 10-minute E-micro Gold futures (MGCM9) chart.
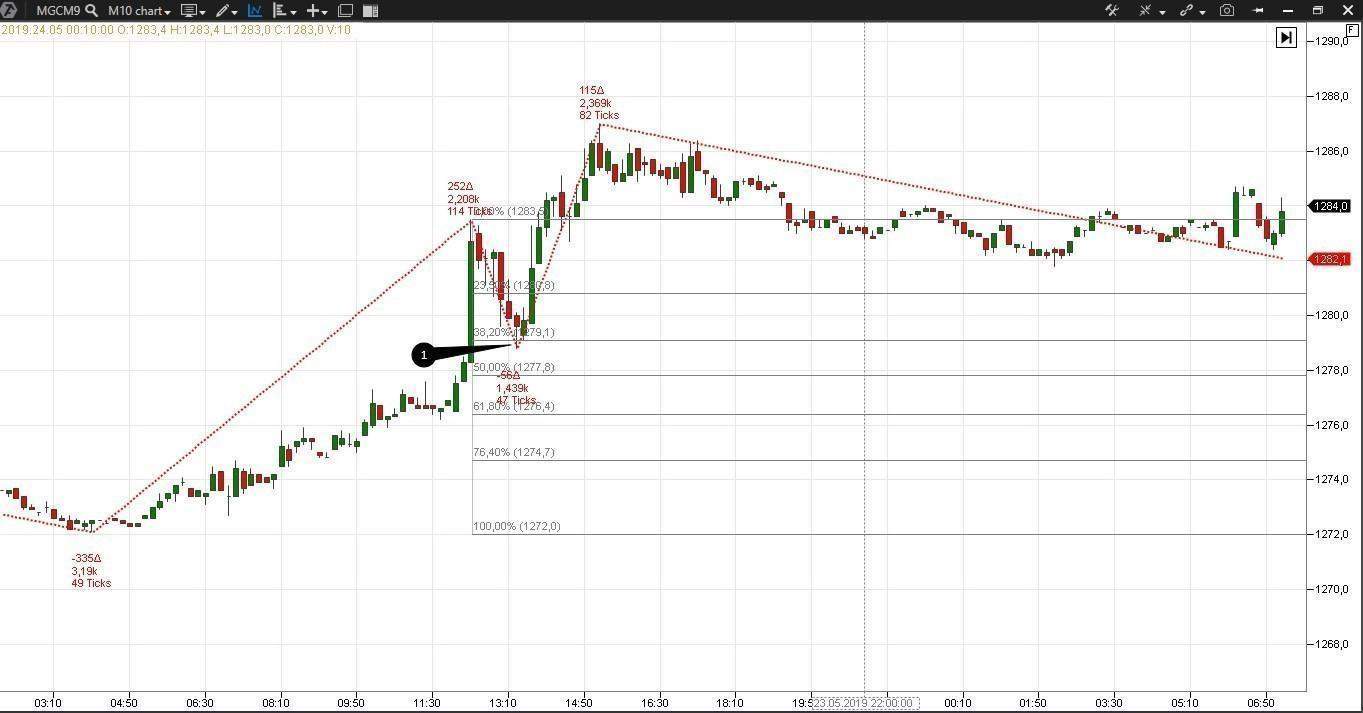
The most significant correction level is 61.8. A new trend starts, as a rule, in the opposite direction, when this level is broken, and it is necessary to build a new correction level.
Internal correction patterns
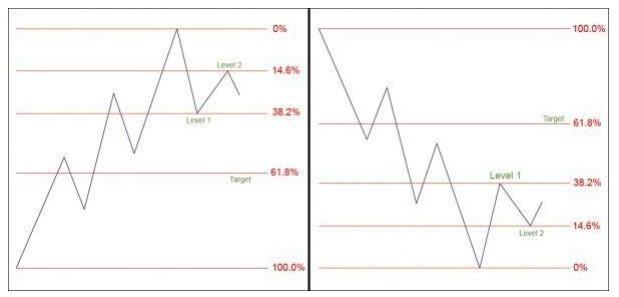
The correction pattern is a movement between insignificant correction levels, after which the price, most often, moves to the key level of 61.8. There are 4 patterns depending on namely what correction levels are touched by the price. We will not discuss all patterns in detail. We will show one example, which is called IP2 or price movement between the 38.2 and 14.6 levels. Theoretically this pattern looks as follows:
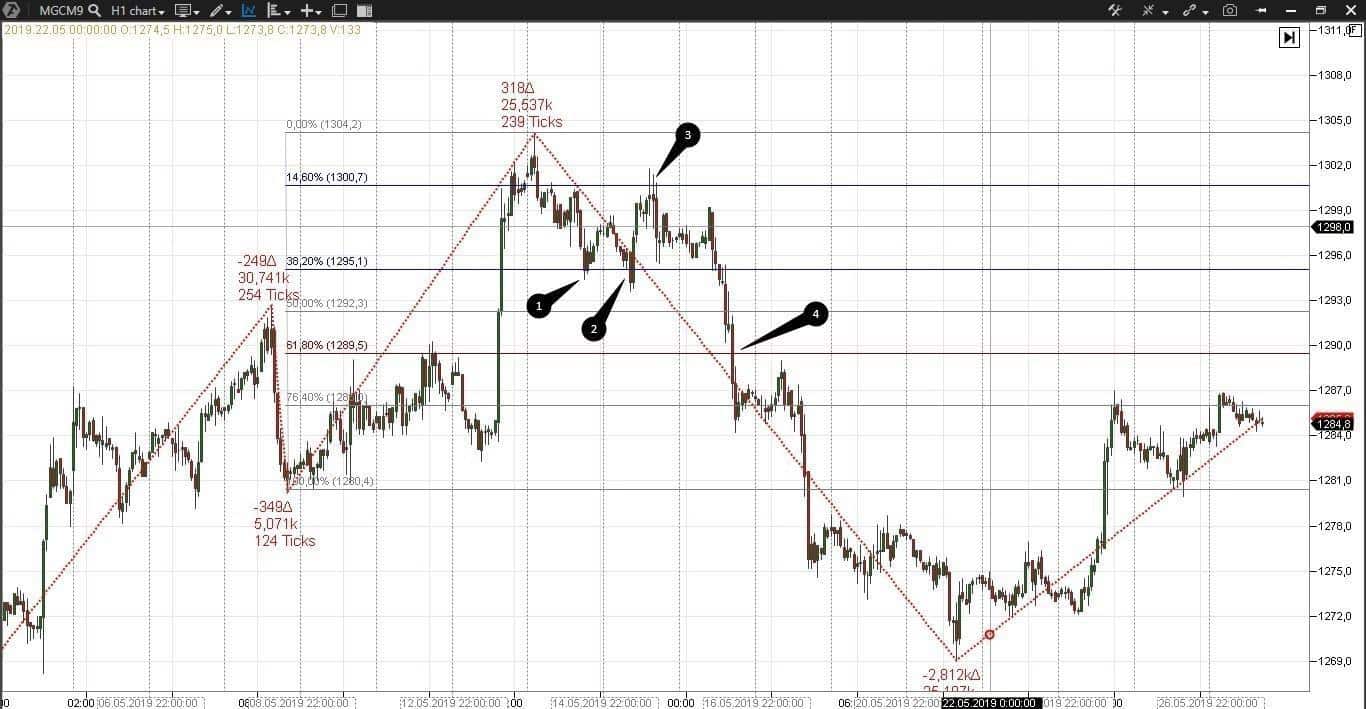
Real-life example in an hourly E-micro Gold futures (MGCM9) chart.
Extension levels
Extension is a movement towards an already existing trend.For example, here are the numbers, which are used for extensions by Derrik S. Hobbs, the author of the ‘Fibonacci for the Active Trader’ book:
- 127.2;
- 161.8.
There are two types of extensions. The first type means additional levels, where the price may reverse. The second type means the zone between additional levels, inside which the price may stop and reverse.
We added extension levels of blue colour to the correction levels in the following 10-minute E-micro Gold futures (MGCM9) chart.
Projection levels
Projection is a movement, which consists of two waves – trend and correction. Projection starts in a low or high point where the price reversed. Significant projection levels for Forex:- 61.8 – it serves as a strong support/resistance when coming back to this level after its breakout;
- 100;
- 161,8 – is one of the most significant levels, where reversals of all scales, from an hourly to monthly timeframe, take place;
- 261.8.
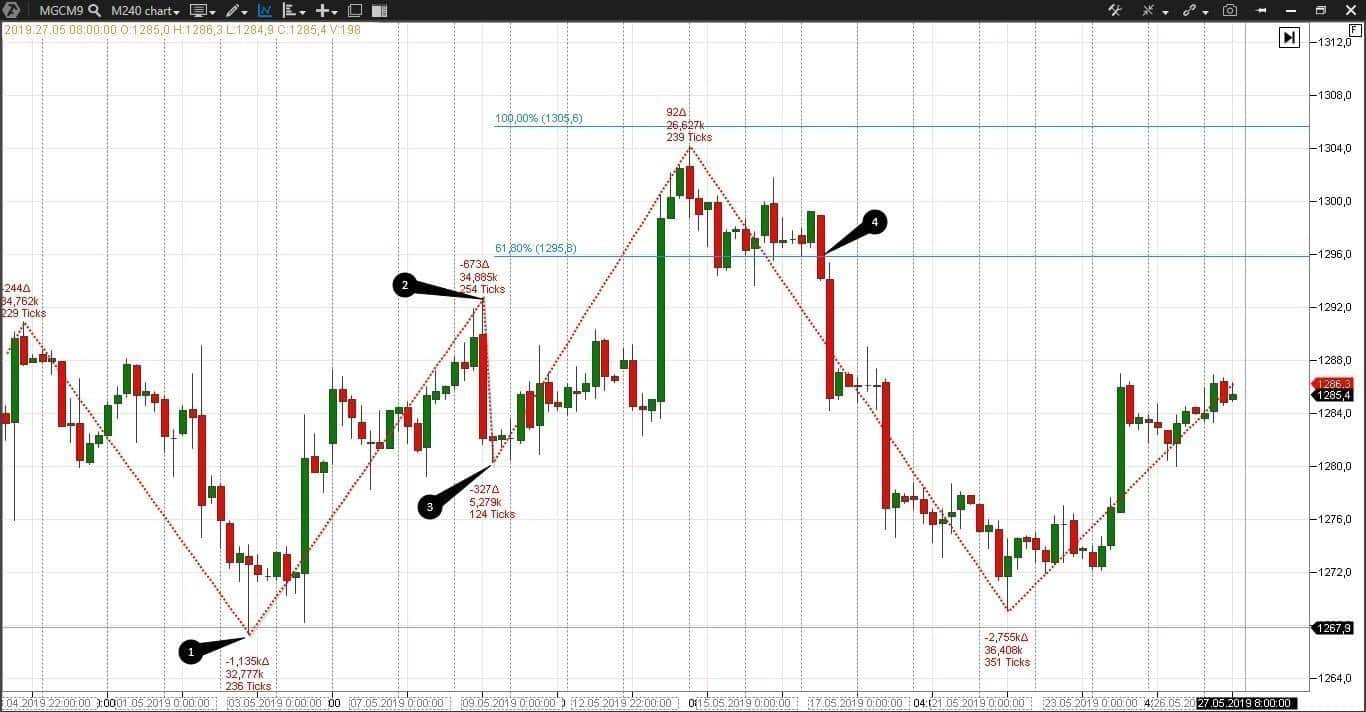
Projections could be measured in ATAS with the help of the Fibonacci Extensions instrument available in the upper menu. Example in a 4-hour E-micro Gold futures (MGCM9) chart.
Fibonacci zones
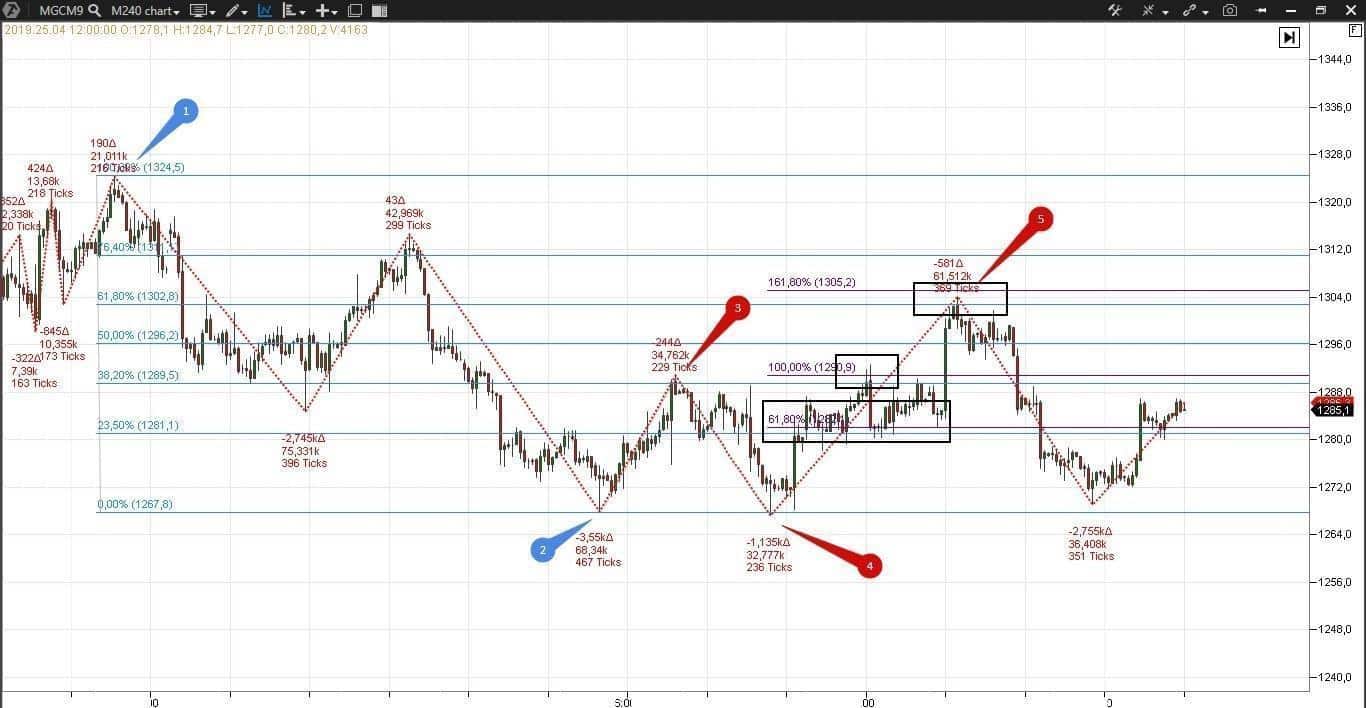
Fibonacci zones are places of accumulation of various Fibonacci retracement levels at one price level. Let’s have a look at a 4-hour E-micro Gold futures (MGCM9) chart.
Fibonacci retracement levels and footprint
Let’s have a look what advantages a trader gets when he combines footprint and Fibonacci retracement levels. Here we have again a 10-minute E-micro Gold futures (MGCM9) chart.
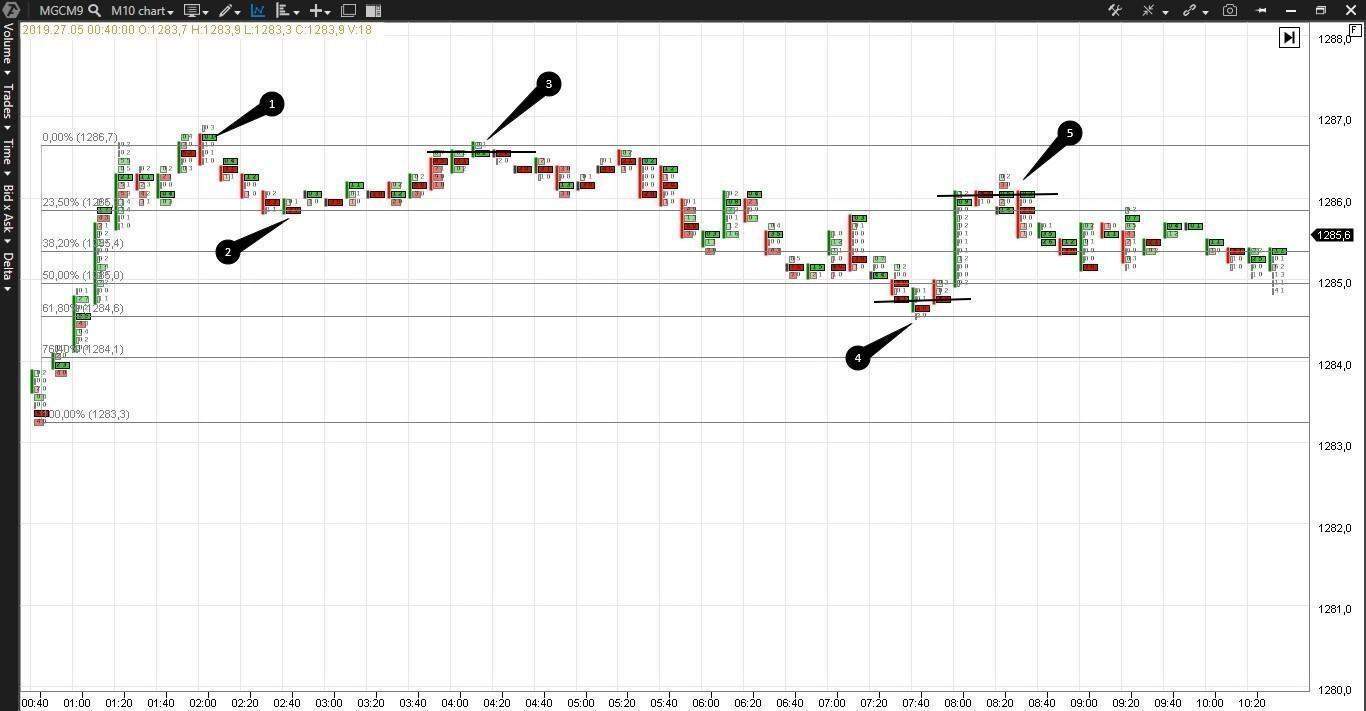
The price was corrected to the level of 23.5 in point 2 and then again went up to the level of 100.
We can see several coinciding neighbouring bars maximum volume levels, marked with a black line, in point 3. Such levels often become support/resistance levels.
The price reaches the significant level of 61.8 in point 4 and the Virgin Point of Control emerges again. We can see the level of support of coinciding POCs, marked with a black line, apart from these reversal signs.
There is a level again in point 5, but now it is a resistance level, formed by coinciding POCs. This level is a bit above the standard Fibonacci correction level. As you can see, the market activity (visible in the cluster chart) magically increases when the price enters the Fibonacci retracement level action zone. This could be used as a confirmation. For example, while using footprint, Virgin Point of Control and POC, pay more attention to analysis of volume and price at Fibonacci levels. They will add significance to your conclusions.
Let’s consider another example in an hourly E-micro Gold futures (MGCM9) chart.
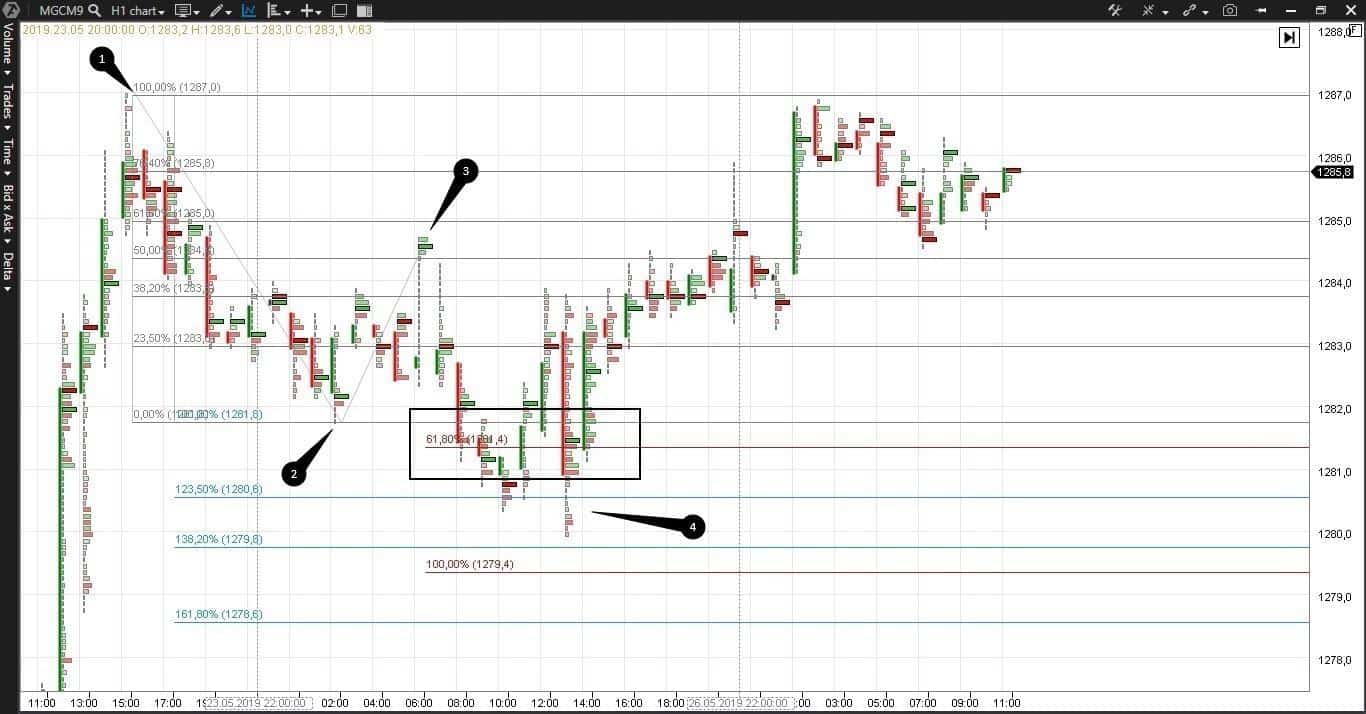
- Correction and extension levels are built by points 1 and 2;
- Projection levels are built by points 1, 2 and 3;
- Fibonacci zone at the key level of 61.8, where the price slows down and reverses, is marked with a rectangle.
We can see stuck long positions in point 3 in the cluster chart and exhaustion of sells in point 4. An experienced trader can identify by sight that the price is at the Fibonacci retracement level and decide to open a long position in the bar that goes after the point 4, when POC starts to move up.
Additional literature about CFA
If you want to trade by Fibonacci retracement levels only, we recommend to read:- Victor Pershikov ‘Comprehensive Fibonacci Analysis’;
- Robert Fischer ‘The New Fibonacci Trader’;
- Derrik S. Hobbs ‘Fibonacci for the Active Trader’.
Conclusions
Trading by levels is an integral trader’s experience.We use Fibonacci retracement levels, support/resistance levels, VAL, VAH, POC, marginal levels, unfinished auction levels and the day’s highs and lows. You can find any of these instruments and many variants of their creative combining in ATAS.
Fibonacci followers provide arguments that the market is a natural phenomenon. And since these levels are very frequent in nature (we can’t but agree with it), application of Fibonacci retracement levels in trading allows finding harmony with a developing trading structure.
We offer you to try ATAS for free and make a well-considered decision.


