Futures markets are no longer driven by price alone. Increasingly, liquidity, volatility, and intraday reactions are dictated by positioning in the options market.
Every option trade reflects an expectation about future price, volatility, or risk. When that positioning concentrates at specific strikes, it creates pressure that market makers must hedge. That hedging activity flows directly into futures. The result is straightforward:
💡 Options positioning influences how futures move, where they react, and how volatility unfolds.
The ATAS integration with MenthorQ brings this hidden layer of market directly onto your charts, turning invisible positioning into visible trading levels.
This article was contributed by MenthorQ — a quantitative analytics platform specializing in options positioning, volatility, and derivatives-based analysis for futures traders. Explore MenthorQ and other professional tools in the ATAS Marketplace
From Dealer Hedging to Real Price Movement
Market makers are firms (usually banks or large trading firms) whose job is to provide liquidity, they are constantly buying and selling options so that traders can enter and exit positions easily.
They’re not trying to predict where the market is going. Instead, their goal is to stay balanced and manage risk.
When they sell options to traders, they take on exposure. To manage that, they hedge using futures:
- If the market goes up, they often need to buy
- If the market goes down, they often need to sell
This creates a real mechanical flow in the market. It becomes especially important around key option levels and in high gamma environments, where even small moves can force them to react quickly. That’s why you sometimes see the market suddenly accelerate into a level, reverse sharply, or shift from calm to volatile.
It’s not random, a lot of it comes from how positions are set up in the options market and how market makers are forced to hedge them.
Options Gamma Explained: The Force Behind Dealer Behavior
Gamma measures how quickly a market maker’s exposure changes as price moves — specifically, the rate at which their net directional position shifts with each tick. For market makers running large options books, this is the number that determines how aggressively they must trade futures at any given moment. The aggregate expression of this sensitivity across all strikes and expirations is Gamma Exposure (GEX) — a metric that shows how many futures contracts dealers would collectively need to buy or sell in response to a 1% price move. Where GEX concentrations are largest, mechanical hedging flows are most intense.
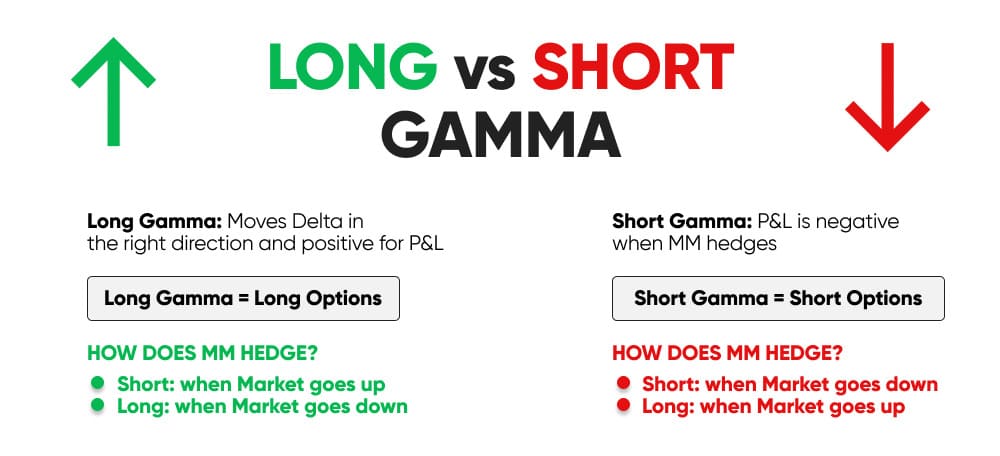
To manage that risk, market makers practice delta-neutral hedging — continuously adjusting their futures positions to offset the directional exposure from their options books. The goal of delta hedging is to stay balanced regardless of which way the market moves. But in a high-gamma environment, that balance breaks down almost immediately after each price move. Dealers must rehedge constantly and aggressively: buying into rising prices, selling into falling ones — not from conviction, but from mechanical necessity. This is the flow that moves futures markets from the inside.
Start now!
Try ATAS free with no time limit
When gamma concentrates heavily at a specific strike — as it often does at major Call Resistance or Put Support levels — dealer rehedging begins to act like a gravitational force. This effect is known as gamma pinning, sometimes called sticky strikes: hedging activity continuously pulls price back toward a high-gamma level rather than allowing it to break away cleanly. For a futures trader watching price chop around a key level for hours, gamma pinning is often the structural explanation.
This dynamic produces two fundamentally different market environments — long gamma and short gamma — each demanding a different approach from any trader operating in futures. How those states are measured, and where exactly the boundary between them sits, is what the GEX framework makes visible. More on that below.
Options volumes have grown significantly over the past several years, and 0DTE contracts — with their extreme gamma sensitivity — now dominate intraday flow. When large 0DTE exposure concentrates near a single strike, the gamma flip can shift within a single session, turning a stable, range-bound morning into a fast-trending afternoon. Understanding where it sits is increasingly central to reading intraday futures behavior.
Turning Complex Option Data Into Clear Price Levels
Today’s challenge is not access to data. It is an interpretation. Option chains are complex, with thousands of strikes and constantly shifting exposures. For most traders, this makes the data difficult to use in real time. MenthorQ and ATAS solve this by translating option positioning into clear, actionable price levels designed specifically for futures traders.
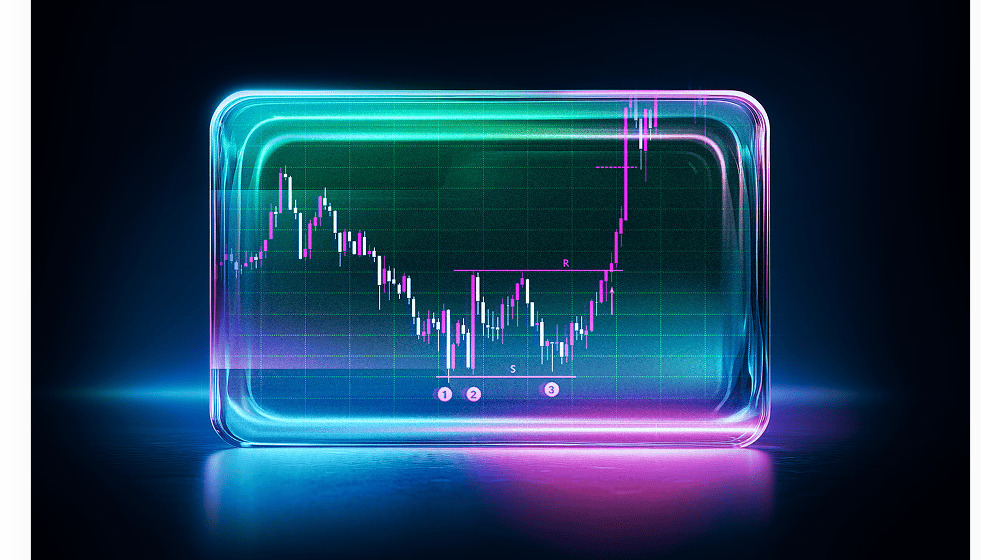
By analyzing the option chain, now traders can obtain Key levels that can be used for futures traders to act directionally. These levels include:
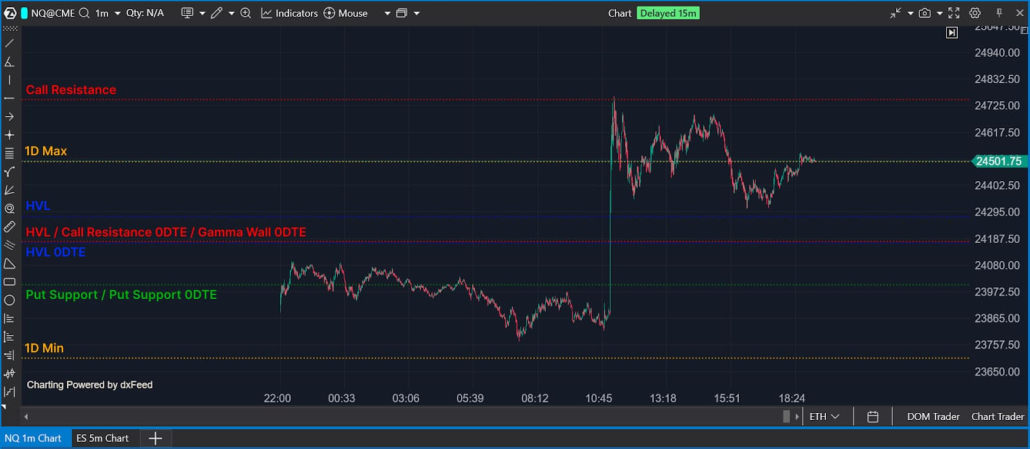
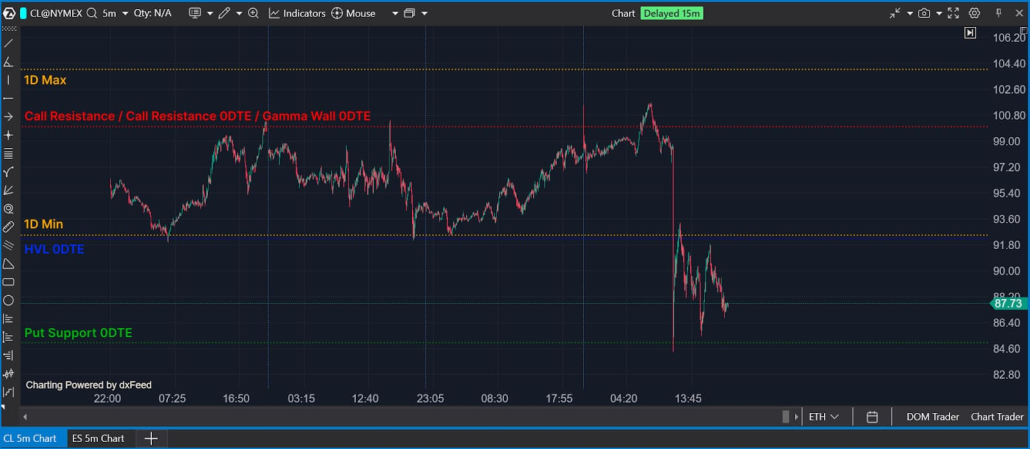
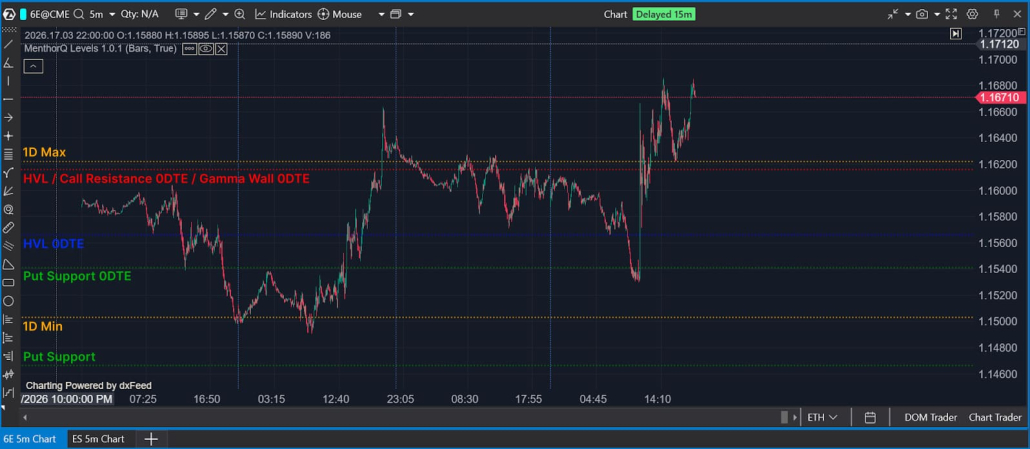
- Call Resistance – where upside hedging pressure is concentrated. Price tends to stall at those levels and bounce lower.
- Put Support – where downside support is strongest, this level acts as a strong support and price tends to react higher.
- High Volatility Level – the boundary between stable and unstable market regimes. Once a spot moves above or below we change intraday volatility. For futures traders this is important not only for direction but also to risk manage and position size.
These are not technical levels based on past price action. They are structural levels based on live positioning and hedging risk taken from the option chain. When price approaches these zones, dealer behavior changes, and that is where meaningful reactions often occur.
Example: Price reacting precisely at a Call Resistance level as dealer hedging caps upside movement.
The Power of 0DTE and Intraday Flows
Modern markets are increasingly driven by short-dated options. 0DTE contracts carry extremely high gamma, meaning dealer hedging becomes highly sensitive to even small price changes. This creates:
- Intraday magnets
- Sharp rejection points
- Fast breakout conditions
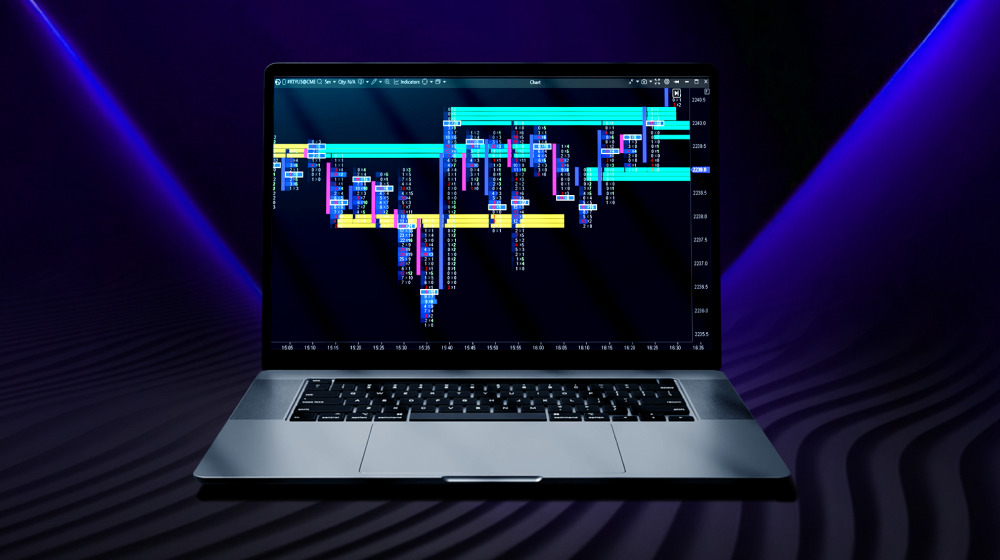
Via ATAS you can track these flows and convert them into precise intraday levels, giving you additional context to analyse potential reactions as they show up on the chart.
Example: Intraday reversal forming at a 0DTE level with immediate order flow confirmation.
0DTE options are not a strategy in themselves — they are a signal. Traders who buy or sell 0DTE contracts are expressing strong short-term directional views, and the sheer volume of that activity creates mechanical pressure that moves futures prices. For a futures trader, the edge is not in trading the options themselves, but in reading where that pressure is concentrated. When a 0DTE level appears on your ATAS chart, it tells you where dealer hedging is most sensitive today — not what position to take in the options market. This distinction is what makes the integration practical: you get the informational benefit of options flow without needing to operate in the options market at all.
Understanding Gamma Regimes Changes Everything
One of the most overlooked edges in futures trading is regime awareness. Not all markets behave the same, yet many traders apply identical strategies regardless of conditions.
Option data changes that. Understanding these regimes is very important today more than ever because options volumes are constantly growing and not understanding them will put you at a disadvantage.
- In positive gamma, markets tend to be stable, rotational, and mean-reverting
- In negative gamma, markets become unstable, directional, and prone to expansion
The High Volatility Level acts as the dividing line between these regimes. Knowing which environment you are trading in allows you to:
- Adjust position sizing
- Change stop placement
- Shift between range-based and breakout strategies
Example: Breakout acceleration after price crosses the High Volatility Level into negative gamma.
Gamma Exposure Trading: Using GEX to Read Market Structure
Gamma Exposure — or GEX — is the metric that bridges the abstract mechanics of gamma and the concrete levels you see on your ATAS chart. It aggregates the net gamma position held by market makers across all strikes and expirations, and expresses the scale of their dealer positioning in quantifiable terms: specifically, how many futures contracts they would need to buy or sell in response to a 1% price move. Where Net GEX is largest, mechanical hedging flows are most intense — and that is precisely where MenthorQ places its levels inside ATAS.
That Net GEX reading defines the volatility regime you are operating in. When it is positive, dealer flows stabilize the market — they buy weakness and sell strength to stay neutral, compressing realized volatility and creating conditions where range-based and mean-reversion approaches tend to work well. When Net GEX turns negative, the same flows become an amplifier: dealers must now chase moves rather than fade them, options flow reinforces direction, and breakouts gain mechanical follow-through. Knowing which volatility regime is active before you place a trade changes how you size, where you stop, and which setups you prioritise.
The dividing line between these two states is the gamma flip — also called the zero gamma level — the price at which Net GEX crosses from positive to negative. This is the same level that MenthorQ surfaces as the High Volatility Level inside ATAS. Above the gamma flip, stabilising flows dominate. Below it, amplifying flows take over. Mapping this level directly onto your chart gives you a structural anchor that standard technical analysis cannot provide: you are not reading where price has reacted in the past, but where dealer positioning is actively shifting right now.
This is where market structure trading with GEX becomes practical. When price approaches a Call Resistance level — a call wall — with a large positive GEX reading above it, dealer hedging pressure is working against upside continuation, and traders can evaluate fade setups with risk defined tightly above the zone. When price breaks below a Put Support level — a put wall — into negative GEX territory, the mechanical cushion that was absorbing downside is gone; options flow may now reinforce the move rather than resist it. A gamma wall of either kind is not a guarantee of outcome. It is a map of where dealer mechanics are most active — and that context sharpens how you read order flow confirmation in ATAS.
One final distinction worth understanding: open interest shows where positions were built, not how dealers are hedged right now. Dealer positioning adjusts continuously as price moves, and those intraday hedge corrections never appear in yesterday’s open interest data. GEX captures that live sensitivity — accounting for how gamma exposure shifts across the session as price moves closer to or further from key strikes. Open interest does not. For a futures trader making intraday decisions, that difference is the informational edge.
Institutional Trading Levels, Delivered Directly Into ATAS
ATAS is a professional analytical platform for order flow and volume analysis. By integrating MenthorQ, it gains a critical missing layer: options-driven context. Unlike support and resistance levels derived from price history, institutional trading levels are built on live positioning data — they reflect where the largest market participants are actually hedged right now, not where price happened to react in the past.
Through direct API integration, traders can plot:
- Gamma levels
- Blind spot levels
- Expected move ranges
- 0DTE positioning
All levels update automatically and integrate seamlessly with:
- Footprint charts
- Delta and volume analysis
- Market profile and liquidity tools
This allows traders to move beyond simply observing price and begin understanding the forces behind it.
A Typical Trade Using ATAS + MenthorQ
Let’s take a typical price action using key levels. Price approaches a known Call Resistance level derived from option positioning. As it reaches that zone, order flow begins to slow, and aggressive buyers struggle to push higher. At the same time, footprint data shows absorption, confirming that liquidity is sitting at that level.
Instead of guessing, the trader now has alignment:
- Key Levels from forward looking option chain
- Real-time confirmation from order flow
The trade becomes clearer. Risk can be defined tightly above the level, and the reaction is grounded in positioning, not intuition. You have now connected where price is likely to react with how it is reacting in real time. This is where the MenthorQ ATAS integration becomes powerful.
Conclusion
Futures markets have evolved. Options are no longer a secondary input. They are a primary driver of liquidity, volatility, and price behavior. Trading without this information means operating without visibility into the forces moving the market.
MenthorQ transforms complex option data into clear, actionable levels and brings them directly into ATAS, giving traders access to institutional-grade insight. The result is a more informed, more adaptive approach to trading. One built on positioning, flow, and market mechanics rather than hindsight and pattern recognition.
Information in this article cannot be perceived as a call for investing or buying/selling of any asset on the exchange. All situations, discussed in the article, are provided with the purpose of getting acquainted with the functionality and advantages of the ATAS platform.
Subscribe
Get the latest ATAS news delivered conveniently