- Instruction. How to set up alerts
- Blog articles with the Indicators tag
Bar’s Volume Filter indicator
The Bar’s Volume Filter indicator highlights (the default colour is orange) a candle in the chart when the volume / delta / number of trades in this candle reaches the set value.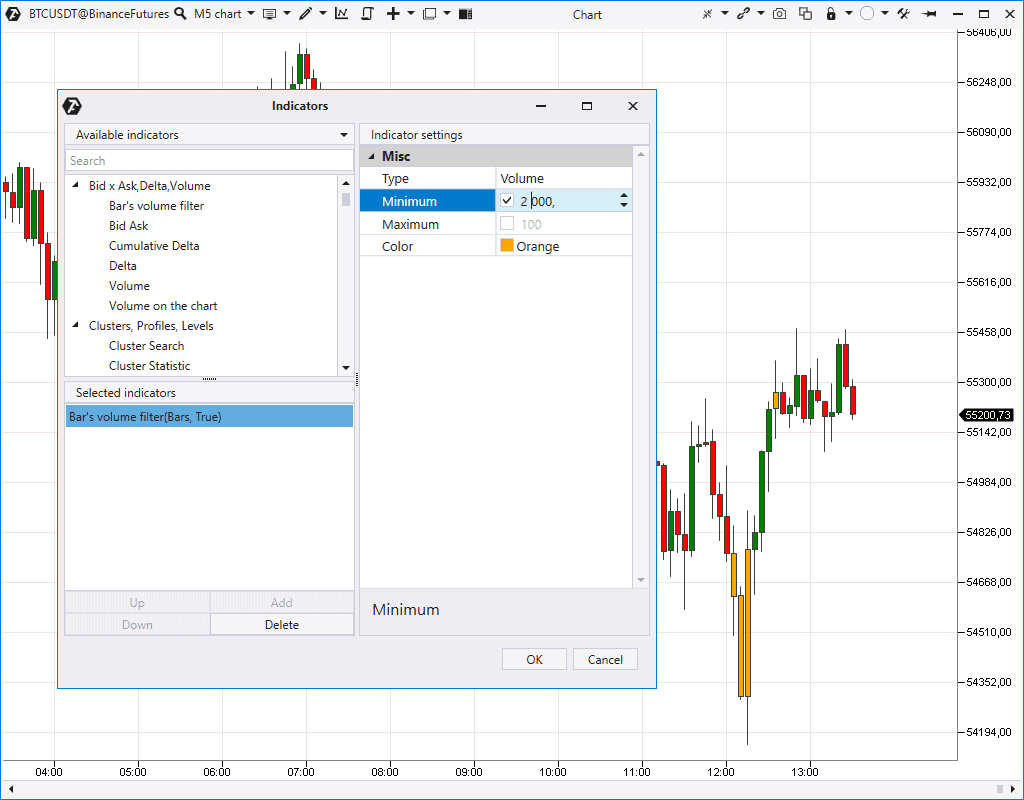
Bid Ask indicator
Bid Ask indicator shows market buy and sell trades separately in the form of a two-sided histogram.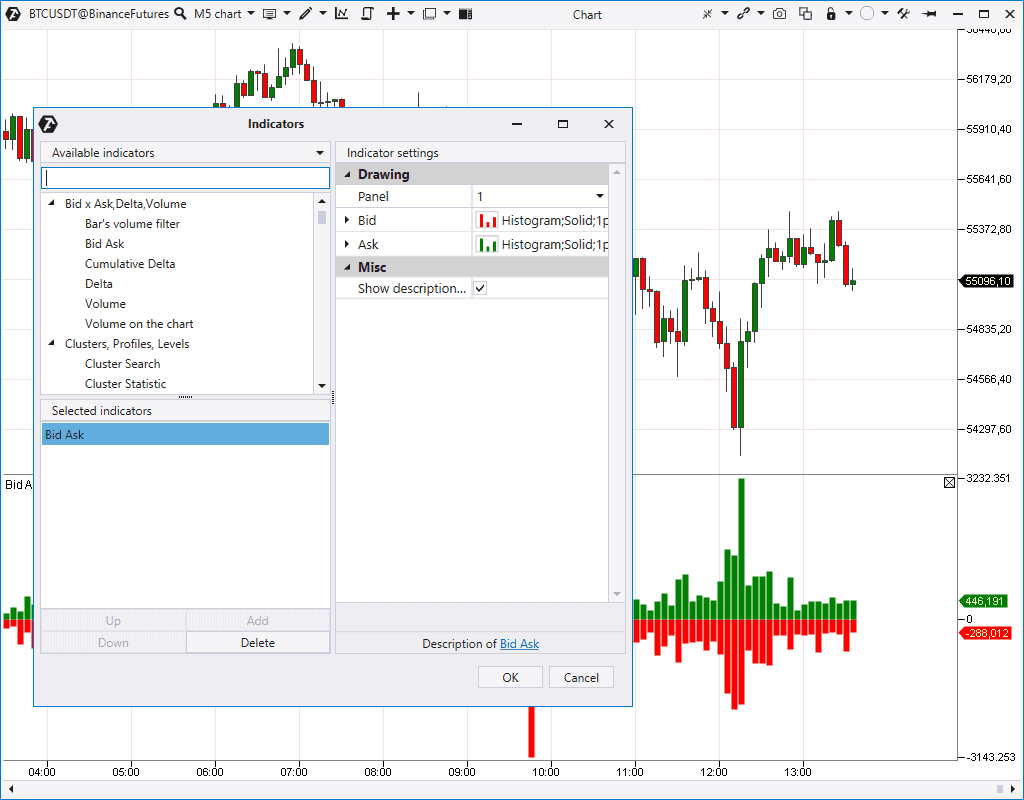
Volume indicator
The Volume indicator shows the total volume (real or tick one) in every candle in the form of a vertical histogram under the price chart. It is the basic and, perhaps, the most popular volume analysis indicator.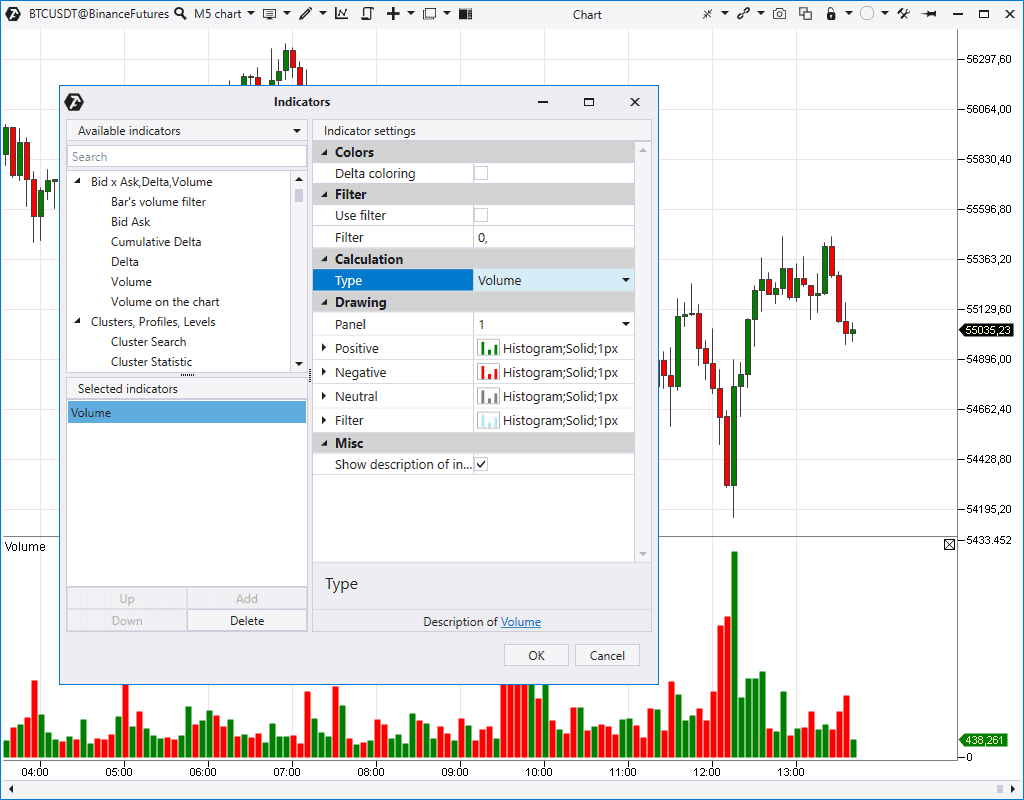
- by the bearish or bullish candle;
- or by the candlestick Delta (Delta Coloring). The positive Delta is green and the negative Delta is red.
- Volume analysis advantages
- Vertical volume analysis. Wyckoff methods
- 5 methods of exchange volume analysis
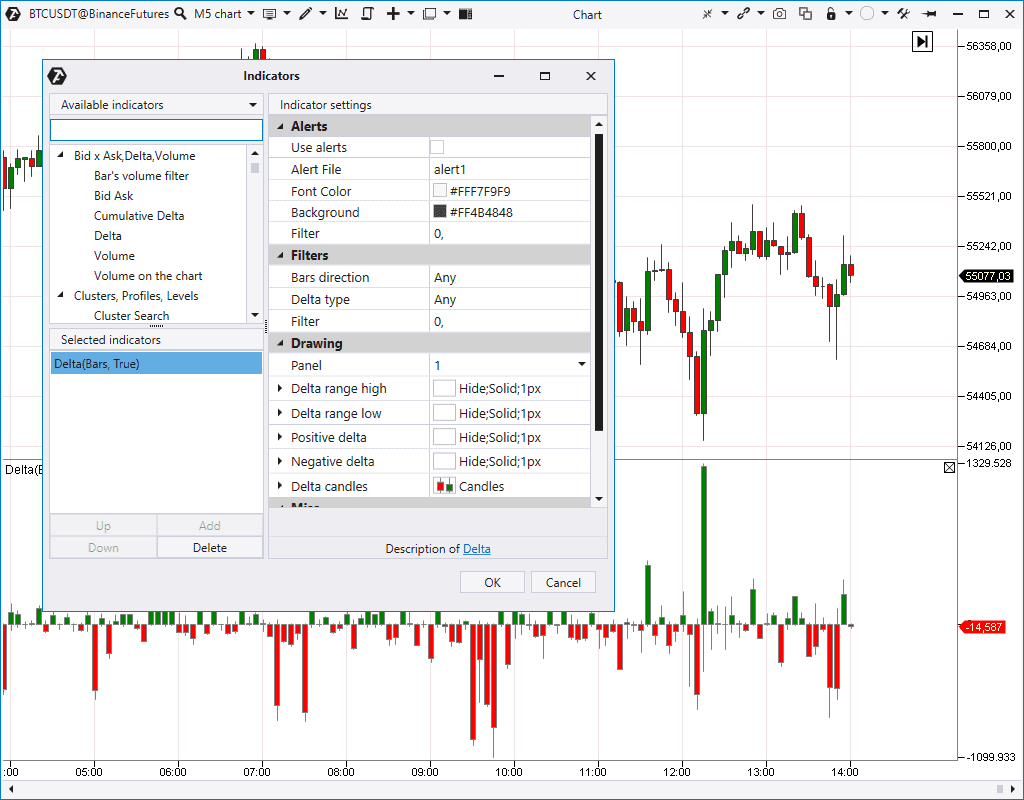
Delta indicator
The Delta indicator shows predominance of market buyers over sellers or vice versa. The indicator settings give you a possibility to:- Transform the histogram into the unidirectional state.
- Change the histogram display mode.
- Set the search for the positive / negative Delta in bullish or bearish candles separately – for example, the positive Delta in bearish candles or negative Delta in all candles in a row…
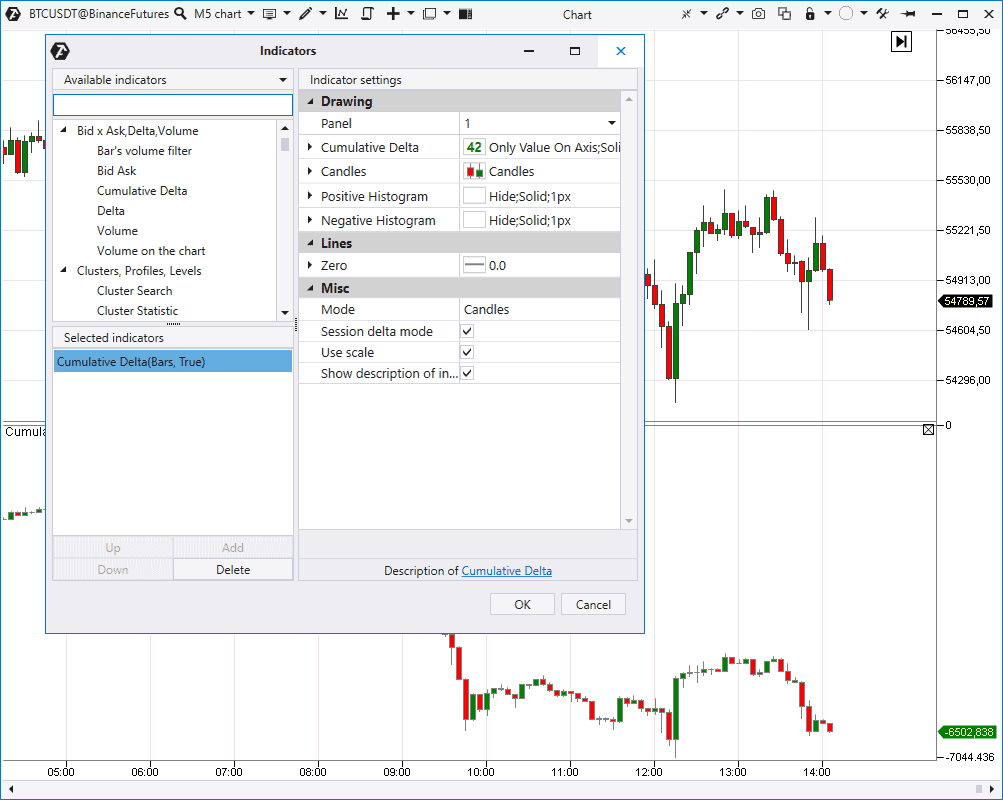
Cumulative Delta indicator
Cumulative Delta contains ‘combined candles’ of the Delta. It means that it shows the Delta change in dynamics, every next value takes into account the sum of previous values, which is reflected in the indicator name. Cumulative Delta could be:- The session one – it is reset at the beginning of every new session.
- Continuous.
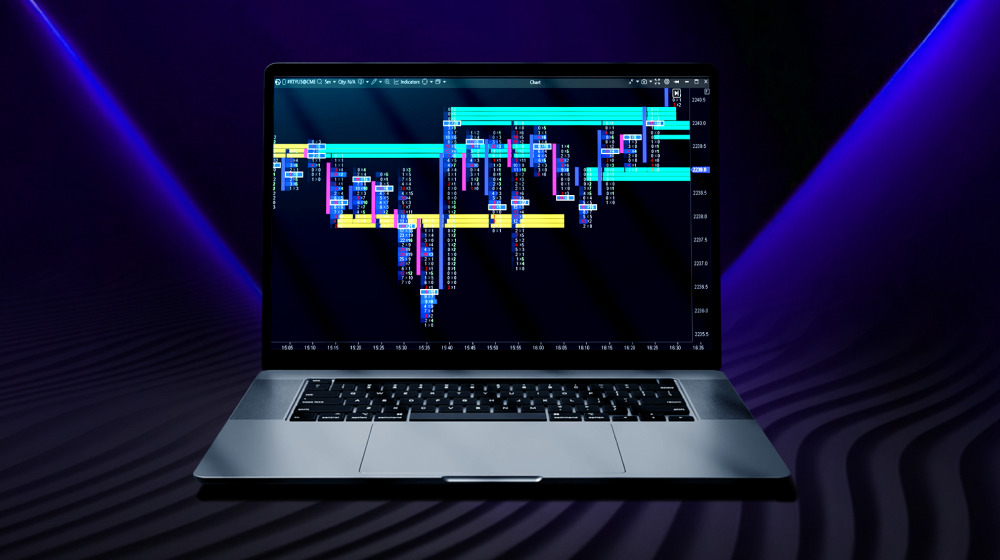
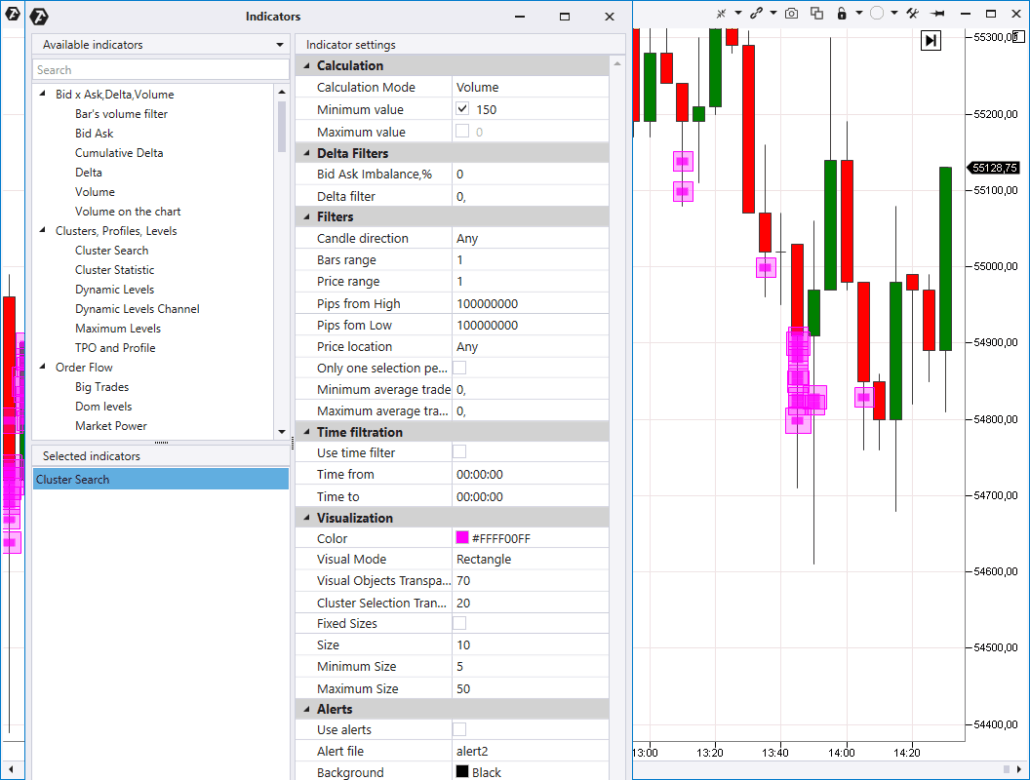
Cluster Search indicator
Cluster Search is one of the most powerful indicators in the platform. It provides a possibility to:- look for clusters in the volume, delta, time, trade and other modes;
- set percentage predominance between clusters by Bids and Asks;
- set a filter by the Delta;
- look for clusters in certain places of a candle;
- look for clusters in specific candles, for example, bearish or bullish.
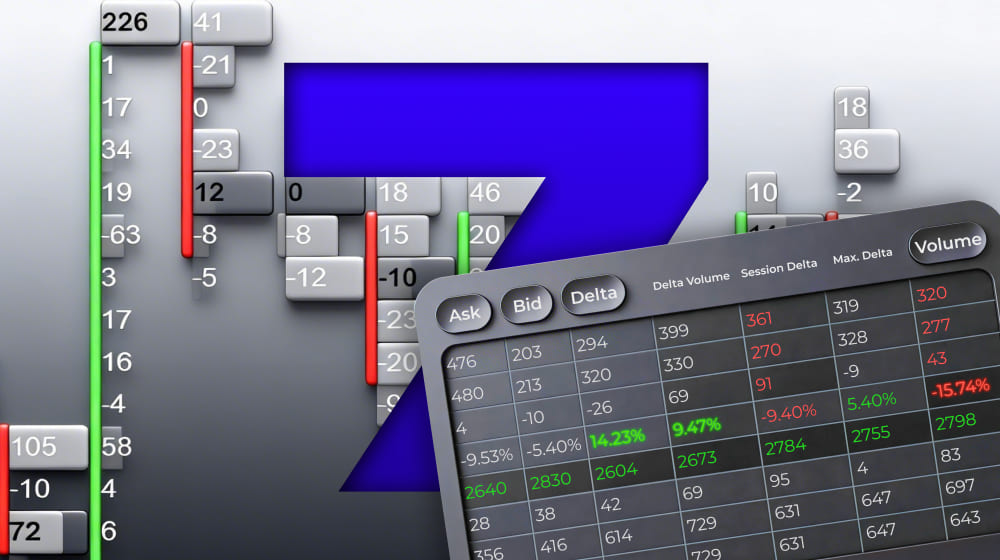
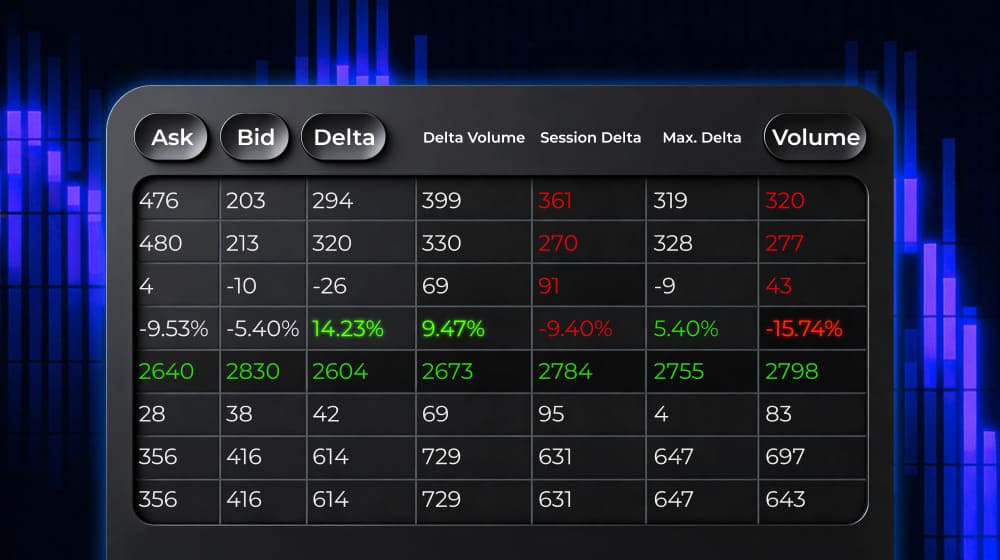
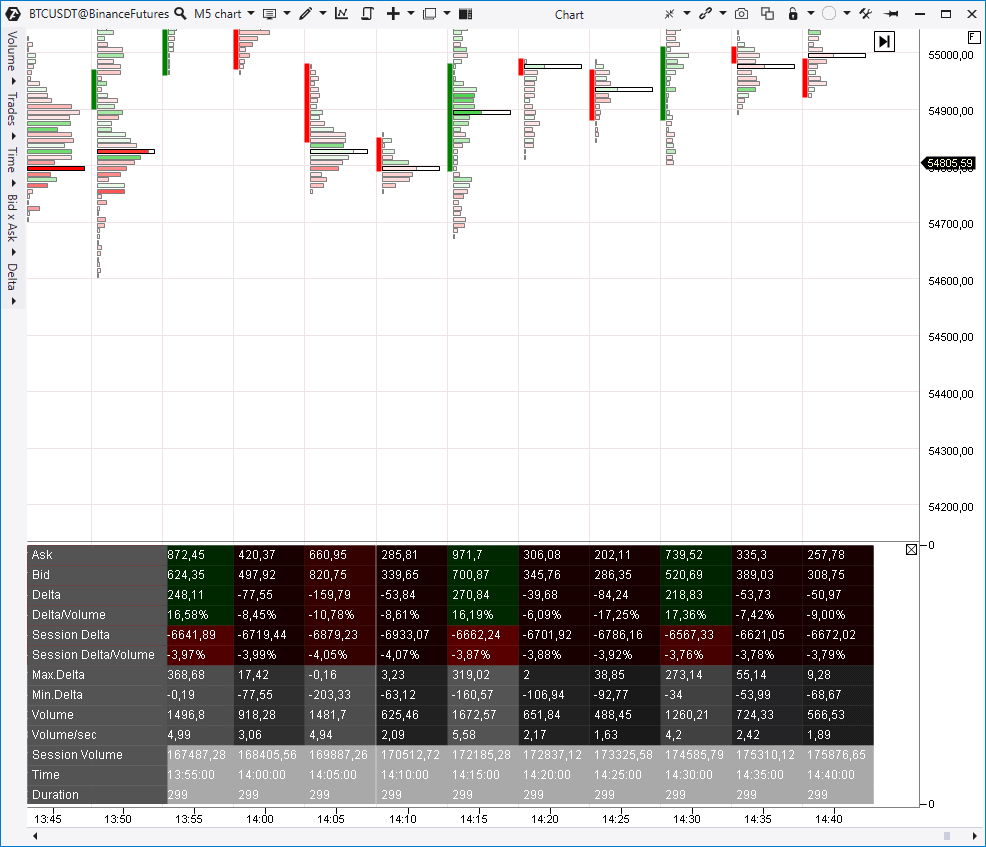
Cluster Statistic indicator
The Cluster Statistic indicator provides statistical information about every candle, for example:- session volume in percentage and in contracts;
- Bid and Ask separately;
- session Delta;
- maximum and minimum Delta and so on.
TPO and Profile indicator
TPO and Profile is a universal instrument, which combines:- volume profile with advanced settings;
- classical market profile.
- only the volume profile;
- only TPO;
- TPO and volume profile simultaneously (see the screenshot below);
- laying the profile over TPO.
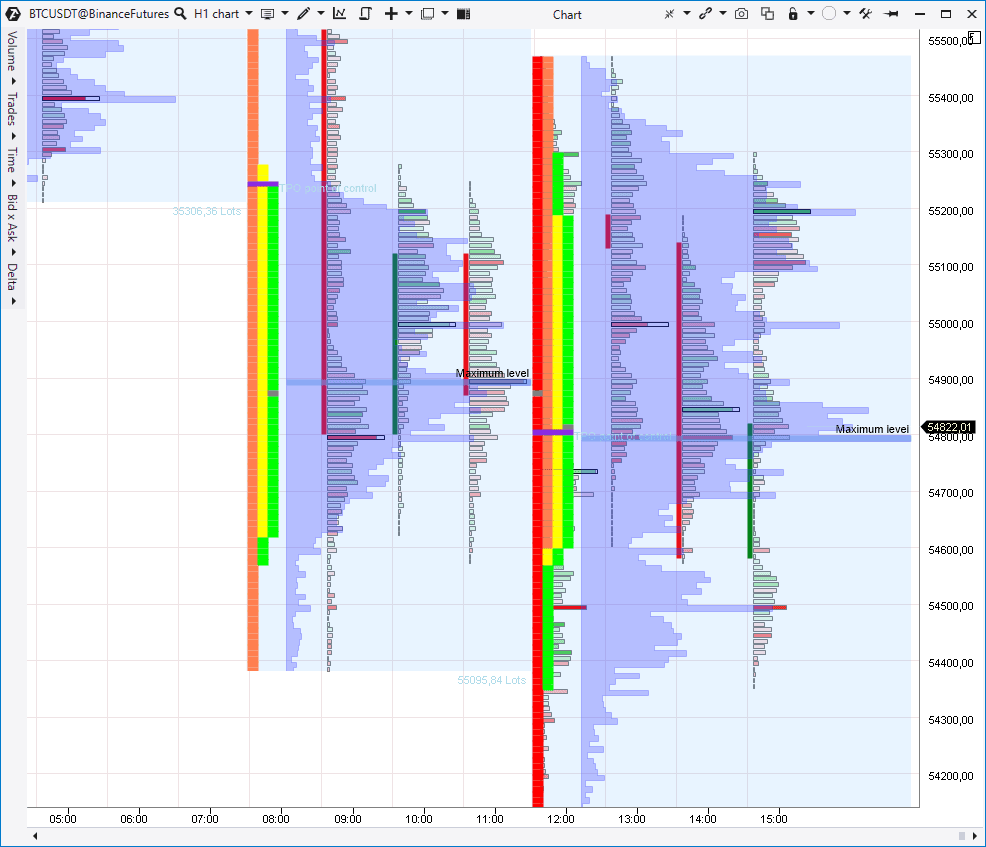
- change the profile type (for example, by Delta, Volume, Time and other criteria);
- specify the maximum level mode;
- activate the Value Area.
- Value Area;
- Initial Balance;
- additional filters.
- Indicator description in the Knowledge Base
- How the profile indicator works
- How to trade by TPO charts
- How to use the Market Profile
- How to use the Horizontal Volume
Dynamic Levels indicator
This Volume Profile derivative indicator reflects dynamic change of the VAH, VAL and POC levels in the chart. There are various types of settings, for example, Delta, Time, trades and so on. You can consider channel building within an hour, day or week.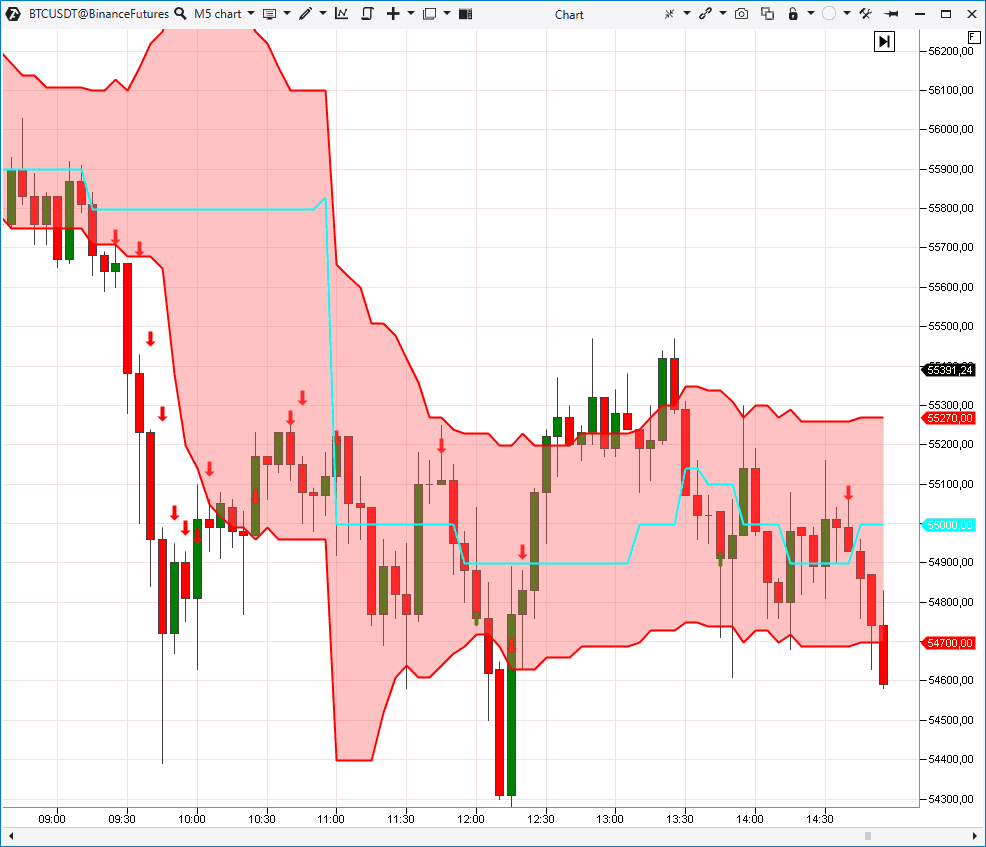
- Application of the Dynamic Levels indicator
- Analysis of levels with the Dynamic Levels indicator
- Dynamic Levels in the Knowledge Base
Maximum Levels indicator
This indicator marks levels with the maximum Volume, Delta, Time, trades and so forth on the price scale. You can look for maximum levels in various periods: for the current/previous day, week, month and also for the whole contract. It is a simple but rather useful indicator if you focus on strong volume levels in trading and analysis.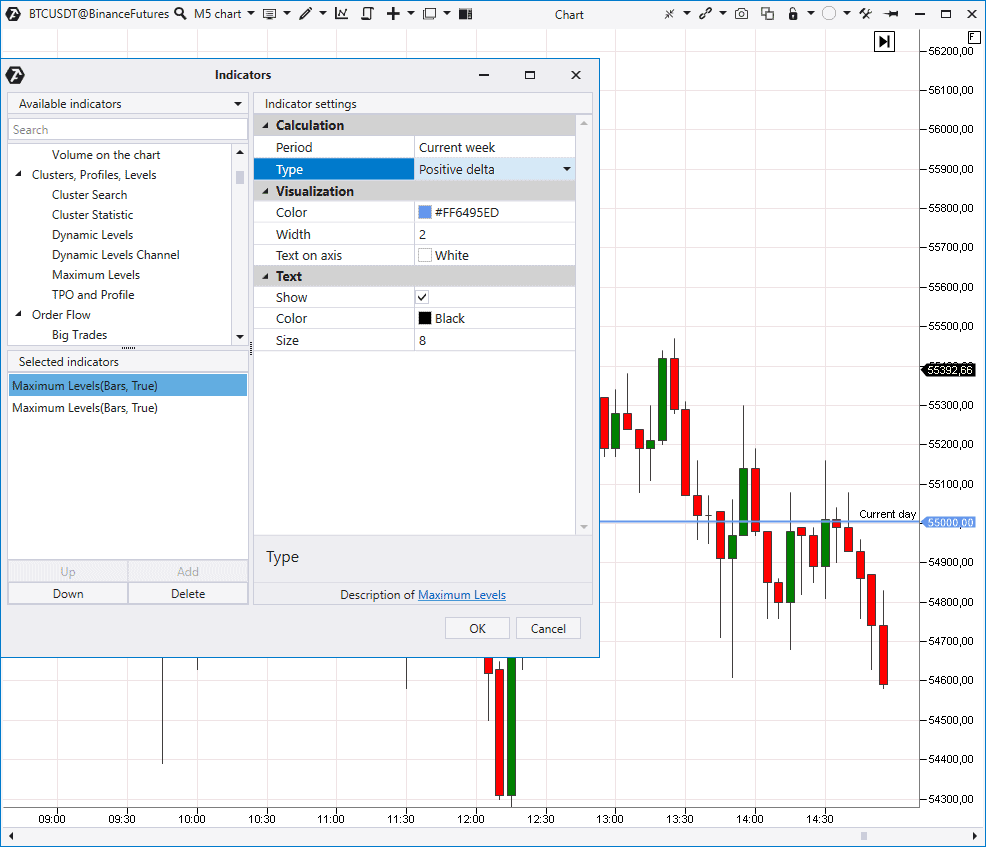
Big Trades indicator
It ‘pulls out’ trades from the tape and shows these places in the chart. You can look for single or aggregated prints (trades). Aggregation (combining single trades into one print) is carried out in accordance with ATAS algorithms, which are not disclosed. An autofilter, which will independently select the volume level for displaying the biggest trades, is turned on by default. If you turn the autofilter off, you can set the trade volume value by yourself.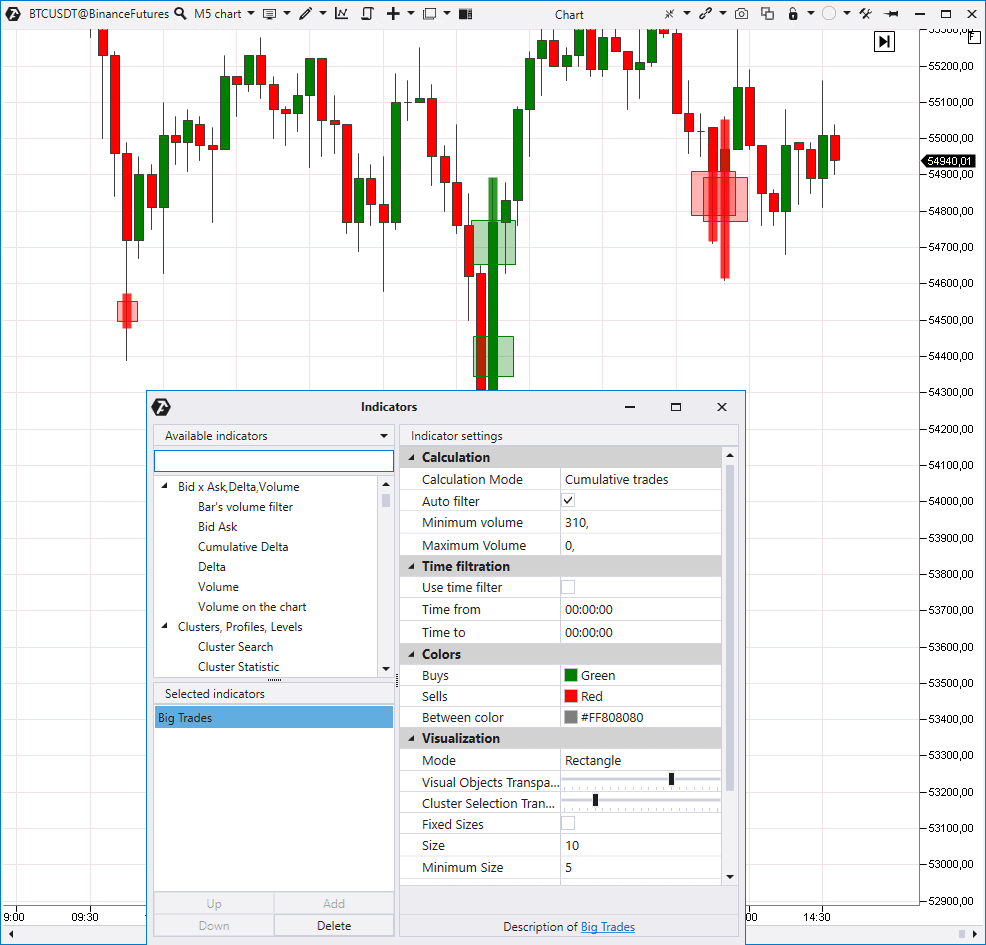
Multi Market powers and Market power indicators
The next indicators for analysis of trades from the Time & Sales are Multi Market Powers (on top) and Market Power (in the bottom).
- there was growth, which means predominance of aggressive buys;
- there was reduction, which means predominance of aggressive sellers.
Order flow indicator
Now we proceed to the Order Flow indicator, which visualizes trades from the Time & Sales.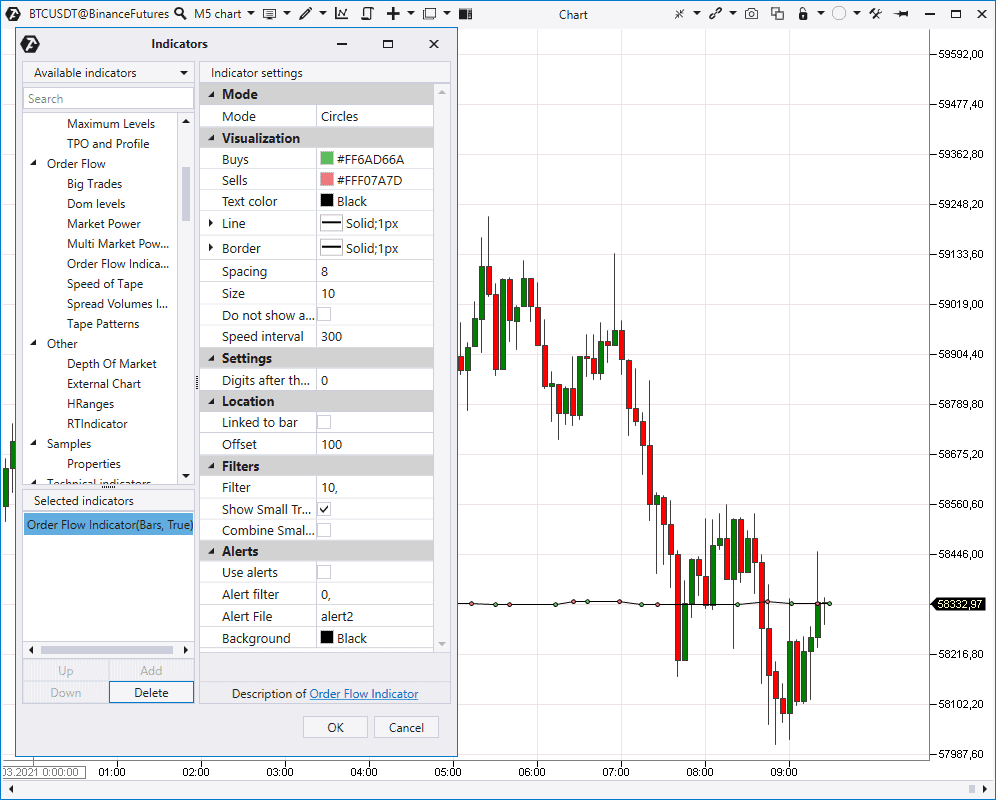
- Order Flow Indicator in the Knowledge Base
- Advice to novices on reading the order flow
- Searching for managed money with the Order Flow indicator
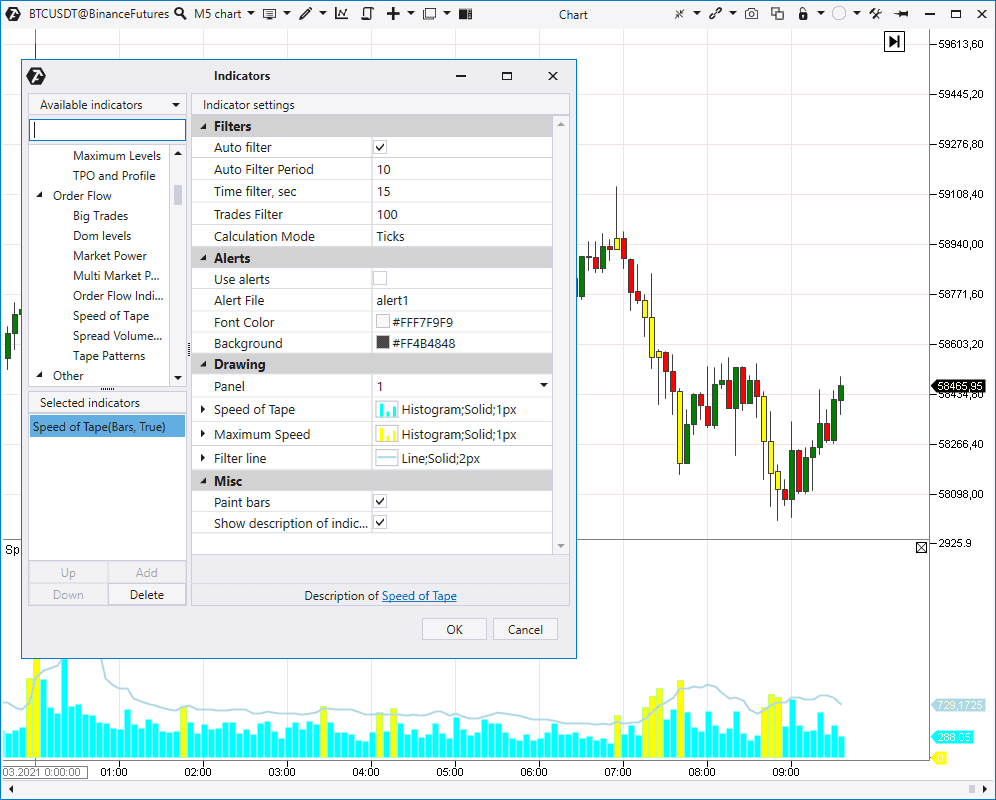
Speed of Tape indicator
Now we move to the Speed of Tape indicator. It changes the Time & Sales speed:- separately by the trades on selling and buying;
- or in general by the trade execution speed (shown in the screenshot).
- Speed Of Tape in the Knowledge Base
- Market analysis with the Speed Of Tape indicator
- Searching for levels with the Speed Of Tape indicator
Spread Volumes indicator
Spread Volumes Indicator shows market buy and sell trades in the chart.
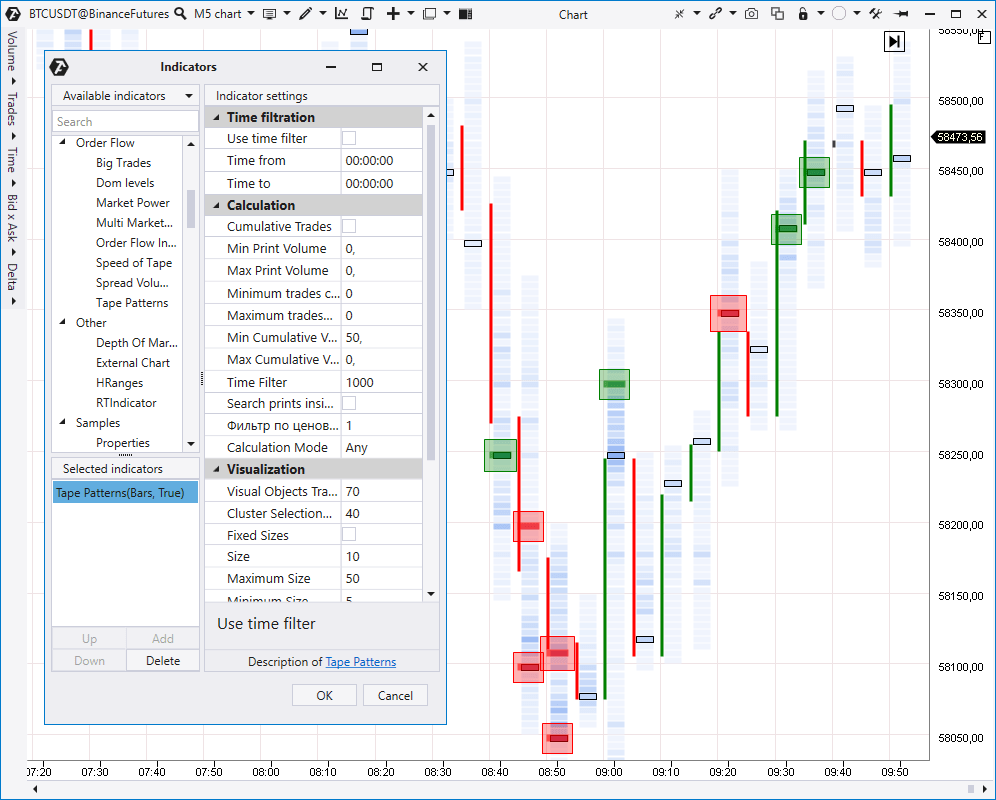
Tape Patterns indicator
Tape Patterns is an indicator with a big number of Time & Sales filters. You can use it to:- analyse aggregated or fragmented trades;
- set filters by maximum and minimum values of the tick volume, number of trades and total volume;
- carry out search inside a time range, for example, inside 1 second and by the tick range. All found patterns will be visually highlighted.
- Getting competitive advantage with the help of the Tape Patterns indicator
- Knowledge Base – The Tape Patterns indicator
Depth Of Market indicator
Let’s move to the order book analysis indicators. The Depth Of Market (DOM) indicator shows limit sell and buy orders in the right part of the chart.
DOM Levels indicator
The DOM Levels indicator draws significant order book levels, where big limit orders were noticed, directly in the chart.
DOM power indicator
DOM Power shows changes of Bids and Asks in the order book.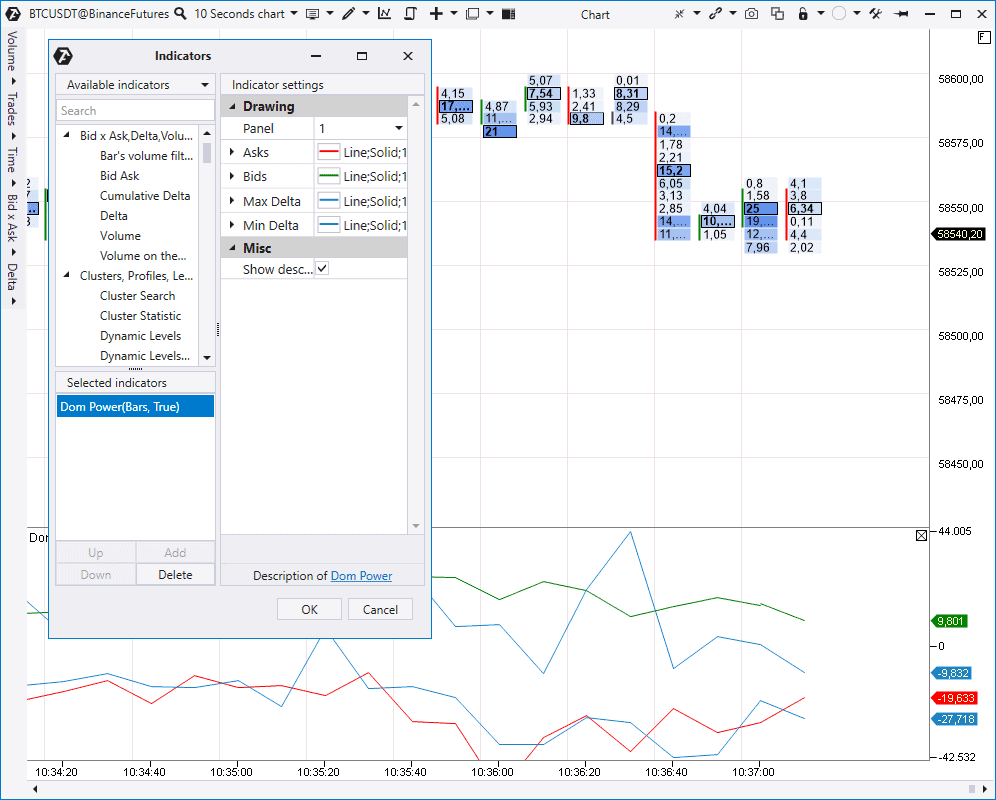
Stacked Imbalance indicator
It looks for imbalances in market buys or sells and highlights these places by levels.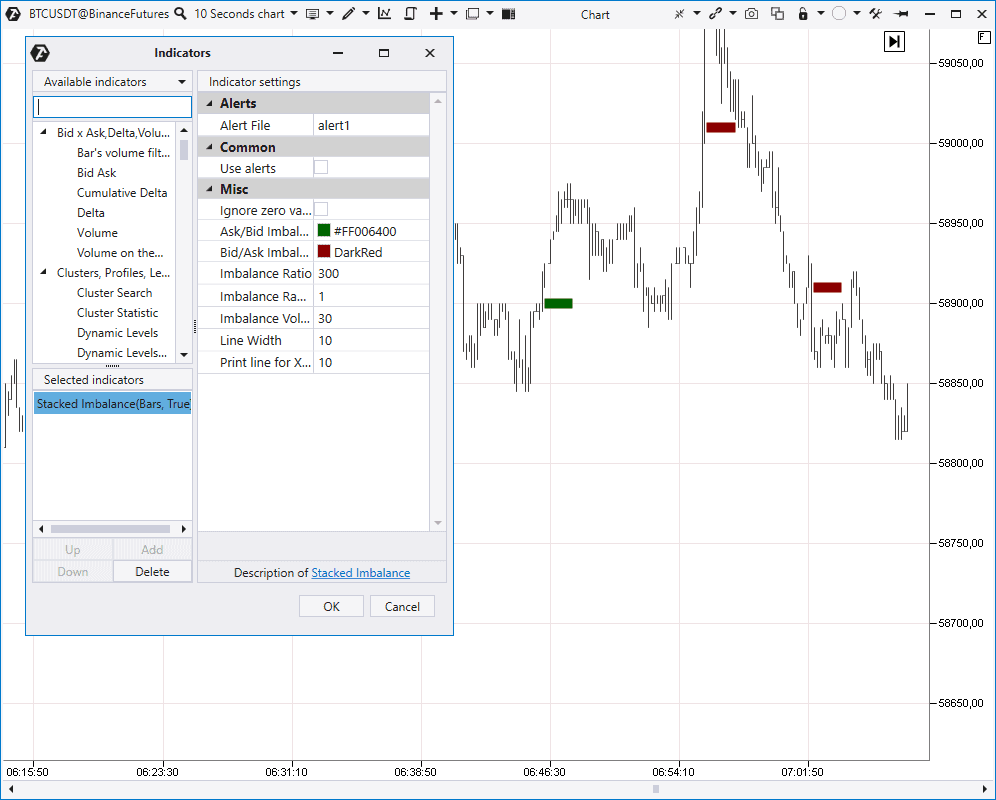
- a necessary imbalance in percentage;
- a range, in which this predominance should be looked for. For example, at 3 neighbouring price levels as it is set by default;
- a minimum volume as an additional filter.
- The Stacked Imbalance indicator in the Knowledge Base
- Imbalance. Why the size matters
- How to find and trade imbalance
Combining indicators
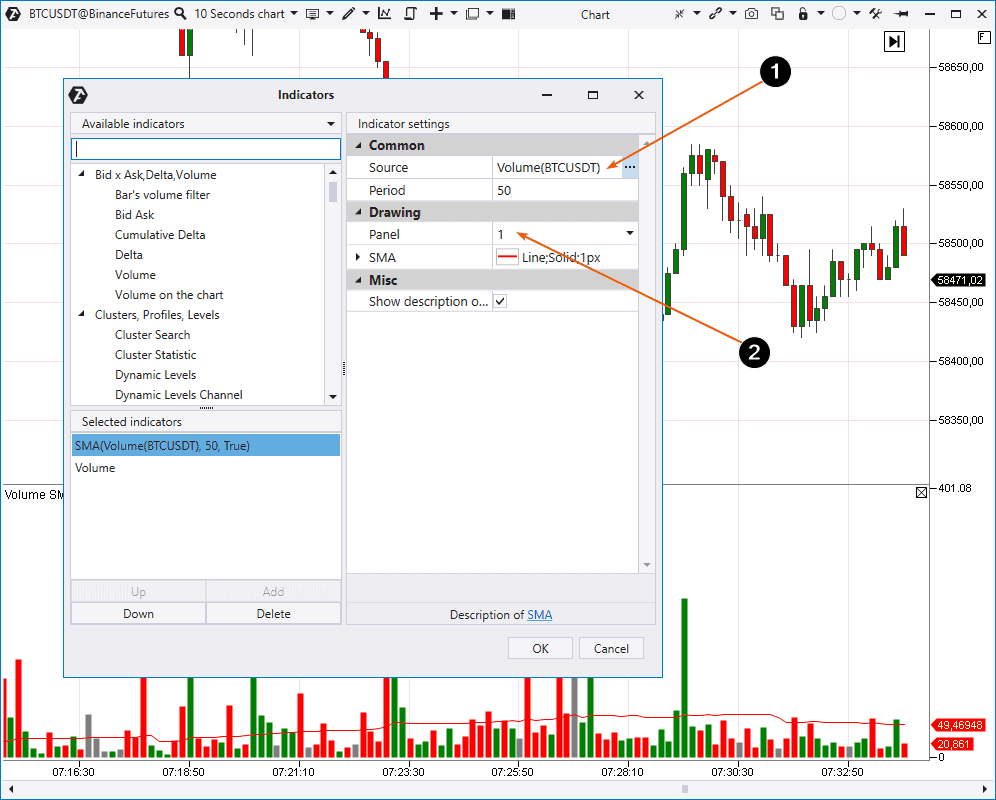
ATAS also provides a possibility to combine some indicators. Example: You want to combine the volume indicator and Simple Moving Average (SMA) in order to assess the volume dynamics in comparison. To do it:- add SMA;
- set Volume as the Source (1);
- show the Panel (2), on which SMA will be built.
Technical indicators
The platform also has a big number of other indicators, including about 50 technical ones. You can find instructions on how to use them in our Knowledge Base. Useful links:- How to combine MACD and cluster analysis
- What VWAP is
- How to use moving averages
- The Weis Waves indicator
Conclusions of the fourth article from the ‘Getting acquainted with ATAS’ series
You have just read a review about indicators, which are available in the ATAS platform. As you understand, it is practically impossible to consider every available indicator in detail in the article format. If you got interested in some specific indicator, use links to relevant articles. We recommend you to download the ATAS demo version to reinforce the material you have got acquainted with and check how indicators work in the markets, which are interesting for you. You can find ideas for trading strategies on our YouTube channel and also in our blog (use the Indicators tag).Information in this article cannot be perceived as a call for investing or buying/selling of any asset on the exchange. All situations, discussed in the article, are provided with the purpose of getting acquainted with the functionality and advantages of the ATAS platform.