The present article is the completion of the series, which was created for those who are interested in volume analysis and studies functionality of the professional ATAS platform for that purpose.
Subject of the fifth article – Conducting trading operations
No matter which way you look at it, you need to execute trades in order to convert your understanding of the market situation into a vital profit.
The goal of this article is to show the existing functionality for conducting trading operations from the ATAS platform. We developed it on the basis of our practical experience and hope that the ATAS functionality will help you to post orders more quickly and accurately, so that you could manage your capital with higher efficiency.
Start using ATAS for free with no time limits! Or activate the advanced tariff right now to access the full range of functionality.
Contents of the text part:
- How to connect the account
- How to open the Chart Trader
- Chart Trader – buttons for buying and selling
- Chart Trader – cancelling, closing and reversing
- Chart Trader – setting up the account, volume and order parameters
- Trading from the chart
- Visual settings
- Trading settings
- Protective strategies
- Composite portfolio
- Trading in the Smart DOM module
- Trading in the Scalping DOM module
- Controlling positions and orders
There is a form for comments after the article. Leave your comments if you have questions – we will be glad to help you.
Connecting the trading account
First of all, you need to connect your trading account to the platform.
Press the Connections icon in the main ATAS window in order to open the Connections manager.
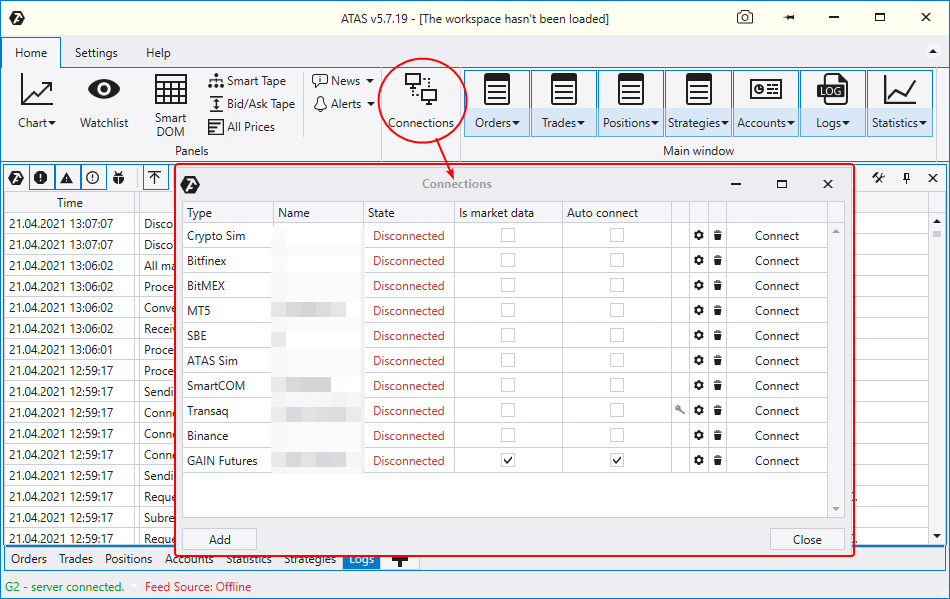
By default, you will have already created accounts for the trading simulator (demo trading):
- ATAS Sim – demo account for trading Western and Russian futures and MOEX stock;
- Crypto Sim – demo account with quotations received from BitTrex, Binance, Bitfinex, BitMEX, Huobi and Bybit crypto-exchanges.
If, for whatever reason, you do not have them, press the Add button, find them in the list of the Simulator section and add them to your account list.
Press Connect in order to launch the ATAS Sim and Crypto Sim connections.
There is the Add button in the Connections window. Press it and you will see the list of available connections to brokers / exchanges / providers of exchange data (the list is constantly actualised).
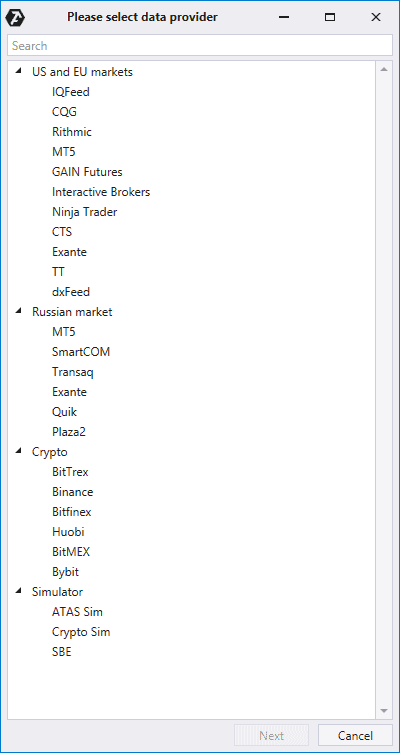
The connection process depends on the selected source and may include entry of the login / password pair (provided by the broker) or connection to a cryptocurrency exchange by API (Secret Key and API Key are created in the Personal Area of an exchange).
Useful links:
- Article: Advantages and disadvantages of demo accounts.
- Knowledge Base: Instructions on connecting accounts and quotations.
What Chart Trader is
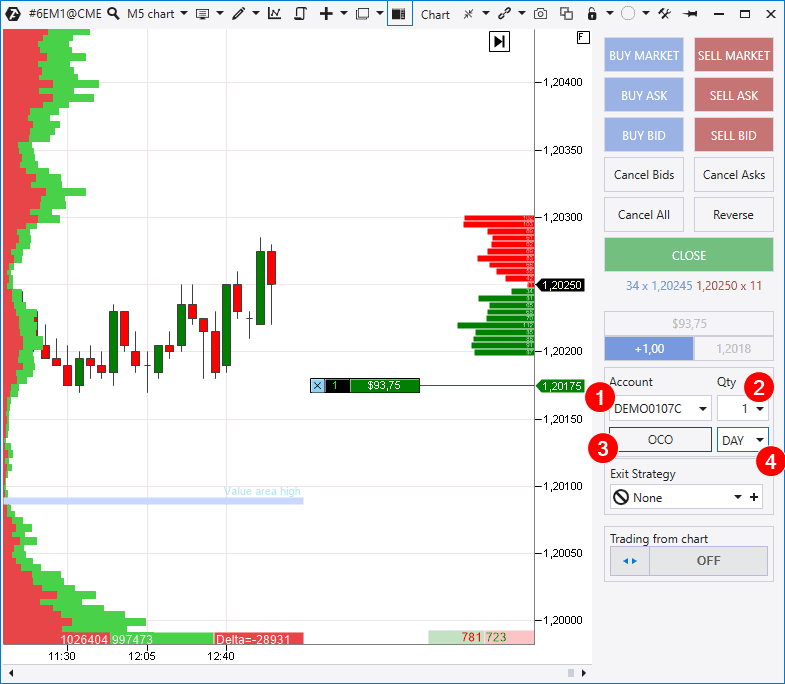
Chart Trader is the main interface (1) for trading from the ATAS platform chart. You can find it in the chart module to the right.
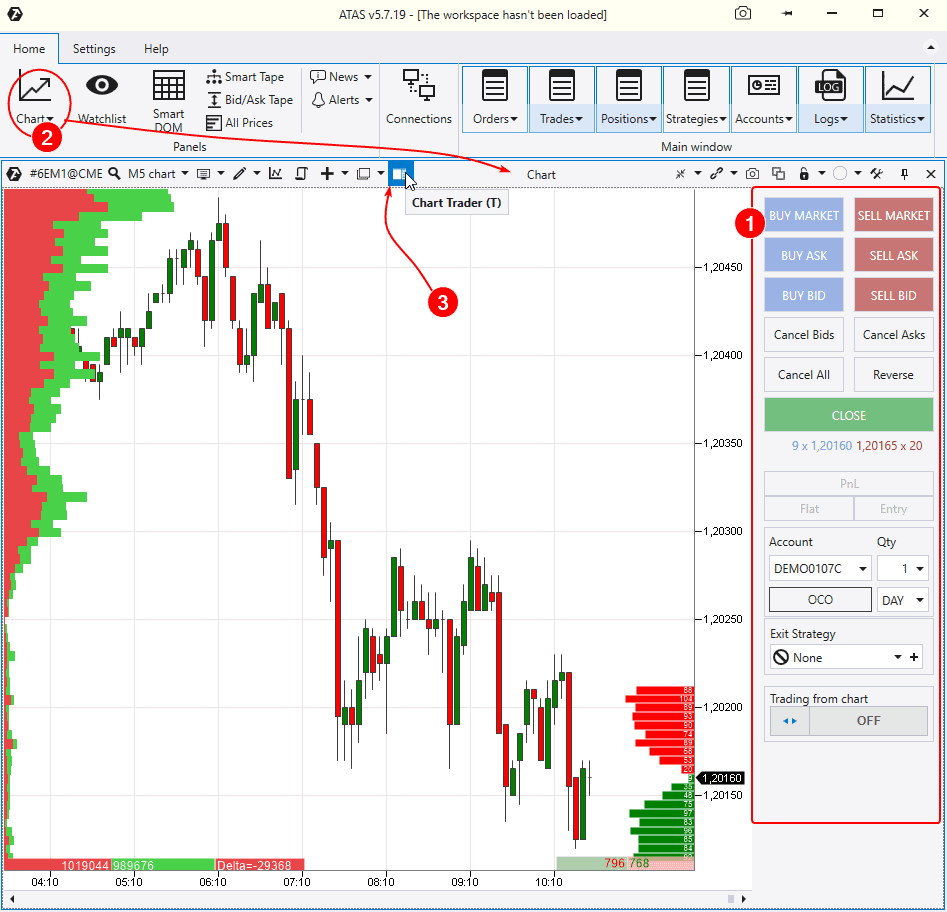
The Chart Trader panel is hidden by default. In order to call it, open the chart (2) and press the respective icon (3) in the upper menu or use the ‘T’ hotkey.
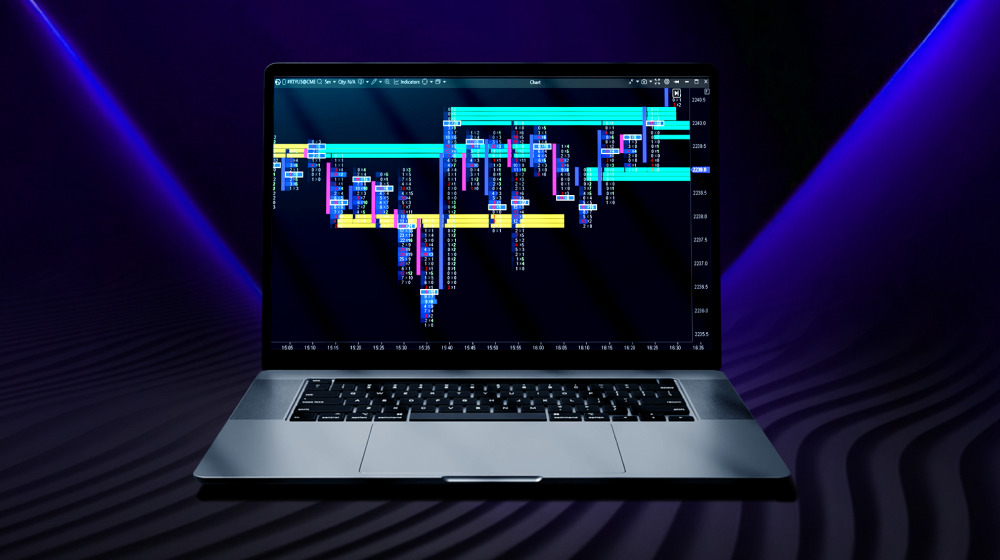
Note. We will be using a Euro futures M5 chart from now on.
Chart Trader – buttons for buying and selling
There are 6 buttons in the upper section of the Chart Trader panel: 3 of them are blue and they are for buying and 3 of them are red and they are for selling. Let’s discuss what they mean.
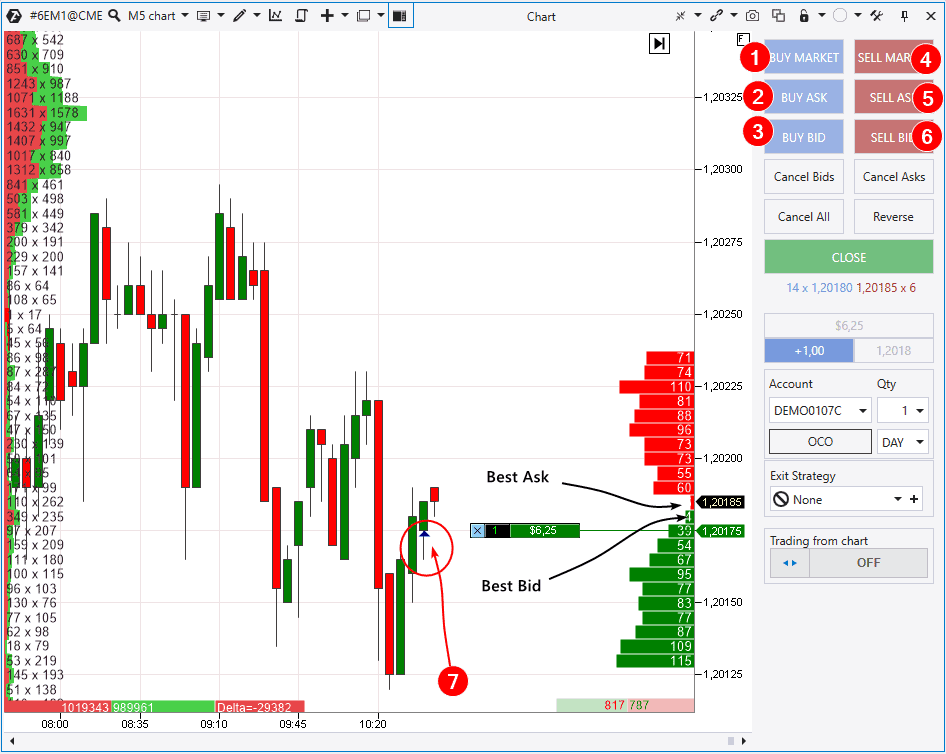
- BUY MARKET – this button sends the market buy order to the exchange and you get a long position immediately. There is a nuance. If the price moves fast (for example, when news is announced), the opening price of your long could be significantly higher than the one you hoped for (the slippage effect).
- BUY ASK – this button sends a limit buy order to the exchange at the Best Ask price (the lower red bar level in the histogram of the Depth Of Market indicator). In this case you insure yourself against slippage and the trade will be executed at that price, at which the order was posted. However, if the price starts moving up at the moment of the order posting, the limit order might not be executed.
- BUY BID – this button sends a limit buy order to the exchange at the Best Bid price (the upper green bar level in the histogram of the Depth Of Market indicator).
- SELL MARKET – this button sends an order to the exchange for an immediate market sell. The broker undertakes to execute your order at the best available offsetting limit order from the buyer.
- SELL ASK – this button sends a limit sell order to the exchange at the Best Ask price.
- SELL BID – this button sends a limit sell order to the exchange at the Best Bid price.
Note that when you enter your position, a triangle mark appears in the chart (7) – it shows the point of your entry. If you enter a long position, the triangle points up, If you enter a short position, the triangle points down.
What button, out of the 6 available ones, should be used for trading? Each button makes sense. A trader himself should decide based on the circumstances of every specific case – size of the commission fee, current market volatility, strategy testing results, etc.
How to post a pending order at the price, which differs from the Best Bid and Best Ask? Just mouse over the chart, click the right mouse button and select a required order in the context menu (we will show you below one more ‘Trading from chart’ method).
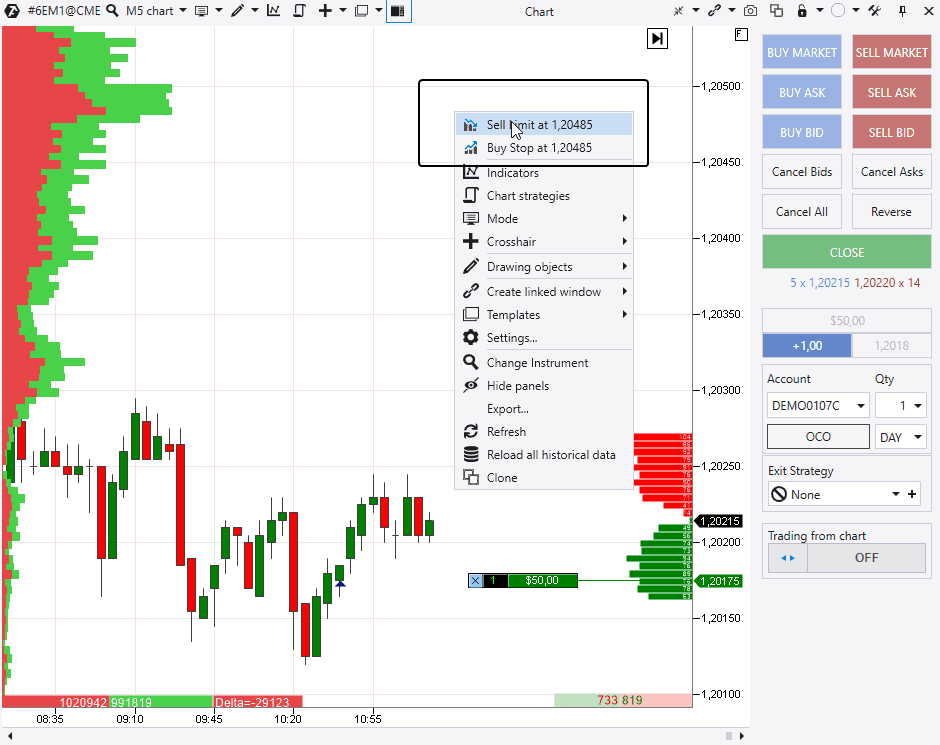
You can post above the current quotation:
- BUY STOP – a buy order when the price increases to a certain level. If you do not have a position, such orders are posted for a breakout entry effort. If you have a long position, you will add to it or average it (what averaging is). If you have a short position, exit from it or reduce it.
- SELL LIMIT – a sell order when the price increases to a certain level. If you do not have a position, such orders are posted in an effort to catch a bounce. If you have a short position, you will add to it or average it. If you have an open long position, exit from it or reduce it.
Consequently, you can post below the current quotation:
- BUY LIMIT – a buy order when the price decreases to a certain level.
- SELL STOP – a sell order when the price decreases to a certain level.
Useful links:
- The Depth Of Market indicator.
- What Bid and Ask are.
- Pros and cons of various order types.
- The order path from creation to execution.
Chart Trader – cancelling, closing and reversing
Buttons for cancelling available orders and closing or reversing available positions are located on the Chart Trader panel below 3 blue buy buttons and 3 red sell buttons.
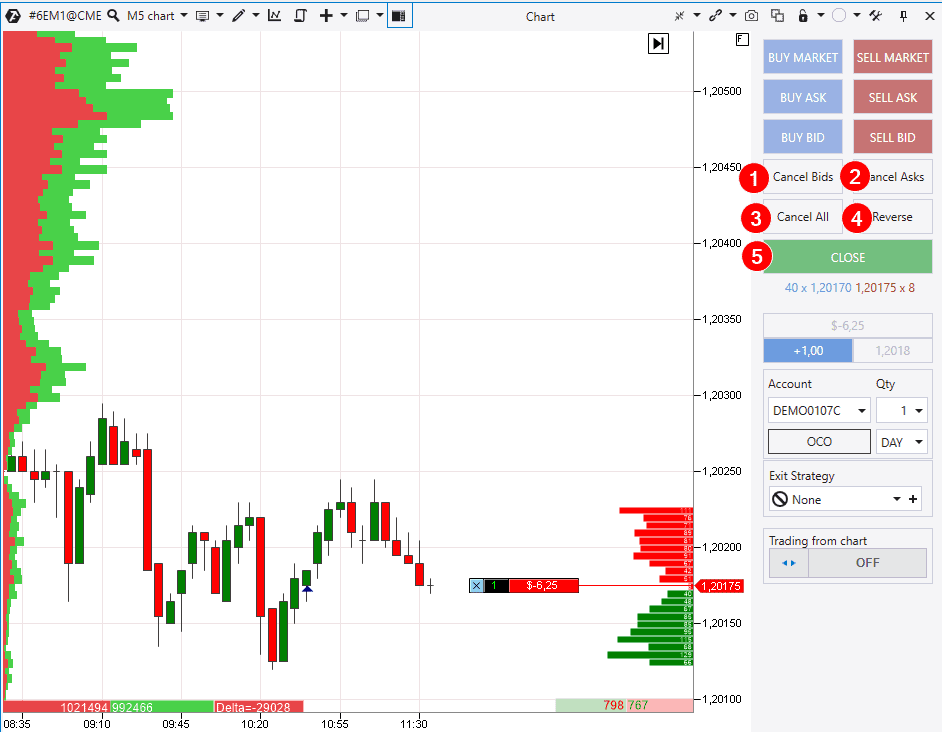
- Cancel Bids – this button closes posted pending buy orders on the selected instrument.
- Cancel Asks – this button closes posted pending sell orders on the selected instrument.
- Cancel All – this button closes all posted pending orders on the selected instrument.
- Reverse – this button reverses positions. What does a reversal mean? Let’s assume you have a long with the 1 contract volume. If you press Reverse, your long will be closed and a short with the same volume will be opened.
The same is true for the opposite action. If you want to ‘change’ a short for a long, press Reverse. Note that pending orders do not change when your position is reversed. You will have to cancel them manually.
- CLOSE – this button closes positions and cancels all orders. We recommend you to press this button when you want to make sure that there are no posted orders in the chart and there is no incidentally forgotten open trade.
Advice. Keep control over the existing pending orders so that they are not triggered when you suddenly forget about them.
Chart Trader – a position marker
Let’s assume you have a buying position. It will be specified with a special marker in the chart. What does it show?
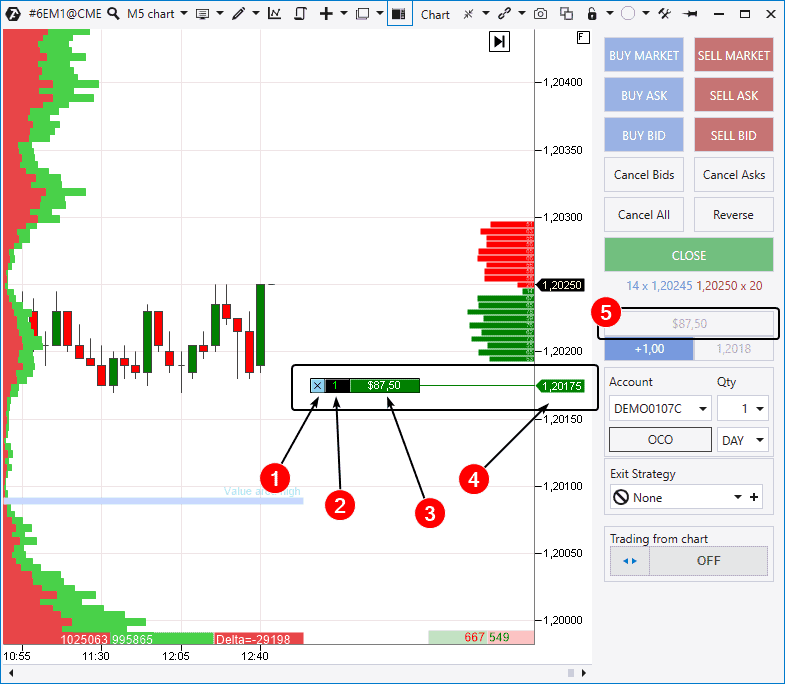
- If you press the cross icon, you will close the current position at the market price.
- This number shows the volume and position direction (in our case, 1 long contract in green font color. A short position would have been -1 in red).
- The current PnL (Profit and Loss statement) of the position. It shows a floating (unregistered) profit or loss. If the position is profitable, the marker is green. If the position is loss-making, it is red.
- The position opening price. If you open trades at different prices, this marker will show you the average price of the whole position.
- This button is for setting up PnL. Click on this field in order to select the display in a currency, percentage or ticks. Or you can just hide it, if you wish. The marker will have a respective look in the chart.
Chart Trader – setting up the account, volume and order parameters
Let’s move further. There are the following elements below in the Chart Trader panel:
- Account selection menu.
- Working position calculation menu.
- OCO (One Cancels the Other) button.
- Menu for selecting the term of action of the pending order.
Let’s consider them in more detail.
Account selection menu (Account). You choose here on what account you will post an order. If you have several accounts (both demo and real), it is very important not to mix them up!
Menu of the position size selection (Qty). You can enter a required working volume from the keyboard or call the drop-down calculator to calculate the order volume with its help. Be careful not to post too big a volume. You should clearly know how to measure a lot for the market, which you have selected (contracts, coins, shares, etc.), and how PnL will change at one tick.
OCO button. OCO (One-Cancels-the-Other order) or interrelated orders. When one order is triggered the other one is automatically cancelled. It is convenient and useful in a number of cases. For example:
- You trade the consolidation area breakout. And, in principle, you do not care in what direction the price would move. You press the OCO (the button will be highlighted green), post Buy Stop above the current price and Sell Stop – below it. Besides, the orders will be highlighted yellow, which means that they are interrelated. When an impulse takes place, one order will be executed and the other will be cancelled.
- You post take profit and stop loss orders manually. Press the OCO. When the take or stop is triggered, the other order will be withdrawn, otherwise, there is a risk that both orders will be triggered and you will enter a position again, although you planned to exit from it.
Menu of the order term of action. It has 2 values:
- GTC – Good Till Canceled. The order stays active until you cancel it by yourself.
- DAY – The order is cancelled at the end of the day (session). This mode could turn out to be very useful for intraday traders / scalpers. It prevents rolling orders overnight so that a sharp movement at the beginning of the next day wouldn’t bring unpleasant surprises.
Trading from chart mode
The ‘Trading from chart’ mode button is at the very bottom of the Chart Trader panel (we will discuss the Exit Strategy below).
You can activate the ‘Trading from chart’ mode by pressing this button and also with the help of the whitespace hotkey.
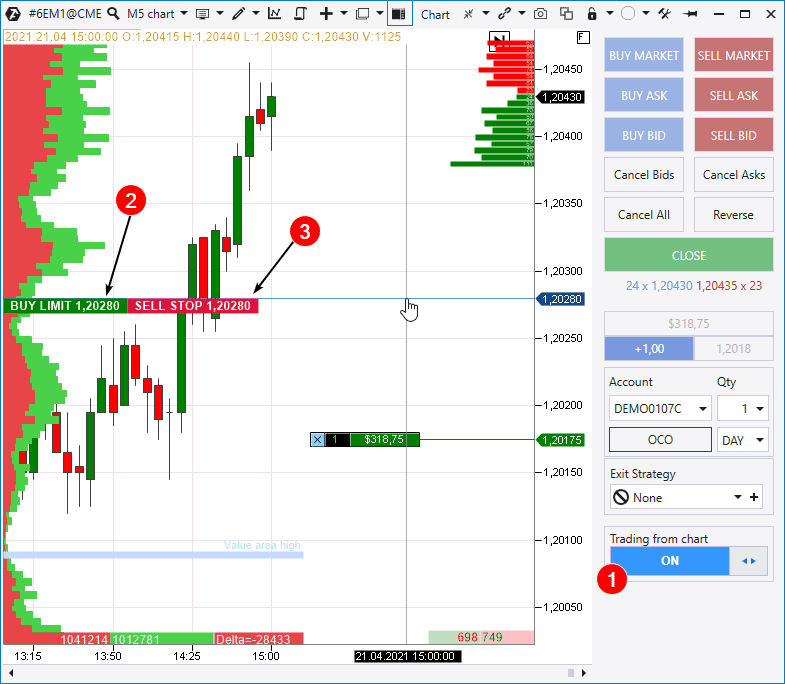
When the mode is activated (1), you will see a cross-hair in the chart. There are pending order posting options in its left part:
- you can post Buy Limit below the current price with the left mouse button;
- you can post Sell Stop Limit below the current price with the right mouse button.
Consequently, the orders will change to Sell Limit and Buy Stop if you select the level above the current price.
Note that if you have activated the ‘Trading from chart’ mode with the help of button 1, you need to press the button again to exit from this mode. However, if you have pressed the whitespace bar, you will exit from the ‘Trading from chart’ mode automatically.
Advice. It is very convenient to trade with the whitespace bar, because you protect yourself from incidents this way and, when you press it, orders are posted in one click.
Visual settings
In order to set up visualisation of trading labels, marks and orders, you need to open the settings manager window. Call it from the upper menu (or from the context menu, which you can call after you mouse over the chart and click the right mouse button) and go to the Trading Settings tab.
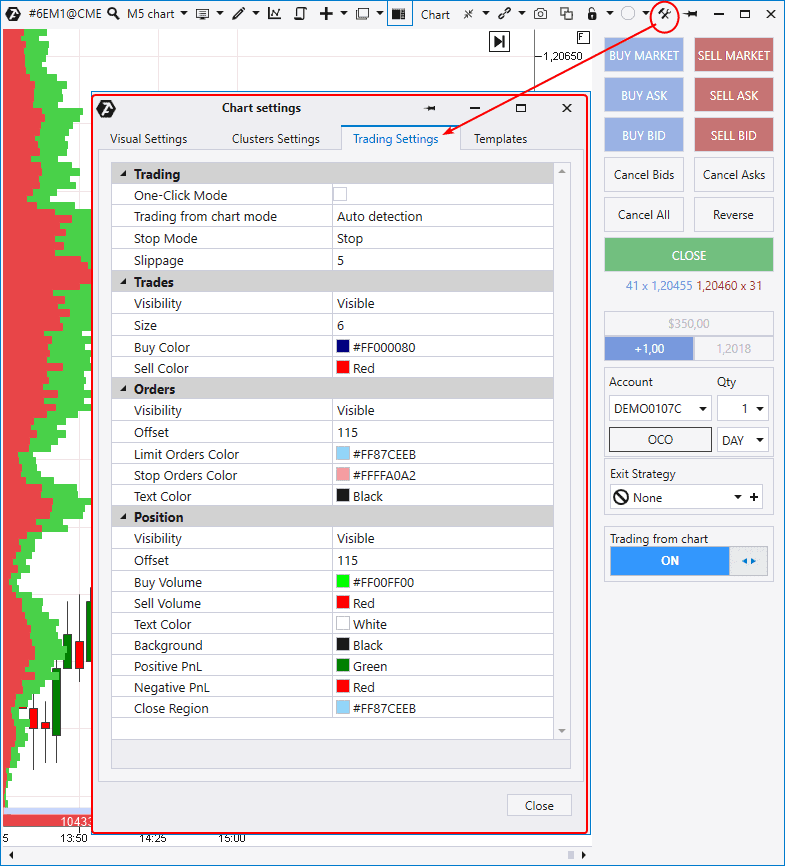
There are such sections here as:
- Trading (we will discuss it below);
- Trades – visual settings for trades;
- Orders – visual settings for orders;
- Position – visual settings for available positions.
As you can see, you can set up colors, fonts and offsets as you like. We just want to note the Visibility setting – it allows to show / hide trades / positions / orders and has 3 options:
- Visible – trades / positions / orders are reflected in the chart;
- Hidden – trades / positions / orders are hidden;
- Visible if Chart Trader Enabled – trades / positions / orders are reflected in the chart when the Chart Trader panel is activated.
Trading settings
Let’s consider the trading section in the Settings window. It has 4 fields:
- One-Click Mode;
- Trading from the chart mode;
- Stop mode;
- Slippage.
We should discuss them in more detail.
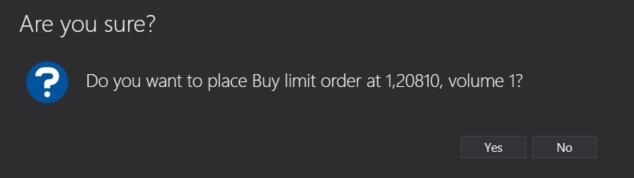
One-Click Mode – activation of the trading mode in 1 click. If the item is checked, orders will be sent to the exchange immediately without a warning:
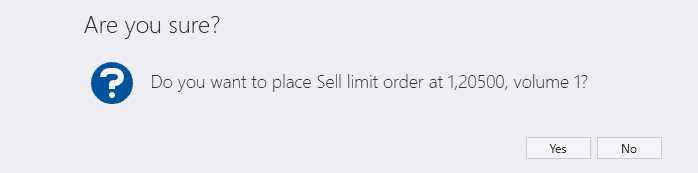
On the one hand, the trading mode in 1 click is convenient and essential for scalpers and traders, for whom the trade opening speed is important. On the other hand, it is open for a possibility to send an order incidentally. That is why we recommend using the trading mode in 1 click only to experienced traders who are sure that it will bring more benefit than risk and inconvenience.
The Trading from the chart mode setting has 2 values:
- Auto detection (by default);
- Lclick: buy, Rclick: sell.
Here you can identify what mouse buttons are responsible for what operations – Buy or Sell.
The Stop mode is a very interesting development for working with slippages.
This mode has 2 values:
- Stop (by default);
- Stop-Limit.
The ATAS platform works in a standard way when Stop mode = Stop. Let’s assume you have a long, which is protected by a stop loss. If the price touches the stop level, a SELL Market order is sent to the exchange and the long is closed at the market price.
However, this standard scheme has a nuance, which is connected with slippage, which can easily take place under conditions of high volatility and result in a situation when your long will be closed not at the price where your stop is posted but significantly lower.
In order to avoid it, you can set Stop mode = Stop-Limit. So, if the price moves down to the stop level, the platform will try to close your position by the limit order, but not worse than it is specified in the Slippage field (5 ticks by default). In such a way, you specify the affordable size of slippage.
Warning. If you set a very small Slippage value, you increase the risk of non-execution of your stop order if the price ‘flies over’ through the level of your stop without any rollback.
Advice. You can use the Stop mode = Stop-Limit for trading breakouts. Let’s assume you want to post the Buy-Stop above the previous high hoping for the uptrend, but you know that the price, in the event the high is broken in your market, often rolls back within the breakout limits.
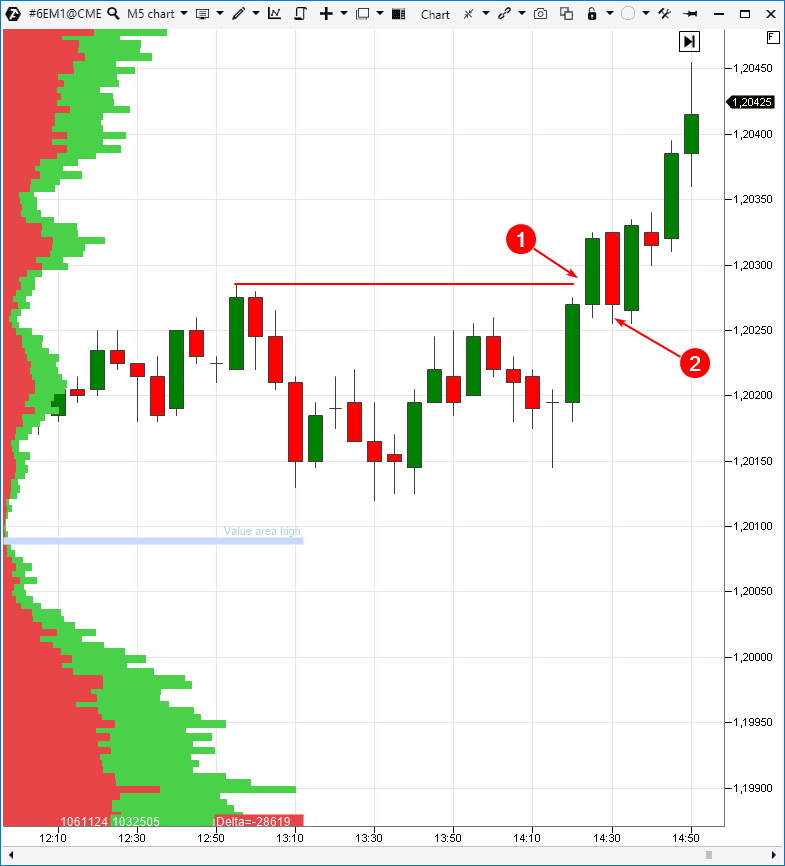
Then, you set the Buy-Stop above the previous high when Stop mode = Stop-Limit. And then, in the event of a bullish breakout, ATAS will not send the order for entering into the long market position (1), but will post the Buy-Limit a bit lower (at the Slippage value) with a view to buy on the rollback (2), in so doing reducing the risk of buying at the peak.
Useful links:
- Posting stop losses and take profits in ATAS.
- Who activates your stops, why and how?
- 4 ideas on how to trade breakouts.
Protective exit strategies
Now, let’s consider the protective exit strategies. They are aimed at helping you to manage the capital by sending accompanying orders when opening a position and after it.
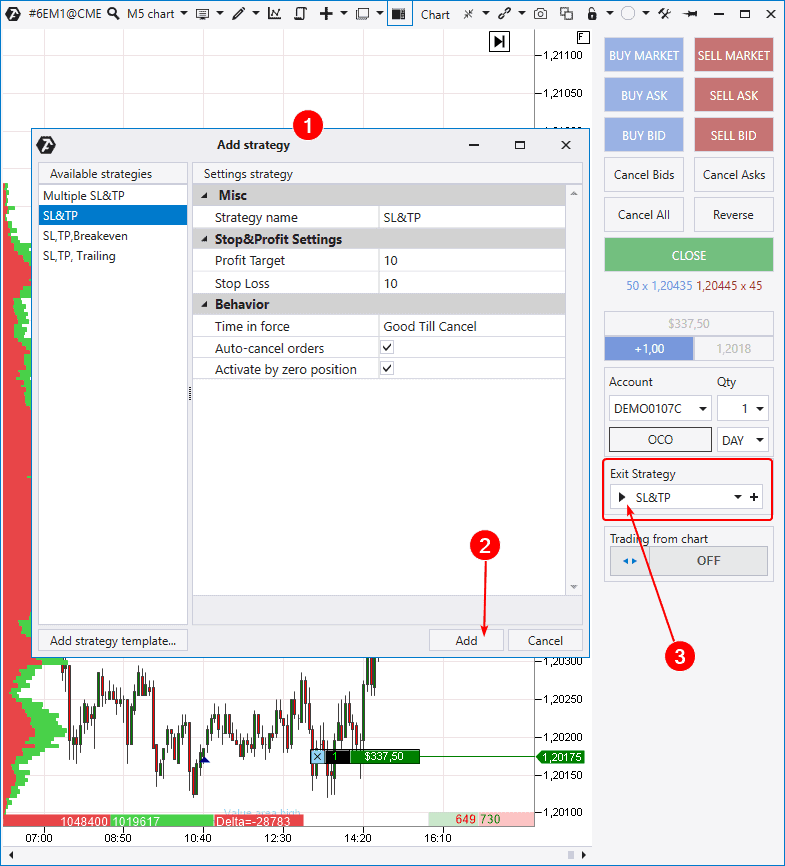
There are 4 template strategies in the protective strategy management window (1):
- Multiple SL&TP;
- SL&TP;
- SL, TP, Breakeven;
- SL, TP, Trailing.
If these 4 templates are not enough for you, you can add your strategy by pressing the Add button (2).
Let’s consider 4 template strategies, which are available by default.
SL&TP. This is, perhaps, the simplest strategy. As soon as you enter into a position, ATAS posts Stop-Loss and/or Take-Profit at an already set distance in ticks. If Take-Profit (or Stop-Loss) = 0, an order is not posted.
SL, TP, Breakeven. It is similar to the previous strategy but with a possibility to move a position into a breakeven.
SL, TP, Trailing. It provides a possibility to realise trailing. It means that if the price moves in your direction, ATAS will make the stop loss follow the price, protecting the position by doing so.
Multiple SL&TP. You can create several levels in this strategy and spread TP and SL orders at them. For example, you can do it in order to close a position by parts: 1 part by the close TP1 and the second part by the far TP2.
Important. After you have set strategy parameters, you can ‘launch’ it by pressing the Play button (3).
Useful links:
Composite portfolios
This function will be useful to professional managers, who trade one instrument on several accounts simultaneously, for example, with different brokers, on different cryptocurrency exchanges and so on.
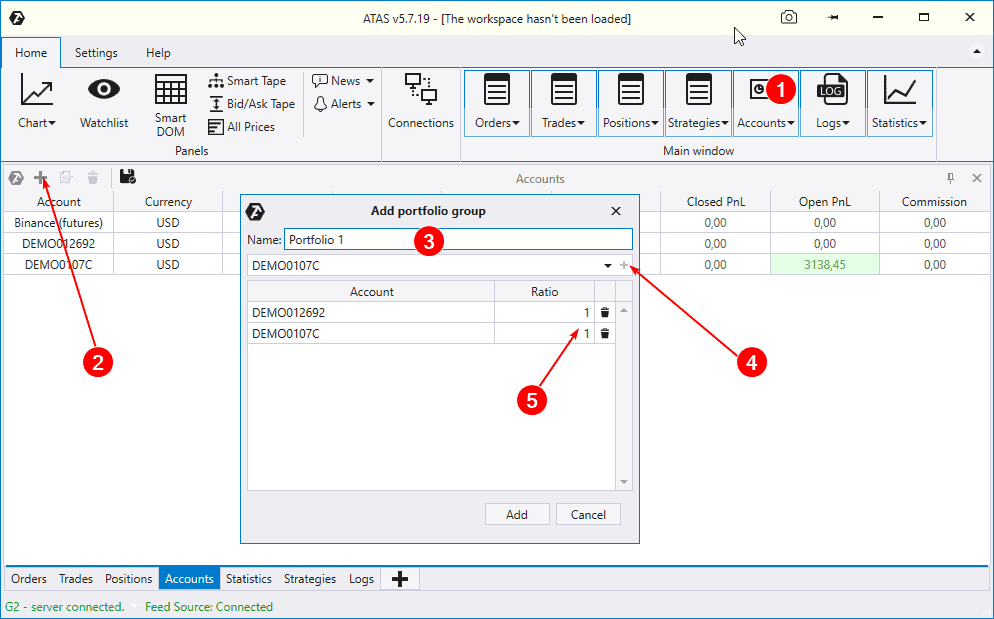
In order to form a composite portfolio, you need to:
- Press the Accounts button in the main window.
- Press the Plus sign in the list of accounts.
- Give a name to your portfolio (for example, ‘Portfolio 1’).
- Add accounts into it.
- Set up Ratio.
What is Ratio? This is the proportionality ratio. If you need to trade 1 contract on the first account and 2 contracts on the second account, set Ratio = 2 on the second account. The volume of trades on the second account will be increased two times. This would allow accurate setting up of the trading volume for trading accounts of different sizes and with different risks of trades.
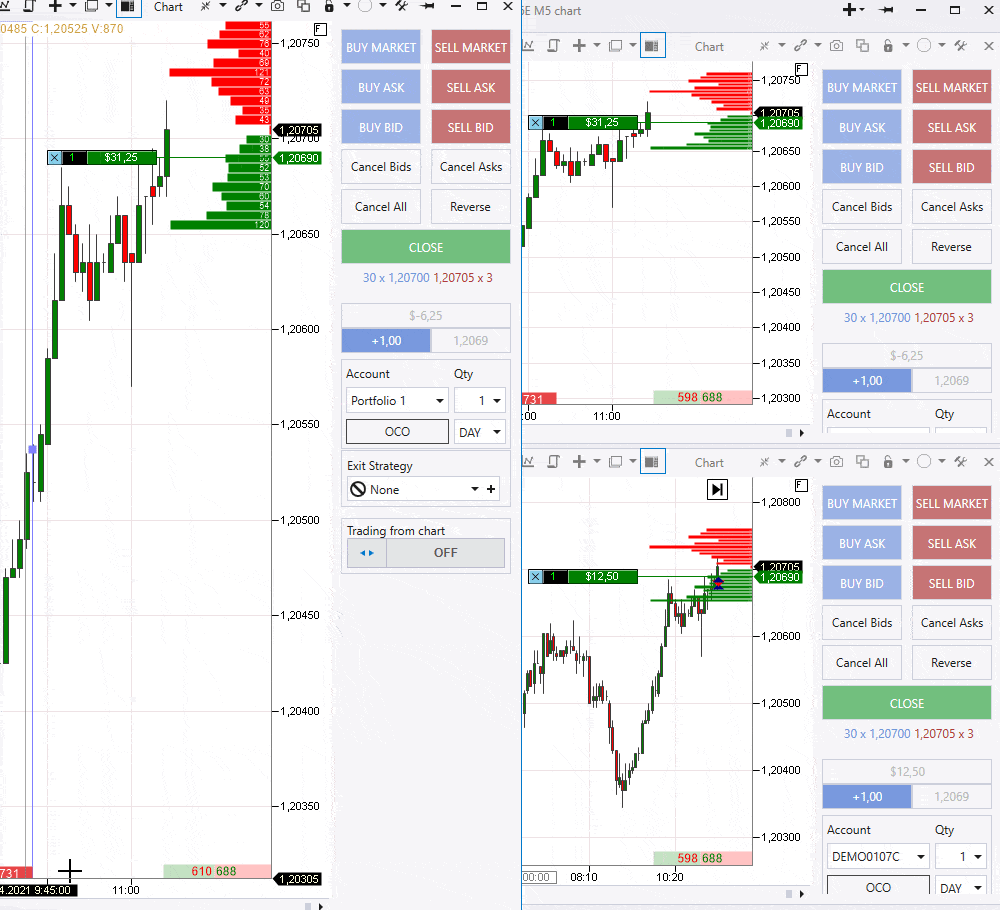
The GIF above shows how the position closing on the ‘Portfolio 1’ account results in synchronous closing of the positions on the accounts which it includes. Similarly, you can synchronize position opening, pending order posting and other operations.
Important! Monitor the protective exit strategy settings on various accounts, since they might take actions in the portfolio out of sync.
Trading in the Smart DOM module
Smart DOM is the ‘Smart Depth Of Market’ module for working with limit orders. There are strategies (first of all, scalping ones) for trading only in the DOM and the Smart DOM module was specifically developed for such cases. Partially, namely that is why the ATAS Depth Of Market is called Smart.
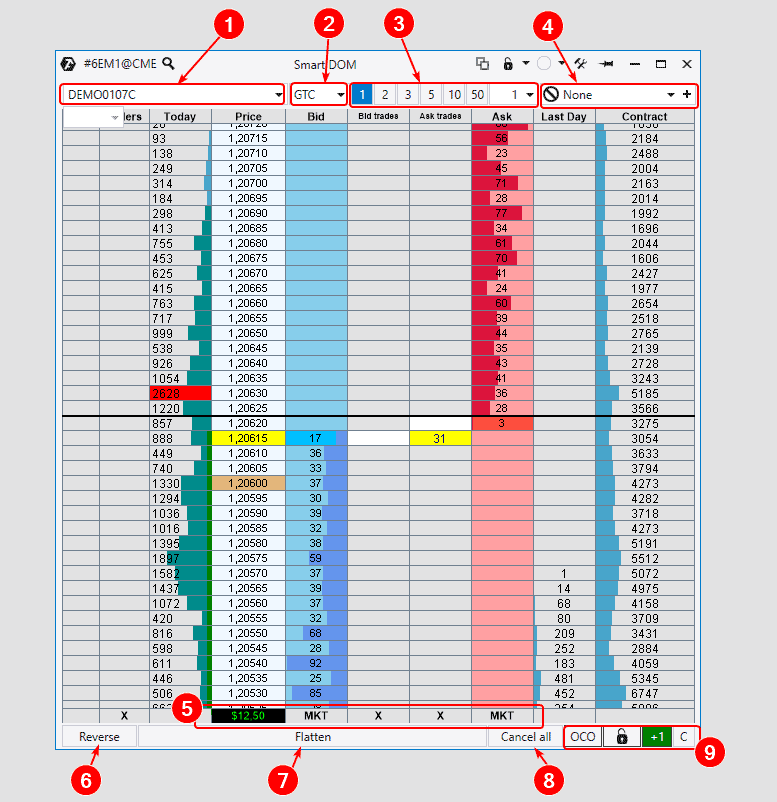
Practically all trading functions, which are available in the Chart Trader, are also realised in the Smart DOM:
- Account selection.
- Set-up of the term of action of pending orders.
- Selection of the working volume.
- Protective exit strategies.
- The current PnL and MKT buttons for opening market positions are in this line.
- Position reversal.
- Closing all orders and positions.
- Cancelling all pending orders.
- This section contains the button for posting OCO orders, current position data and the centering button.
Click the Bid and Ask columns with the left mouse button to post an order:
- click the Bid column above the quotation – Buy Stop;
- click the Bid column below the quotation – Buy Limit;
- click the Ask column above the quotation – Sell Limit;
- click the Ask column below the quotation – Sell Stop.
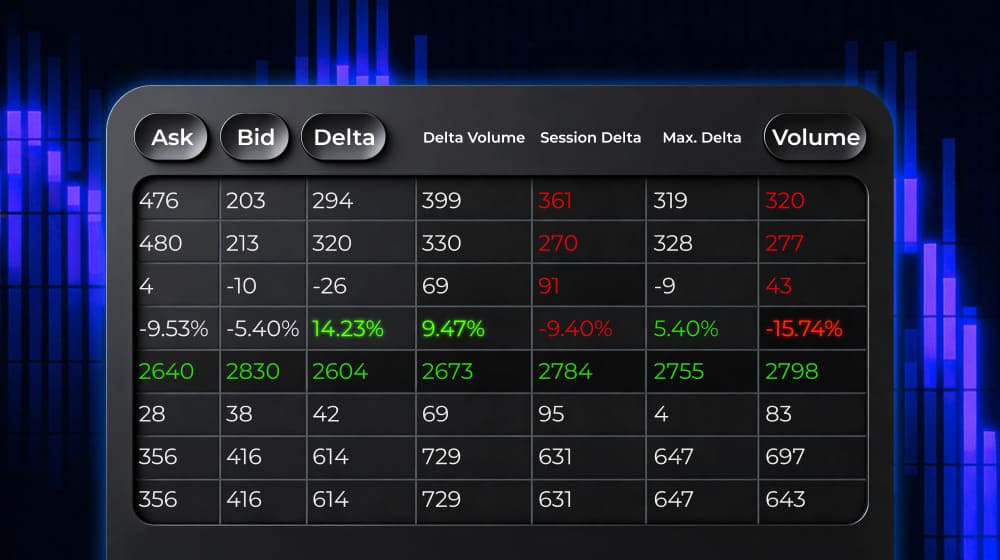
Data about posted orders will be shown in the Orders column. We should note that the upper menu contains the button for calling the module settings where you can add / remove columns and also change each of them as you like.
Useful links:
- Trading in the Smart DOM.
- Smart DOM trading functions.
- How to trade with the help of the Depth Of Market.
- Video. Idea for scalping in the Depth Of Market.
Trading in the Scalping DOM module
Scalping DOM is the so-called ‘scalping drive’. It combines in itself:
- Order flow section.
- DOM section.
The Scalping DOM module is attached at the right side of the chart (6). You can set up its display in the form of clusters (there are 25 variants of them in ATAS) or classical candles / bars. It also makes sense to track the profile.
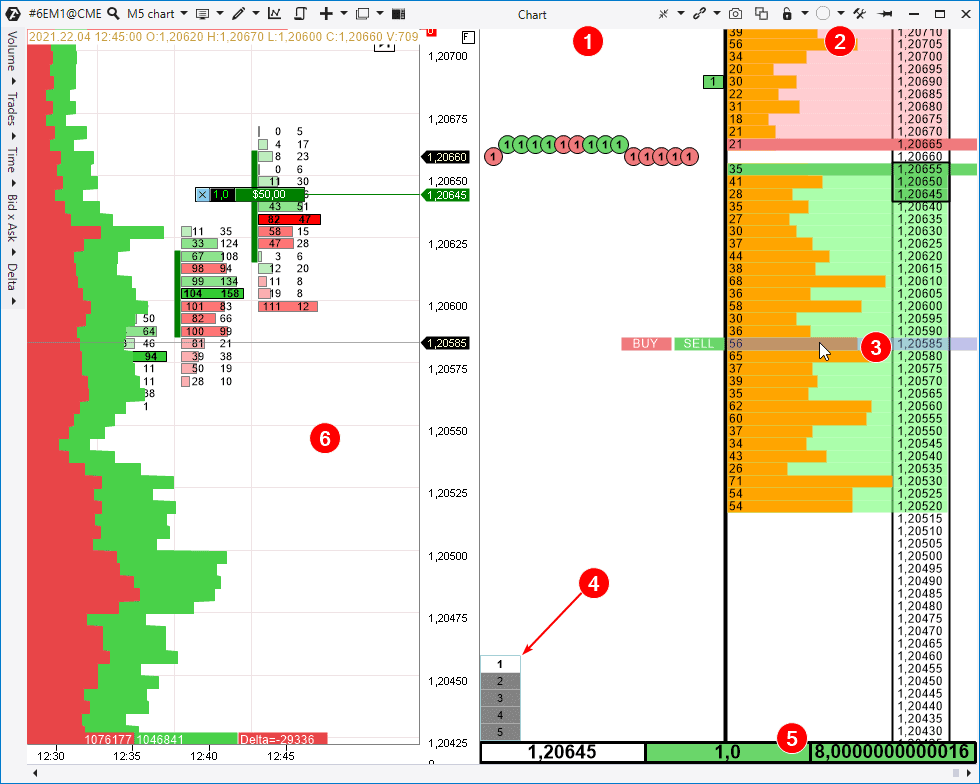
If you mouse over the DOM section and click the respective mouse button, you will be able to send respective BUY and SELL orders (3):
- the right mouse button click above the current price – Sell Limit;
- the left mouse button click below the current price – Buy Limit;
- the right mouse button click below the current price – Sell Market;
- the left mouse button click above the current price – Buy Market.
There is a switch (4) in the lower part for selecting the working volume and also data (5) by the positions (if any). An important property of the scalping drive is a possibility to trade using hotkeys.
How to launch the drive?
The Scalping DOM drive is realised in the indicator format in the ATAS platform. That is why, if you want to use it, select Scalping DOM at the end of the Indicators manager list in the open chart and add it to the chart as any other indicator.
The driver settings could be changed the same way as you change indicator settings:
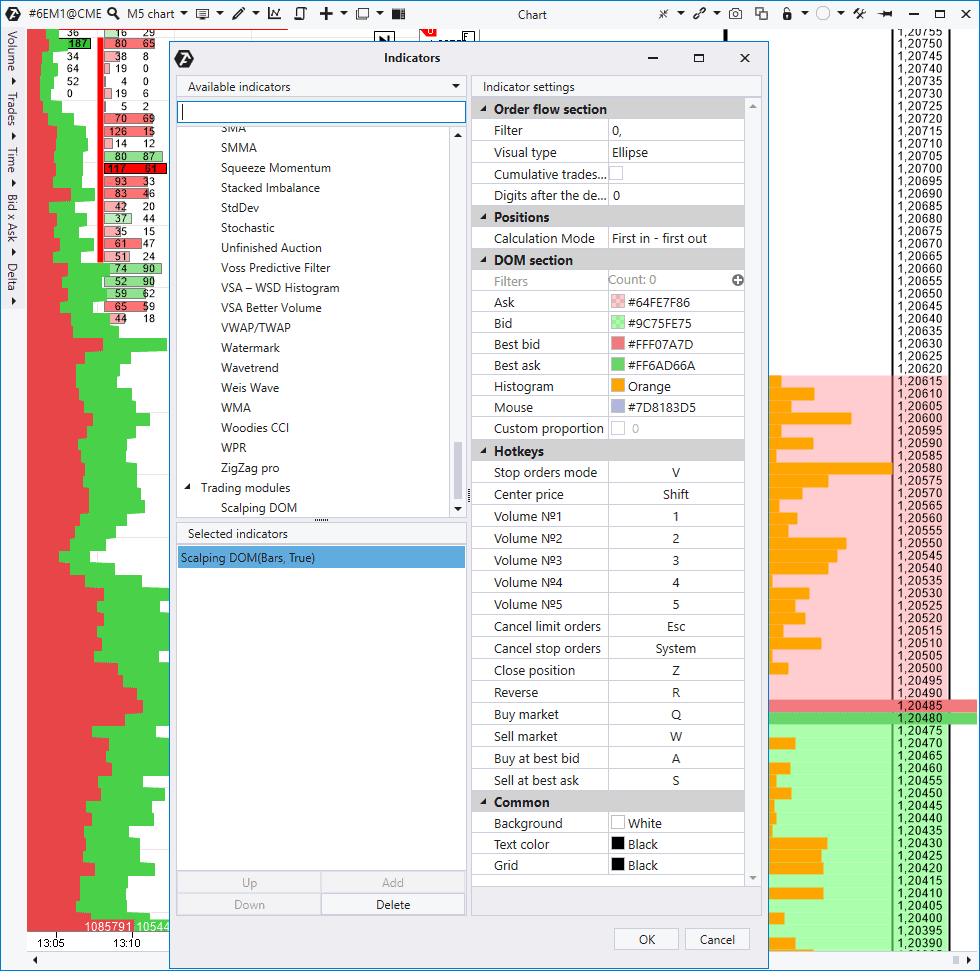
There are very many Scalping DOM settings, that is why you can learn about them in more detail in individual materials:
Position and order control
If you are an experienced trader, you know that it is easy to lose sight of one order or even position if you trade in several markets. This may happen if an order is posted far from the current price and it is not displayed in the visible area of the chart. In order to avoid surprises in the future – ‘Where is this trade on my account from?’, we recommend you to look into the Orders (1), Trades (2) and Positions (3) tables.
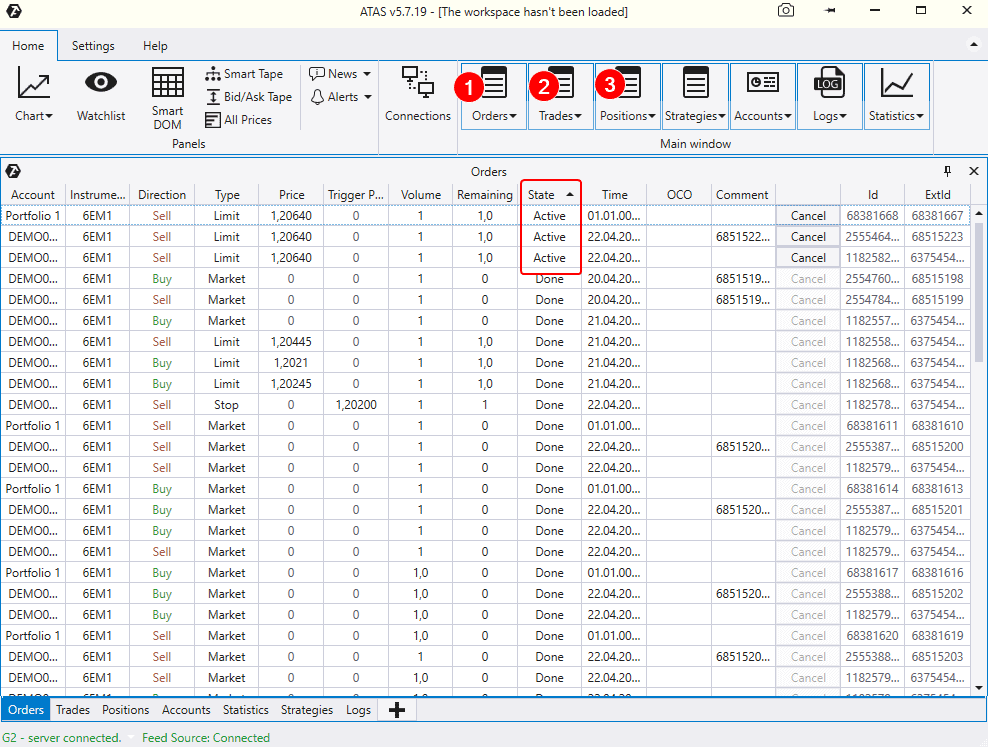
They are called by relevant buttons from the main ATAS window. For example, the screenshot above shows how all orders are sorted out by the State criterion. Availability of active orders is shown in the upper part of the platform. If you do not need them, you can remove them just by clicking the Cancel button to the right. Check this regularly to avoid surprises on your account.
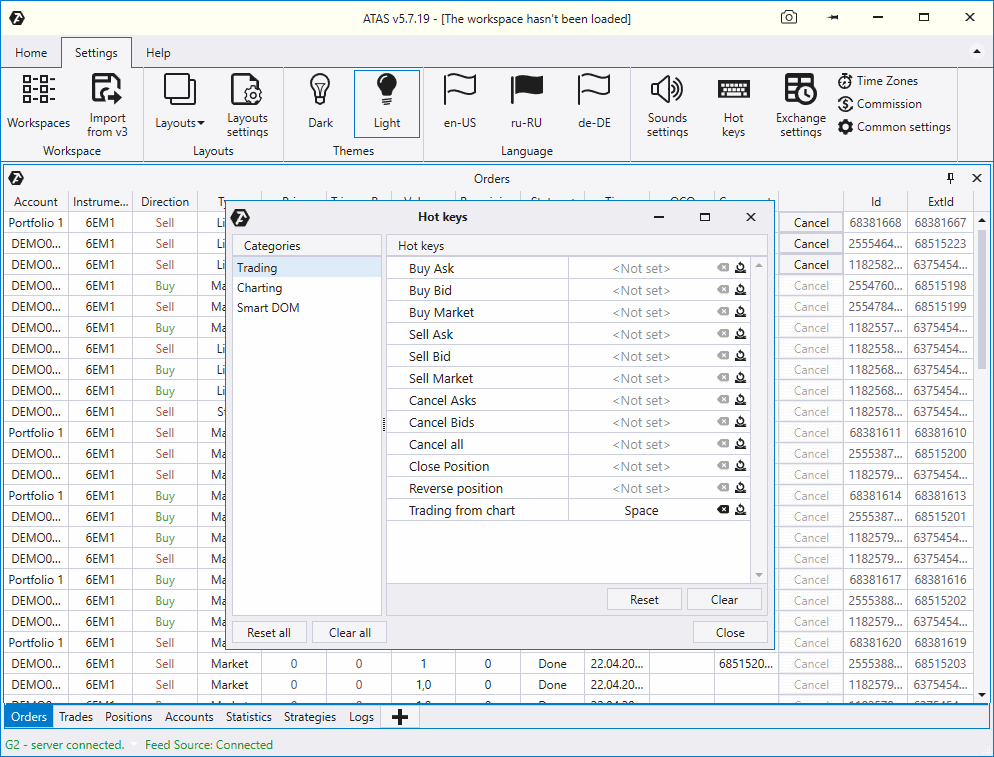
Hotkey settings
At the end of this review, we want to mention the possibility to set up hotkeys for trading operations. This would allow you to use the keyboard if it is more comfortable for you.
Before we complete the series of review articles about the ATAS functionality, we want to give you the link to the How to write algorithms for ATAS article, which speaks about experience of writing your own indicators for connecting to the platform using its API.

Results of the ‘Getting acquainted with ATAS’ series
Thank you for reading all 5 articles of the ‘Getting acquainted with ATAS’ series. We tried to make it maximally structured and comprehensible, preserving laconism and supplementing the article sections with links to relevant materials.
As you have seen, ATAS is a rather complex software, that is why it will take time to master it. And it is only natural, since an exchange trader is a profession of those who work intelligently. Be persistent and believe in your success – you can learn anything step by step.
We hope that these articles helped you to put the puzzle together and you got a general understanding of the platform structure. In the event you haven’t yet downloaded the ATAS demo version, we recommend you to do it right now in order to solidify the received knowledge and check how the platform functionality can be useful for your operation in the financial markets.
You can find a lot of useful information about the ATAS platform and trading in general on our YouTube channel and also in the ATAS blog.
Information in this article cannot be perceived as a call for investing or buying/selling of any asset on the exchange. All situations, discussed in the article, are provided with the purpose of getting acquainted with the functionality and advantages of the ATAS platform.