

The rising wedge is a well-known chart pattern in technical analysis, often viewed as a potential signal of a trend reversal from bullish to bearish.
However, beginner traders often encounter several challenges: how to accurately identify and confirm a rising wedge, use it in trading, and whether the pattern can genuinely yield profits. In this article, we address these questions with a fact-based approach, supported by professional indicators and charts for volume analysis. This will help you better understand the underlying market dynamics when a rising wedge appears on the chart.
Key Characteristics of a Rising Wedge Pattern
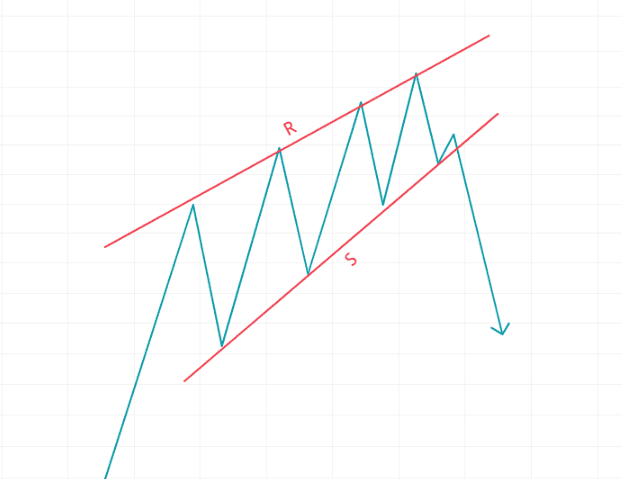
The rising wedge pattern appears on a chart when the price forms higher highs and higher lows, while:
✔ The support (S) and resistance (R) lines converge, creating a wedge-like formation.
✔ Both lines slope upward, which gives the pattern its name — the rising wedge.
The rising wedge is a type of triangular formation that occurs:
- across various instruments (stocks, futures, cryptocurrencies);
- on different time frames;
- within both bullish and bearish prevailing trends.
What Does the Rising Wedge Mean in Trading?
The rising wedge pattern indicates a gradual decrease in price fluctuations and reduced volatility, but what does this imply for the trend?
According to classical technical analysis, the rising wedge most commonly forms at the peak of an uptrend. This suggests that it is becoming increasingly difficult for bulls to drive the price higher, as the resistance line (R) becomes steeper. But does the appearance of a rising wedge really guarantee a trend reversal? Let’s explore this further.
How Reliable Are Rising Wedges?
Well-known chart pattern expert Thomas Bulkowski considers the rising wedge one of the worst patterns for trading, especially when it involves bearish breakouts.
His research, based on an analysis of 1,400 rising wedge formations on stock charts, found that this pattern ranks among the least effective in technical analysis.
However, there is an interesting detail: in 72% of cases, the price returns for a retest of the breakout. This means that, despite the relatively low success rate of the pattern itself, traders can use additional confirmations to improve their chances of making successful trades.
Since the rising wedge is relatively common, traders need reliable ways to filter it. Let’s explore how this can be done in practice.
Example of a Rising Wedge Pattern
The chart below shows an example of a rising wedge formed in the gold futures market:
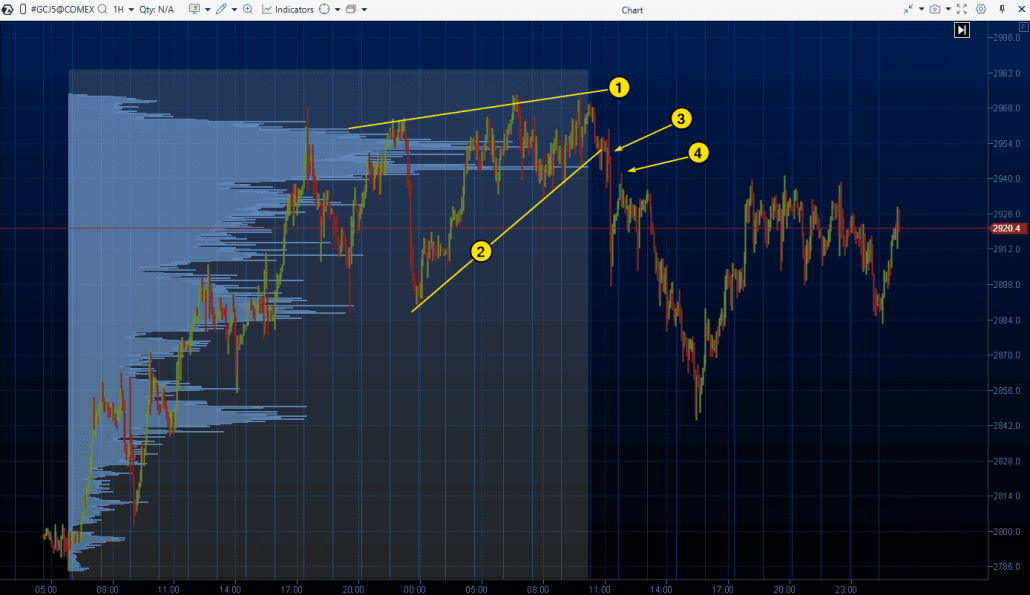
Number (1) marks the resistance line, which reflects the area where buyers lost interest, particularly as the price approached the psychological level of $3,000. This suggests that with each upward movement, the willingness to pay that price decreased, and the momentum behind the trend weakened.
Number (2) indicates the support line, with its steep slope suggesting that demand remained strong during pullbacks.
Number (3) highlights the bearish breakout of the rising wedge pattern. In a volatile market, pinpointing the exact breakout moment can be difficult and carries inherent uncertainty.
Number (4) marks the price rise towards the breakout level, which, in some cases, can be interpreted as a test of the breakout, though with certain qualifications.
Volume-Based Confirmation
In addition to the noticeable spike on the vertical volume indicator, which typically accompanies breakouts at key levels, an essential tool for analysis is the study of horizontal volumes.
When the rising wedge pattern forms, the market profile often shows a distinctive convex shape. In the example above, this occurs between the price levels of $2945 and $2955. What does this indicate?
It could be the footprint of Smart Money. In this case, they met the rising trend, which developed on the left side of the chart, with their limit sell orders. Figuratively speaking, the buying pressure encountered an impenetrable barrier— a wall of selling. This reflects the distribution phase in trading, where Smart Money uses the active demand from retail traders to sell off their assets without causing a significant price drop.
Thus, the market profile can serve as confirmation of the rising wedge pattern, offering valuable information for analysis. This tool can be effectively used not only for strategies related to rising wedges but also in other market situations.
Would you like to learn more about how to use the market profile to confirm patterns and trade effectively? Watch the detailed explanation in the video!
Trading the Rising Wedge Pattern
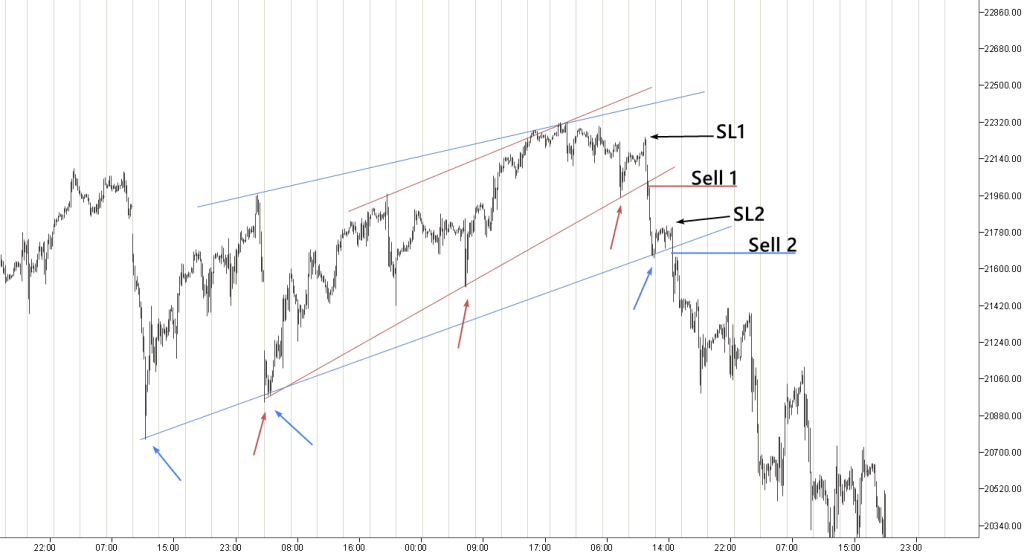
Let’s review the trading principles of the rising wedge pattern using an example. The hourly chart below (representing the E-mini futures on the Nasdaq index) shows the situation that developed at the end of February 2025. In this chart (with some subjectivity involved in identifying chart formations in price movements), two rising wedge patterns can be seen, marked by lines in corresponding colors.
In both cases:
- The lower support lines are marked by three points (indicated by arrows). The third arrow from the right points to the dead cat bounce pattern.
- The upper lines are less clearly defined, and their drawing is more subjective.
Basic Trading Strategy
The basic strategy for trading the rising wedge involves waiting for a break of support, which forms the lower boundary of the wedge. When the candle closes below the support line, it signals the trader to open a short position.
In the example above:
- Sell signals for both patterns are marked roughly at the Sell 1 and Sell 2 levels. The exact timing and price level for entering the position depend on the time frame the trader is using to monitor the candles.
- According to standard guidelines, traders are advised to set stop losses just above the last high within the wedge. In the example above, these levels are marked by the SL 1 and SL 2 arrows, respectively.
Conservative traders may choose to wait for the breakout level to be tested. This is because breakouts are often fast and aggressive, and testing the level can provide a more comfortable decision from a psychological perspective.
For more on the topic, explore our articles:
Finding Price Targets for Rising Wedge Patterns
This topic is not entirely straightforward, as determining take-profit targets involves a certain degree of uncertainty.
Height Projection Method
One common approach to identifying take-profit levels when trading the rising wedge pattern is the height projection method.
Here is how it works:
- Step 1. Measure the height of the pattern at its widest point.
- Step 2. Project this value downward from the breakout level (by default, from the point where the support is broken).
- Step 3. Place the take-profit at the projected level. In most cases, this level will exceed the risk taken on the trade.
The uncertainty primarily stems from the potential inaccuracies in measuring the pattern’s height and determining the exact level of support.
Parallel Channel
Suppose you have identified a bearish breakout of a rising wedge pattern (1–2).
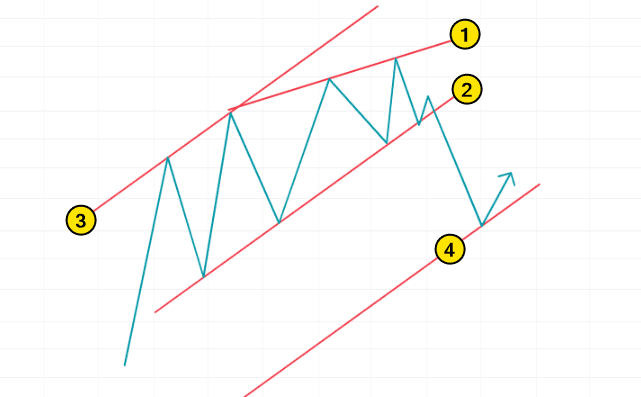
Next, check whether the rising wedge is part of a channel formed by parallel lines (2–3). If this is the case, the lower parallel line (4), positioned at a distance equal to the height of the channel (2–3), can be used as a target level.
For a more detailed explanation of how parallel channels work and how to use them in trading, see this article.
Multiple Target Levels
Another way to set a take-profit target is by placing multiple levels based on Fibonacci ratios, as well as applying other techniques such as a trailing stop.
However, focusing on simple solutions for beginners will often lead to doubts and disappointment. Acting like a professional, on the other hand, means paying closer attention to the broader context (market structure) and making active use of tools for analyzing volume, with a focus on gaining an edge over other market participants.
Helpful articles on this topic:
- Market Structure Analysis in the Smart Money Concept Strategy
- Volume Analysis Indicators: How to Use Them
- How Volume Analysis Works
Next, we will explore how using advanced volume analysis tools can offer valuable insights and help support more informed trading decisions.
Example. Rising Wedge as a Reversal Pattern
Let’s consider an example from the E-mini S&P 500 futures market (see chart below), where lines 1 and 2 indicate a rising wedge pattern that formed following a period of an upward trend.
This example uses a range-based chart. While this approach may not be entirely conventional from the perspective of classical technical analysis, it can provide a clearer and more accessible view, especially for those who are just beginning to study chart patterns.
Number 3 marks the point where the lower boundary was broken. Interestingly, a test of this level occurred the following day.
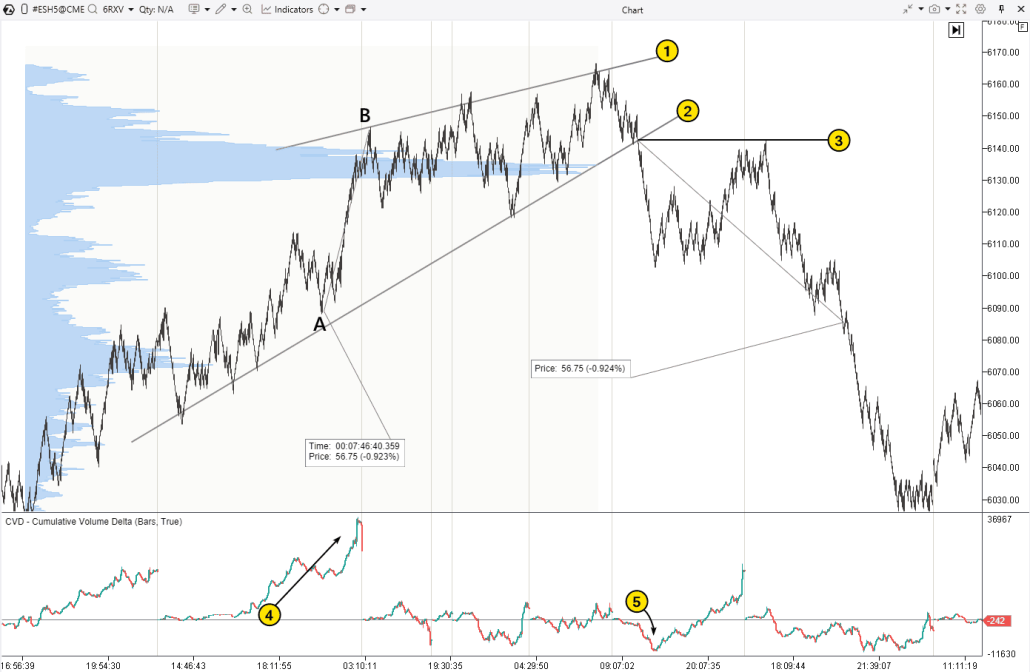
Volume indicator analysis provides valuable information:
- An increase in cumulative delta (4) signals the initiative of market buyers, suggesting a bullish market. This likely occurred in response to the release of positive news.
- Growth slowed in the following days, leading to the formation of a convex shape on the market profile around 6135. Attempts to continue the upward movement failed, and the price returned to the area of high volumes, which, in terms of chart patterns, resulted in the formation of a rising wedge.
- Number (5) highlights the sellers’ aggression as they broke the lower boundary of the pattern, triggering a bearish move. Traders who opened short positions, using the spike in negative delta as confirmation of the breakout, could have benefited from the significant price decline.
In this case, the price reached the take-profit level, calculated by measuring the height from A to B and projecting it downward from the breakout point. The Ruler tool, available on the ATAS analytical platform, is ideal for this purpose.
Example: Rising Wedge as a Trend Continuation Pattern
The following chart (oil futures, NYMEX exchange) emphasizes the importance of context. On the left side, a decline is visible, part of a larger downward trend, and numbers 1 and 2 highlight the narrowing lines that form the rising wedge.
Although the price broke support and fell after reaching the top of the pattern, considering the context, it can be argued that the pattern led not to a reversal, but to a continuation of the trend. It appears as a temporary pause within the overall decline. In other words, the rising wedge formed as a corrective recovery within the bearish trend. In this context, the article on how to identify the end of a correction may be useful.
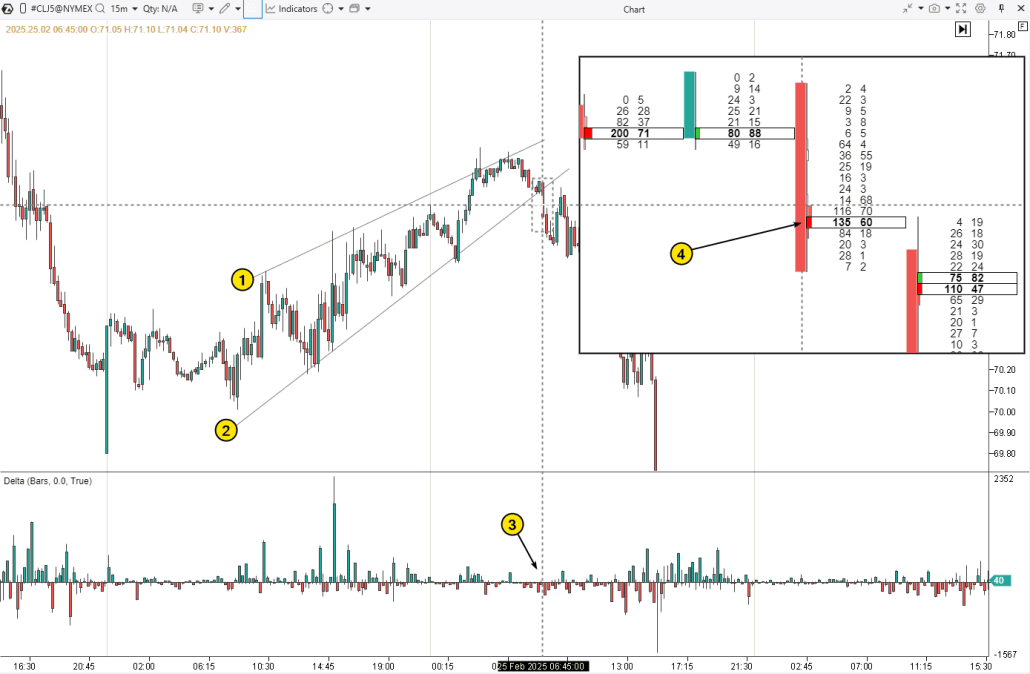
Note that the breakout of the rising wedge was accompanied by an increase in negative values (3) on the Delta indicator (which was significant at the start of the European session). This volume indicates seller activity and confirms the validity of the bearish breakout of the pattern.
Using the ATAS Magnifier tool, we can observe the breakout in footprint format and analyze it in detail. Number (4) shows the “clue” indicating the dominance of sellers at the breakout point. Interestingly, the price rose to these levels about an hour later (for testing) but then reversed downward.
More Best Practices When Using Rising Wedges
The material provided may suggest that trading the rising wedge comes with various challenges, and this is normal for chart patterns in technical analysis.
Consider the Overall Market Context
The rising wedge does not exist in isolation — it is the result of shifts in market sentiment, reflected in the trades of traders analyzing various time frames and considering different sources of information. Pay attention to the market structure — this may lead you to the conclusion that short positions based on the rising wedge pattern are best taken when there are clear signs of weakness in the broader market.
Do Not Be Robotic in Applying Measurements
This relates to the strictness in applying the pattern — if you search only for rising wedges that perfectly match ideal proportions, they are unlikely to appear frequently. Apply more flexibility: use the rising wedge (or another chart pattern) as a foundation, and then add more relevant signals, including volume analysis.
Make Sure the Risks Are Worth It
Before entering a trade based on a rising wedge, evaluate the profit potential and how it relates to the associated risk. It is important to have a well-defined trading plan before opening a position, one that accounts for multiple scenarios. In any case, if the trade results in a loss (as market risks are always present), it should not be a catastrophic one.
Strengthen Your Pattern Trading Skills Using a Simulator
Use the ATAS Market Replay. Practicing in a market simulator is one of the best ways to learn to reinforce your skills. Explore the ATAS functionality to replay historical data in real time, identify chart patterns, and practice trading using the built-in demo account. You can then analyze your mistakes—all without risking real capital.
To try the simulator, download the ATAS platform for free, install and launch it, and then:
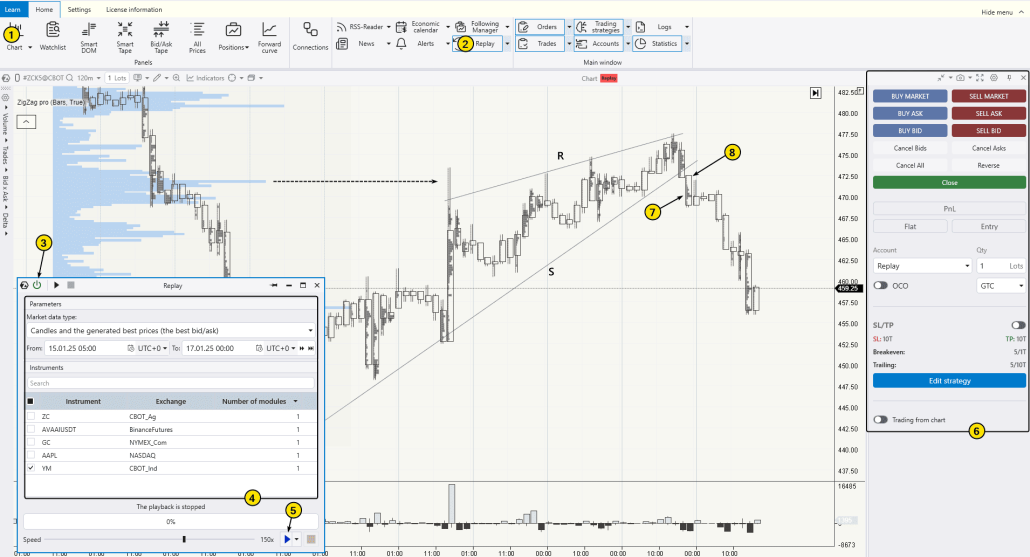
The chart above shows another example of a rising wedge pattern between lines S and R. The insights provided by volume analysis tools are particularly noteworthy:
- The bulge on the profile (local Point of Control), marked with a dashed line, acts as resistance, holding back buying pressure.
- Number (7) indicates that the main trading activity within the candle takes place below line S — a sign of a valid breakout (though not a guarantee). In such cases, the thin profile area (8) often acts as resistance and may serve as a potential short entry zone (from the perspective of the Smart Money Concept strategy, this corresponds to the Fair Value Gap pattern).
We hope you now have a clearer understanding of what a rising wedge is in trading, how to trade it, and whether it is worth trading at all.
FAQ on the Rising Wedge in Trading
What is the best time frame to use with the rising wedge pattern?
The rising wedge can be traded on any time frame. It is commonly believed that the pattern tends to be more reliable on higher time frames (such as the 1-hour, 4-hour, or daily charts), although this is not a hard-and-fast rule.
Is a rising wedge bullish or bearish?
The rising wedge is traditionally viewed as a bearish pattern. However, if the price breaks above the upper boundary, forming a resistance breakout, the pattern may be interpreted as bullish.
What other patterns are similar to the rising wedge?
The rising wedge is the mirror image of the falling wedge. In some cases, price fluctuations can lead traders to identify not only a rising wedge but also a head and shoulders pattern or other chart formations.
What markets are best suited for trading the rising wedge?
As the rising wedge is merely one type of price fluctuation, it can form in any market (stocks, futures, cryptocurrencies, and others). However, the effectiveness of this pattern depends more on the trader’s level of expertise and the tools they employ than on the choice of a specific market.
Conclusion
The rising wedge is a key pattern in technical analysis, often seen as a warning of a potential trend reversal. It typically forms during an uptrend and indicates that supply forces are starting to limit further price increases.
However, it is important to note that the rising wedge does not always lead to a reversal. In some cases, such as when the upper boundary is broken, it may signal the continuation of the bullish trend. As such, this pattern has a dual nature and requires further analysis to confirm its direction. Volume indicators available on the ATAS analytical platform can be very helpful for this confirmation.
Advantages of the Rising Wedge Pattern
✔ Versatility. This pattern can be applied in trading various assets, including stocks, forex, commodities, and cryptocurrencies.
✔ Frequency. If the criteria for identifying the pattern are not applied too strictly, the rising wedge appears quite frequently.
✔ Profit potential. Since trading the wedge involves a breakout from consolidation, it provides an opportunity for traders to enter positions at the beginning of a new trend.
Disadvantages of the Rising Wedge Pattern
✘ Risk of false breakouts. Traders might find themselves selling at the lowest point. Therefore, it is important to consider ways to increase the likelihood of a successful trade, such as by using additional volume analysis indicators or adjusting the strategy to trade the test of the breakout rather than the breakout of the wedge.
✘ The importance of market context. Analyzing the overall market structure and understanding the role of the rising wedge within it can increase confidence in trading decisions. However, this may be challenging for beginner traders.
✘ Subjectivity in interpretation. Identifying and interpreting the rising wedge pattern always involves a degree of subjectivity when analyzing charts.
Access to tick data, Market Replay, footprint charts, and market profile in ATAS enables you to deeply analyze the interaction between price and volume, whether during a rising wedge breakout or in other market scenarios.
Do not miss the next article on our blog. Subscribe to our YouTube channel, follow us on Facebook, Instagram, Telegram or X, where we publish the latest ATAS news. Share life hacks and seek advice from other traders in the Telegram group @ATAS_Discussions or on Discord.
Information in this article cannot be perceived as a call for investing or buying/selling of any asset on the exchange. All situations, discussed in the article, are provided with the purpose of getting acquainted with the functionality and advantages of the ATAS platform.


