
A Market Structure Shift (MSS) occurs when price breaks a key swing high or swing low against the prevailing trend, signaling that market direction may be changing. Traders use MSS to identify potential reversals and look for new entry opportunities, but the pattern alone is not enough — confirmation from market context, liquidity, volume, and order flow helps distinguish a genuine shift from a false breakout.
In the ICT Smart Money Concept (SMC), market structure provides the framework for reading these changes by tracking swing highs, swing lows, and the movement of price between liquidity zones. In this article, we will examine how MSS forms, how it interacts with other ICT concepts, and how ATAS volume analysis tools can help confirm market structure changes.
Disclaimer. ATAS is not affiliated with Michael Huddleston (Inner Circle Trader, ICT) and does not endorse or promote his trading strategies. This article is for informational purposes only, providing an overview of key market structure concepts and shifts. The goal is to demonstrate how ATAS volume analysis tools can enhance the application of the Smart Money Concept in trading.
Start now!
Try ATAS free with no time limit
What Is a Market Structure Shift (MSS) in ICT Trading?
While the creator of the Smart Money Concept (SMC) defines market structure differently from traditional interpretations, they share a common foundation—analyzing the sequence of swing highs (local highs) and swing lows (local lows).
Based on the positioning of these extremes, market structure is classified into three types:\
- Uptrend (Higher Highs and Higher Lows, HH and HL) – each new high and low is higher than the previous one
- Downtrend (Lower Highs and Lower Lows, LH and LL) –each new high and low is lower than the previous one.
- Consolidation (Range/Flat Market) – no clear trend, with price moving within a horizontal range.
A key feature of market structure in the Smart Money Concept is its approach to interpreting price movements, where liquidity plays a central role.
Simply put, in SMC, market structure is a story of how price moves between liquidity zones.
How to Identify a Market Structure Shift
Identifying a Market Structure Shift requires more than spotting a single breakout. Traders need to understand the existing trend, locate the relevant swing points, and then evaluate whether the break is strong enough to suggest a genuine change in market direction.
A practical framework is:
- Define the current market structure. Identify whether the market is forming higher highs and higher lows in an uptrend, or lower highs and lower lows in a downtrend.
- Mark key swing highs and swing lows. These levels form the structure that price must break for an MSS to occur. In ATAS, the ZigZag Pro indicator or a line chart can make major swings easier to identify.
- Watch for a break against the prevailing trend. In a bearish structure, a move above a significant swing high may indicate a bullish MSS. In a bullish structure, a break below a key swing low may indicate a bearish MSS.
- Evaluate the strength of the breakout. A genuine MSS is often accompanied by a fast, impulsive move rather than a weak penetration of the level. In ICT terminology, this type of strong move is often called Displacement.
- Look for confirmation. Volume, Delta, order flow, and the broader liquidity context can help determine whether the break reflects a real shift in market behavior or only a false breakout.
For beginners, the ZigZag Pro and Fractals indicators can help make swing structure clearer, while switching from candlesticks to a line chart can reduce visual noise. In ATAS, you can switch to a line chart by pressing Shift + L.
We covered these tools in more detail in our YouTube video on the SMC cycle.
In this article, we will also use the line chart (to switch from a candlestick chart to a line chart in ATAS, press Shift + L) and the ATAS ZigZag Pro indicator.
Example of Market Structure Analysis
Below is a chart of the ES futures contract for January 2025 (using the Reversal chart type, which provides a clearer view of price swings and adapts more effectively to this instrument’s uneven intraday volatility):
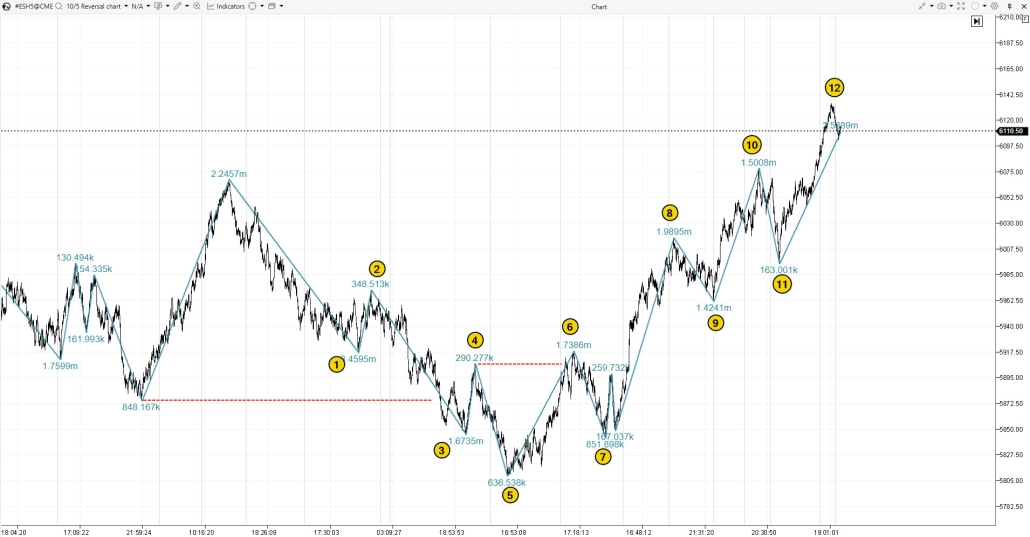
A bearish market structure is observed as the price declines from the peak on the left side of the chart, forming a sequence of LH and LL (1-2-3-4-5).
The peak at (6) is higher than the peak at (4)—this could indicate a shift in market sentiment. In the Smart Money strategy, this pattern is known as a Change of Character.
The price dropped into a liquidity zone below the 5872.50 level, triggering:
- The activation of buyers’ stop-loss orders (sell stops).
- The opening of new short positions as the previous swing low was broken.
- An increase in selling order flow driven by traders reacting to the news backdrop (typically, news tends to be more negative when the price reaches multi-week or multi-month lows).
After Smart Money absorbed the liquidity from those sellers, the price momentum shifted. A bullish structure began to form, with a sequence of HH and HL (6-7-8-9-10-11-…).
Tip. Watch the volume on each price impulse (shown as blue-green numbers). As long as volume is higher on down moves than up moves, the trend remains bearish. When the pattern reverses—meaning volume increases on up moves—the trend turns bullish. This principle is covered in detail in the article “Weis Waves.”
How to Use a Market Structure Shift in Trading
In the Smart Money Concept strategy, a Market Structure Shift (MSS) occurs when a key swing high or swing low is broken in the opposite direction of the current trend.
In the chart above, a bullish Market Structure Shift happened with the formation of the 7→8 impulse. Notice how quickly the price surged, breaking through highs 4 and 6. It almost feels intentional— as if buyers were being kept out of new long positions while sellers were left at a loss… Who knows.
An example of a bearish Market Structure Shift is shown in the screenshot below. This is a chart of Gold futures (GC) from November to December 2024.
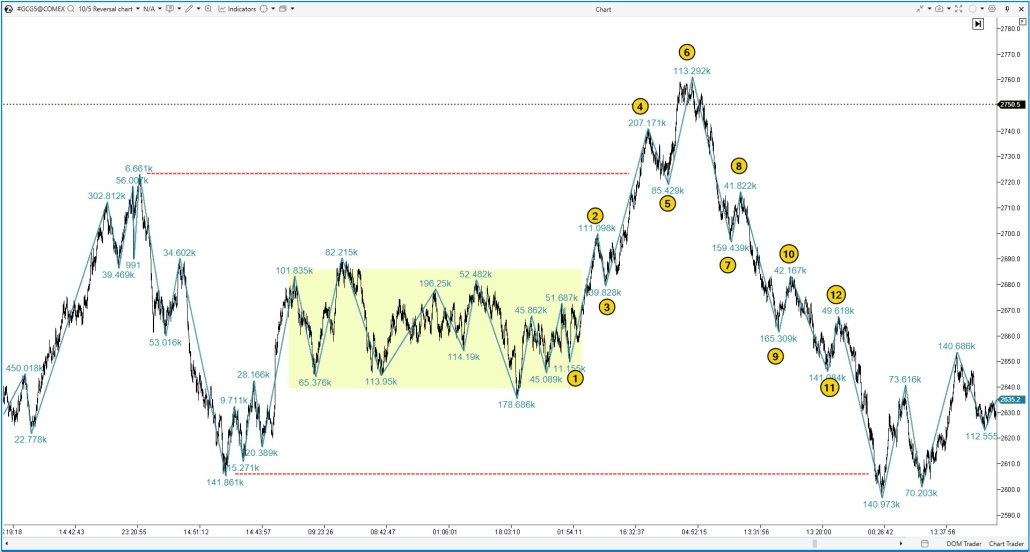
The highlighted area in the center of the chart represents a consolidation zone (flat market), which is one of the forms of market structure. The minor price fluctuations may have indicated that buyers and sellers were equally satisfied with the price level, meaning it was within its fair value range.
Then, likely influenced by news events, a bullish structure formed with a sequence of HL and HH (1, 2, 3, 4, 5, 6). As the price broke above the previous high, it entered a liquidity zone:
- Sellers were forced to close their short positions via stop-losses, triggering buy orders.
- New buyers opened long positions, possibly driven by positive news.
However, once Smart Money had fully utilized this influx of buy orders to establish their short positions, the price was ready to move downward. The 6 → 7 impulse marked a bearish MSS, signaling a trend reversal. After that, a sequence of LL and LH (7, 8, 9, 10, 11, 12, …) began forming, pushing the price into a new liquidity zone below a key previous low.
Notice that once again, the MSS shift happened during a sharp, rapid impulse, followed by only a slight corrective rebound (7→8). Making the right decision (closing a long position in time and opening a short one) was extremely challenging, and fixing a mistake came at a high cost.
Warning. The MSS pattern is simply a signal that traders should be prepared for a potential trend reversal. However, it does not guarantee that a reversal will occur. Future price movements remain unpredictable.
How MSS Works With BOS, ChoCh, and Liquidity
In the Smart Money Concept, MSS is best understood together with liquidity, ChoCh, BOS, and displacement. These concepts describe different stages of how market structure may change or continue.
- Liquidity often provides the context for a potential reversal. Price may move above a previous high or below a previous low, triggering stops and attracting new orders.
- ChoCh (Change of Character) is an early warning that the current structure may be weakening. It occurs when price breaks a structural point against the prevailing trend.
- MSS (Market Structure Shift) provides stronger evidence of a potential reversal, especially when the structural break occurs with a sharp, impulsive move.
- Displacement describes this strong directional price movement. In ICT terminology, displacement can help distinguish a meaningful structure shift from a weak or temporary breakout.
- BOS (Break of Structure) generally confirms continuation once a new directional structure has developed. For example, after a bullish MSS, a subsequent break above another structural high can reinforce the emerging bullish trend.
A simplified sequence may therefore look like this:
Liquidity sweep → ChoCh / MSS → Displacement → new structure → BOS
However, these labels should not be interpreted mechanically. A break of a swing point can fail, so the surrounding liquidity context and the strength of order flow remain important.
Let’s look at the Litecoin futures chart below (January 2025, Binance). We have added the Cumulative Delta indicator to better understand whether structural breaks are supported by actual buying or selling activity.
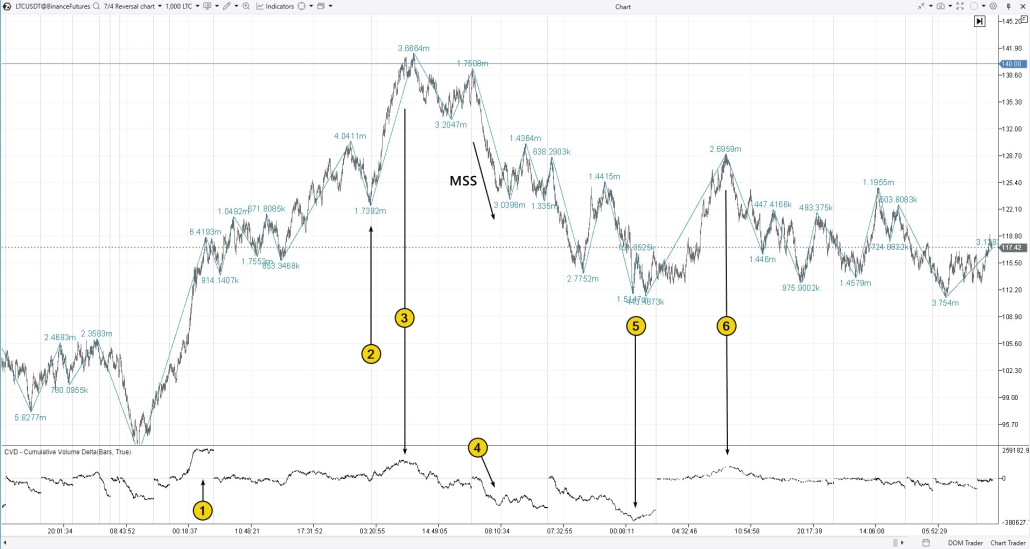
(1) A surge in buying activity on Cumulative Delta accompanies the initial rally, after which a bullish structure develops through a sequence of higher highs (HH) and higher lows (HL).
(2) On a smaller time frame, the decline could appear to be a bearish ChoCh or even an MSS. However, Cumulative Delta shows no significant increase in aggressive selling. This lack of confirmation suggests that the structural break may be weak rather than the beginning of a genuine reversal.
(3) Near the psychological level of $40 per LTC, Cumulative Delta shows another sharp increase in buying activity. In SMC terms, price has entered an important liquidity area where buy-side liquidity can become available as stops are triggered and new buyers enter the market.
(4) The subsequent decline is much more significant. Selling activity increases sharply, while price moves downward with little immediate recovery. This combination of a structural break and strong displacement provides stronger confirmation of a bearish MSS.
(5) Price then moves toward another liquidity zone. Cumulative Delta falls to an extremely low level, indicating intense market selling and what may be interpreted as a selling climax.
(6) The following rise again breaks part of the short-term bearish structure, but it does not develop into a sustained bullish trend. Instead, the market enters consolidation. This illustrates why every ChoCh or structural break should not automatically be treated as a confirmed reversal.
The key distinction is therefore contextual: ChoCh warns that the existing structure may be changing, MSS provides stronger reversal evidence when supported by displacement and order flow, while BOS is generally used to confirm continuation of the newly established structure.
Using Market Structure Shifts With Other ICT Components
Continuing our analysis of LTC/USD, let’s take a look at the peak around $40 per coin. This will help illustrate how other Smart Money Concept elements—such as the Order Block and Fair Value Gap—interact with the MSS pattern.
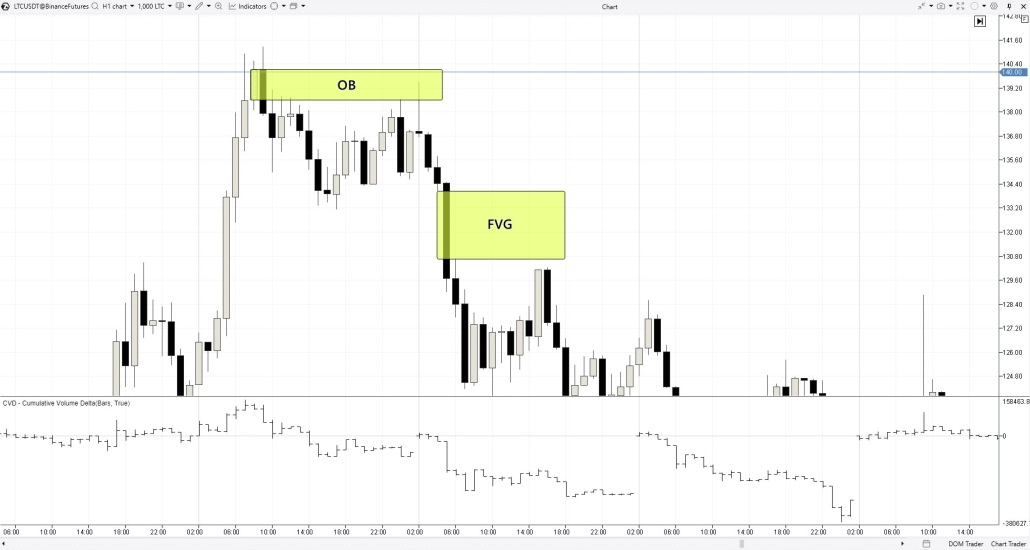
➤ OB is an Order Block zone that acted as resistance and could have been used to open short positions.
➤ FVG (Fair Value Gap) could have also been a short entry point, although, unlike OB, the price did not give a clear retest of this zone.
For more details on key Smart Money Concept patterns, check out our articles:
- What is an Order Block? How to identify and use zones where Smart Money operates.
- What is a Fair Value Gap? Its role in liquidity analysis.
How to Trade MSS, Order Blocks, and FVG
The approach to trading Market Structure Shifts follows a clear sequence of steps:
- Identify the current trend
- Find liquidity zones – key levels where a trend reversal might happen.
- Confirm the structure shift (MSS) after the price reaches the liquidity zone.
- Use OB and/or FVG patterns to identify the best entry for a trade.
In market structure analysis, it is important not just to spot patterns but also to confirm their reliability to avoid false signals. Advanced tools on the ATAS platform can help with this.
Example on the Chart
Let’s take a look at a bullish Market Structure Shift (MSS) on the British pound futures chart (January 2025 data from the CME exchange).
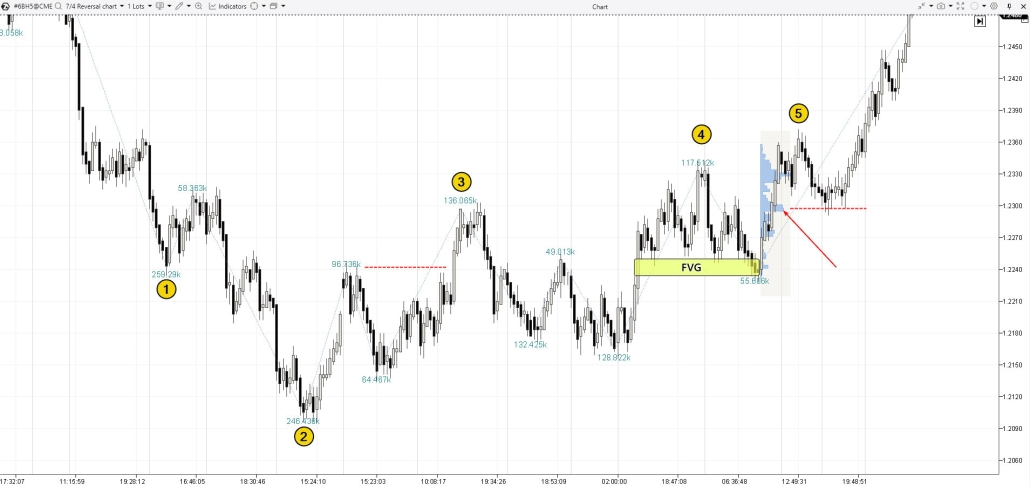
On the left side of the chart, we see a bearish market structure with LH and LL. Trading volumes are high during price declines to the lows (1) and (2), exceeding 200,000 contracts.
However, when the price rises to the peak (3), an HH forms along with the ChoCh pattern. Notice how the volume dynamics shift—volumes increase during upward movements and weaken during pullbacks. This indicates weakening selling pressure, further supporting the idea that the market structure is changing.
As the price moves above peak 3 and continues toward peak 4, there is a case for a bullish structure shift. If the trend is turning upward, traders look for an entry point into a long position. To do so, they identify an FVG area, which in this case acted as a strong support zone and could have served as an entry point for a long trade.
Notice that identifying the FVG during the rise to the peak (5) can be challenging. In this case, using a market profile built for the impulsive price increase can help identify an entry point. The bulge on this profile (indicated by the red arrow) provided a clear level for entering a long position, anticipating that the trend following the bullish Market Structure Shift would continue.
Common Market Structure Shift Mistakes and False Signals
Trading based on market structure comes with certain risks, many of which stem from the subjective interpretation of price movements:
Common mistakes in identifying market structure. False breakouts of swing highs and lows are often mistaken for a Market Structure Shift (MSS), when in reality, they may be trader traps. To avoid falling for them, it is crucial to analyze the market context and look for confirmations.
This is where ATAS, a leading platform for volume analysis, becomes a valuable tool. By analyzing horizontal and vertical volumes, Delta spikes, and footprint patterns, traders can gather solid confirmations to determine whether a Market Structure Shift is genuine or just a trap.
Explore key aspects of market analysis:
- What Is a Bull Trap in Trading? – how to avoid false buy signals.
- What Is a Bear Trap in Trading? – identifying traps for sellers.
- Footprint Patterns – understanding market participants’ actions.
- Vertical and Horizontal Volume Analysis – identifying real market interest.
Psychological pressure. Waiting for structure confirmation or a retest can create emotional stress, often leading to premature entries and impulsive decisions. To avoid these mistakes, it is essential to have a clear trading plan and stick to predefined entry and exit rules.
How Beginners Can Learn to Trade Using Market Structure
Trading is a business that requires strategic thinking, careful planning, and continuous skill improvement. Before risking real capital, it is important to master market analysis and learn to make well-informed decisions.
The ATAS platform can be an invaluable tool on this journey, offering:
- Access to detailed tick history – load and analyze historical data to improve your ability to identify market structure.
- A wide range of indicators – use professional tools and educational resources to accurately confirm Market Structure Shifts (MSS).
- Market Replay functionality – test strategies on historical market data and practice in conditions as close to real trading as possible, without risking capital.
With ATAS, traders gain market transparency, confidence in their analysis, and the ability to develop a professional-level trading system.
To start practicing, download the ATAS platform for free, install, and launch it, and then:
- Open a chart of a financial instrument.
- Click on the Market Replay button in the main ATAS menu.
- Activate the Replay mode (the icon should turn green).
- Adjust settings (date and data type).
- Start the playback and practice analyzing market structure.
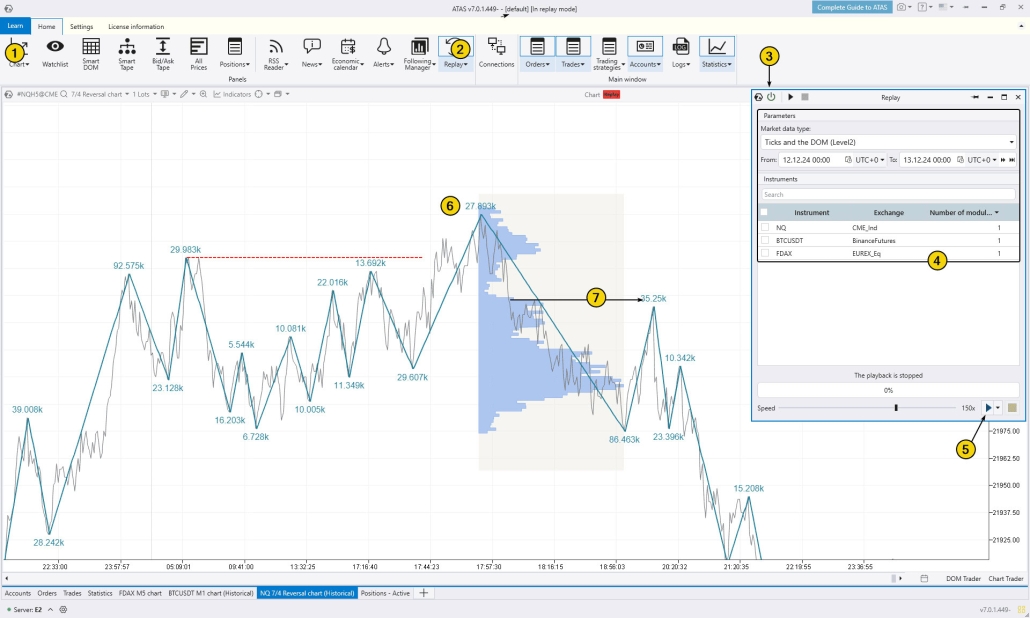
Example. The chart above shows a scenario where the price moved above previous highs into a liquidity zone, forming a peak (6). This was followed by a bearish MSS (notice the increase in volume during the downward move). A short position could have been opened (7) during the FVG test, which in this case was identified not by the classic Smart Money Concept rules but using the market profile—a narrow profile often coincides with fair value gaps.
Market Structure Shift FAQ
MSS refers to a change in market structure, indicating a trend reversal.
➤ Bullish Market Structure Shift:
- The price breaks above previous highs, collecting liquidity (buy stops).
- A strong upward move follows, breaking short-term highs.
- After that, the trader looks for an FVG as an entry point for long positions.
➤ Bearish Market Structure Shift:
- The price breaks below previous highs, collecting liquidity (buy stops).
- A sharp decline follows, breaking short-term lows.
- Traders then look for an FVG as an entry point for short positions.
Simply put, the process involves two steps:
- Identify key swing highs and swing lows.
- Wait for a breakout of these levels in the opposite direction of the current trend.
In reality, price movements are more complex than a simple zigzag pattern. That is why traders should carefully analyze the market context and use volume analysis tools to confirm that the observed MSS is legitimate.
ICT (Inner Circle Trader) is Michael Huddleston, an American trader and creator of a popular YouTube channel where he teaches his Smart Money Concept (SMC) strategy. His approach is based on analyzing the actions of major market players and includes the analysis of liquidity zones, market structure, FVG, Order Blocks, and the idea that market behavior follows algorithmic patterns.
Learn more about ICT and the SMC concept in the article: What Is Smart Money Concept and How Does the ICT Trading Strategy Work?
The difference between MSS and BOS is as follows:
- MSS is a reversal pattern. It signals a trend change when the price breaks a key swing high or low.
- BOS is a trend continuation pattern. It confirms the ongoing trend when the price breaks a level in its direction.
Conclusion
A Market Structure Shift (MSS) can help traders recognize when the existing trend may be weakening and a new directional move could be developing. However, an MSS should not be treated as a standalone reversal signal. Its value increases when the structural break is supported by the broader market context, liquidity behavior, displacement, volume, Delta, and order flow.
The key takeaway is to combine market structure with confirmation rather than react to every breakout. Tools available in ATAS can help evaluate whether a shift is supported by real buying or selling activity, while a clear trading plan, predefined risk limits, and disciplined position management remain essential when applying MSS in practice.
Download ATAS. Once you install the platform, you will automatically get the free START plan, which includes cryptocurrency trading and basic features. You can use this plan for as long as you like before deciding to upgrade to a more advanced plan for additional ATAS tools. You can also activate the Free Trial at any time, giving you 14 days of full access to all the platform’s features. This trial allows you to explore the benefits of higher-tier plans and make a well-informed purchasing decision.
Information in this article cannot be perceived as a call for investing or buying/selling of any asset on the exchange. All situations, discussed in the article, are provided with the purpose of getting acquainted with the functionality and advantages of the ATAS platform.
Subscribe
Get the latest ATAS news delivered conveniently