Fair Value Gaps (FVG) are impulse price movements caused by an imbalance between buyers and sellers.
This article provides a practical guide with examples of what a FVG is, how to identify it on a chart, and how to use this pattern in trading. You will also learn how to apply a strategy using the Fair Value Gap indicator and volume analysis tools to make better trading decisions.
Disclaimer. The ATAS company is not affiliated with Michael Huddleston (Inner Circle Trader) and does not promote or endorse his trading strategies. This article explores the popular Fair Value Gap (FVG) pattern among traders and discusses how the tools on the ATAS platform can be useful for trading the FVG model.
Start now!
Try ATAS free with no time limit
What Is ICT Fair Value Gap (FVG) in Trading?
The Fair Value Gap (FVG) was developed by Michael Huddleston, a trader and analyst from the USA, also known as The Inner Circle Trader (ICT).
He has a popular YouTube channel where he promotes his Smart Money Concept, which includes the Fair Value Gap setup.
The Fair Value Gap is a pattern made up of three candles:
- A Bullish Fair Value Gap forms on a second rising candle between the high of the first candle and the low of the third candle, without any overlap;
- A Bearish Fair Value Gap forms on a second declining candle between the low of the first candle and the high of the third candle.
Although ICT prefers not to trade cryptocurrencies, his pattern can be applied across various timeframes in forex, stock, and commodity markets. Examples of both bullish and bearish Fair Value Gaps are shown below on a Bitcoin futures chart.
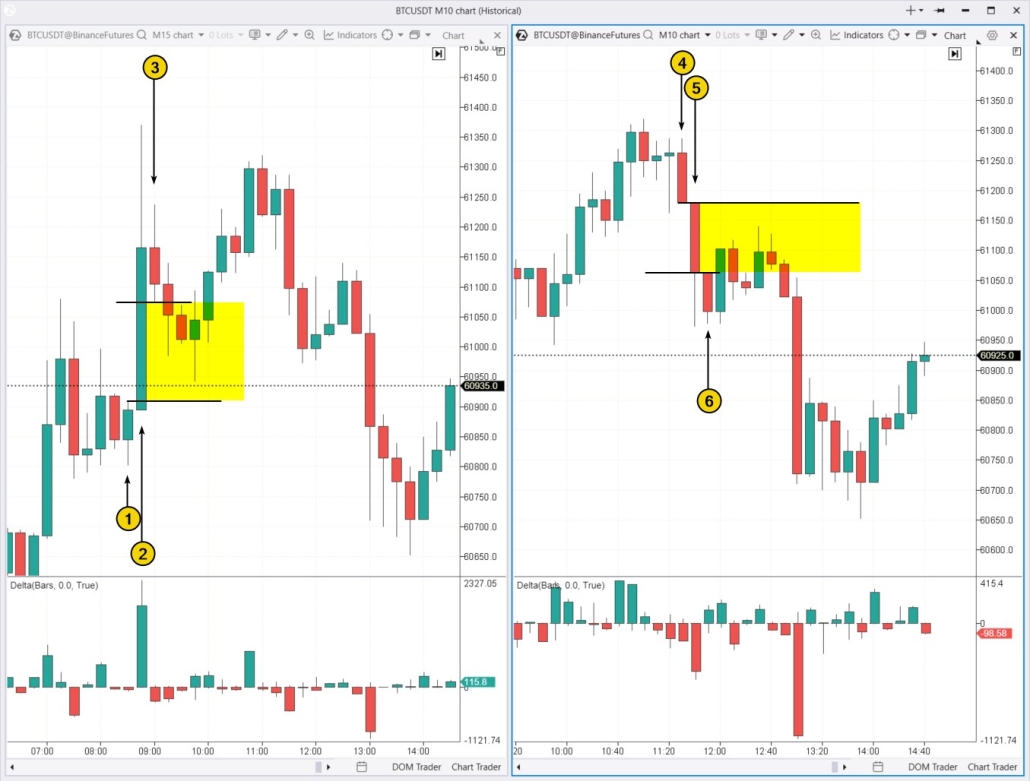
On the left, you see a Bullish Fair Value Gap formed by candles 1–2–3. The gap (highlighted in yellow) is the area between the high of candle 1 and the low of candle 3.
On the right, you see a Bearish Fair Value Gap formed by candles 4–5–6. The concept is the same but in reverse.
These examples show how Fair Value Gaps are used in trading to enter positions during pullbacks in the direction of the main trend.
Example of the Fair Value Gap from Inner Circle Trader
In the screenshot below from YouTube, Michael Huddleston (ICT) demonstrates his Fair Value Gap pattern on an E-mini futures chart for the Nasdaq 100 index:
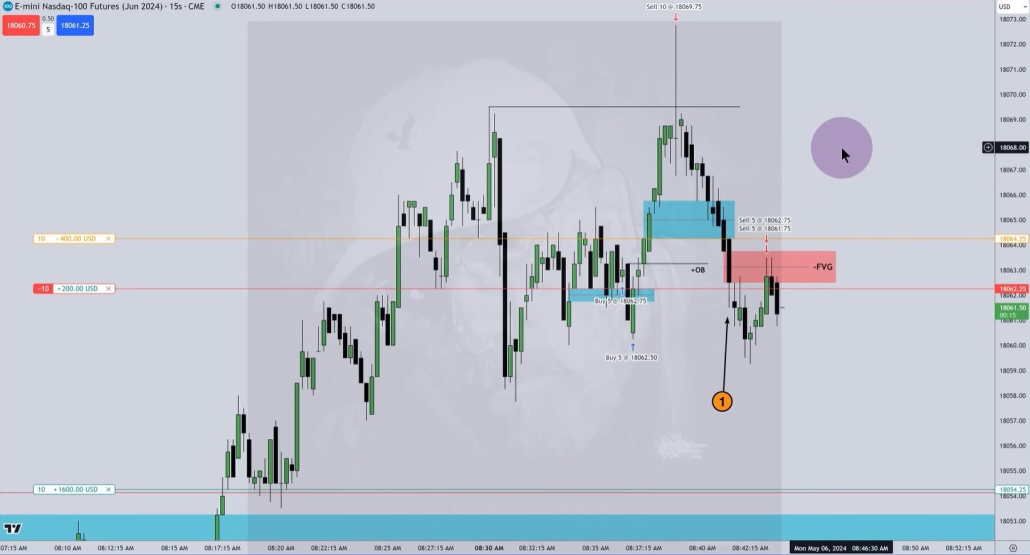
The Bearish Fair Value Gap is shown with a red rectangle, it appeared when the price was easily declining on candle (1). When the price later returned to the FVG area, Michael opened a short position (indicated by the red arrow down), setting a stop-loss just above the upper edge of the gap.
For a more detailed explanation on identifying Fair Value Gap zones, check out this video on our channel:
Let’s move on to trading based on Fair Value Gap signals.
What Does a Fair Value Gap Signal in Price Action?
Let’s examine two Fair Value Gap patterns on a Nasdaq 100 futures chart to understand how a FVG works.
Vertical arrows indicate spikes in positive and negative values on the Delta indicator during the formation of the Bullish and Bearish Fair Value Gaps, respectively:
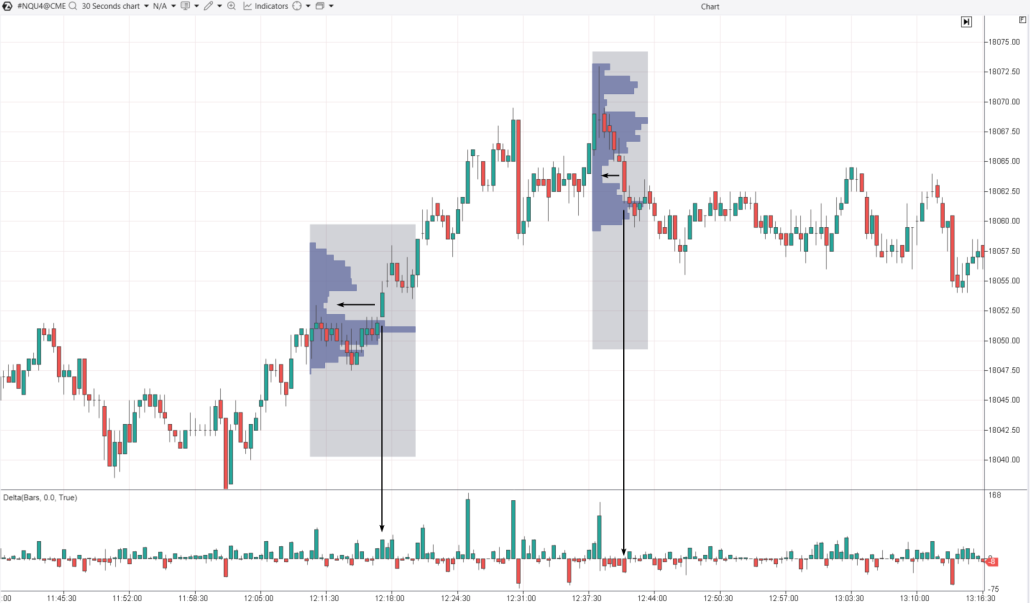
Next, we will add two market profiles to assess their shape when the Fair Value Gap forms on the candles. We notice (marked with horizontal arrows) that in both cases the profile was narrow, indicating that the price moved quickly without staying at certain levels.
This suggests an imbalance between buyers and sellers. Due to these pricing variables, there is a “gap” in the asset’s value to a zone where supply and demand are more balanced.
When trading the Fair Value Gap pattern, the strategy relies on the idea that the imbalance is still present and that the price will keep moving in its initial direction.
How to Identify Fair Value Gap on a Chart
You can identify Fair Value Gaps using just a candlestick chart (ICT trades without any indicators). However, to make confirmation easier and improve analysis accuracy, ATAS platform users can use:
✔ Fair Value Gap Indicator – this tool automatically detects and highlights Fair Value Gaps on the chart.
✔ Volume Profile – as mentioned earlier, a narrow profile can confirm an imbalance between buyers and sellers.
✔ Delta Indicator – its spikes, as shown before, can confirm that one side of the market has become more active, which creates an imbalance.
✔ Stacked Imbalance Indicator – it analyzes the ratio of market buys and sells within the candle levels and identifies (based on specified criteria) areas where one side’s trades significantly outweigh the other.
Example. The screenshot below shows three examples of Fair Value Gaps on a 1-minute chart for E-mini Nasdaq futures:
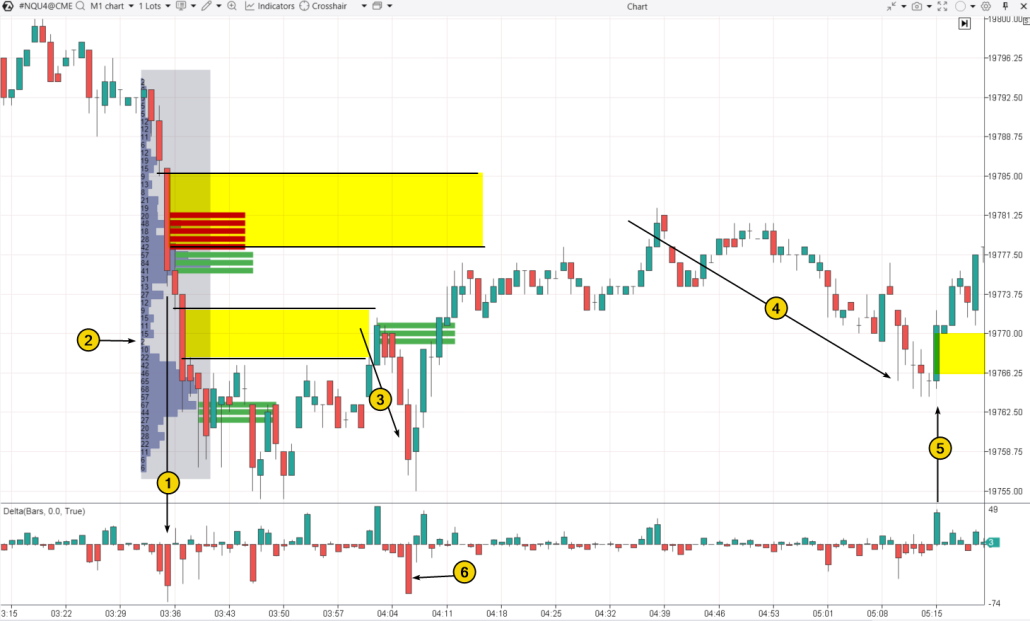
The first Fair Value Gap is bearish. It formed during a decline between the low of the 03:34 candle and the high of the 03:36 candle, with the price dropping easily from around 19785 to 19776. The advantage of sellers is also confirmed by:
- a spike in negative Delta;
- red bars indicated by the Stacked Imbalance Indicator.
Interestingly, the green bars on the 03:36 candle show buyer activity, suggesting these buyers might have been trapped.
Shortly after, a second Bearish Fair Value Gap formed, confirmed by a narrow profile (2). This indicates that there were few trades, likely due to a lack of buyers.
The reaction to the second FVG was a price decline (3). The start of this movement could be indicated by the green bars from the Imbalance Indicator.
The price reaction to the first FVG was also a decline (4). A possible signal for the start of this move was the spike in positive Delta on the 04:38 candle.
Notice that the decline (4) ended with the formation of the third FVG (5), this time a bullish one. The spike in sales (6) near 19766.25, which did not lead to a further price drop (a failure of the bears → a potential bullish signal), indicated that the bulls might try to take control.
How to Trade FVG: Step-by-Step Fair Value Gap Strategy
After reviewing how to identify the three-candle FVG pattern, let’s go over the trading rules for Fair Value Gaps.
Step 1. Identify the pattern. When identifying Fair Value Gaps, indicators such as Delta, Volume Profile, and Stacked Imbalance can be helpful. Other indicators, like Speed of Tape, might also be used to show high trading activity during the formation of the FVG pattern.
Step 2. Plan your entry.
You can enter a position by:
- Placing a limit order within the FVG zone;
- Waiting for the price to return to the FVG zone and then confirming a reversal that suggests the price will continue in the direction of the initial move. Confirmation can come from indicator signals, footprint analysis, or reversal patterns on candles like Renko or Range.
Step 3. Set your exit targets.
A stop-loss can be effectively placed outside the FVG.
For take-profit, the level is set based on your judgment. For instance, if you identify a Bearish FVG, a good option might be to set the take-profit near significant support below, ensuring that the potential reward is several times greater than the risk.
Example of FVG on a Footprint Chart
In the screenshot below, the Bearish Fair Value Gap (on the left) and the Bullish Fair Value Gap (on the right) are highlighted in yellow. This is the E-mini NQ futures market, CME exchange data.
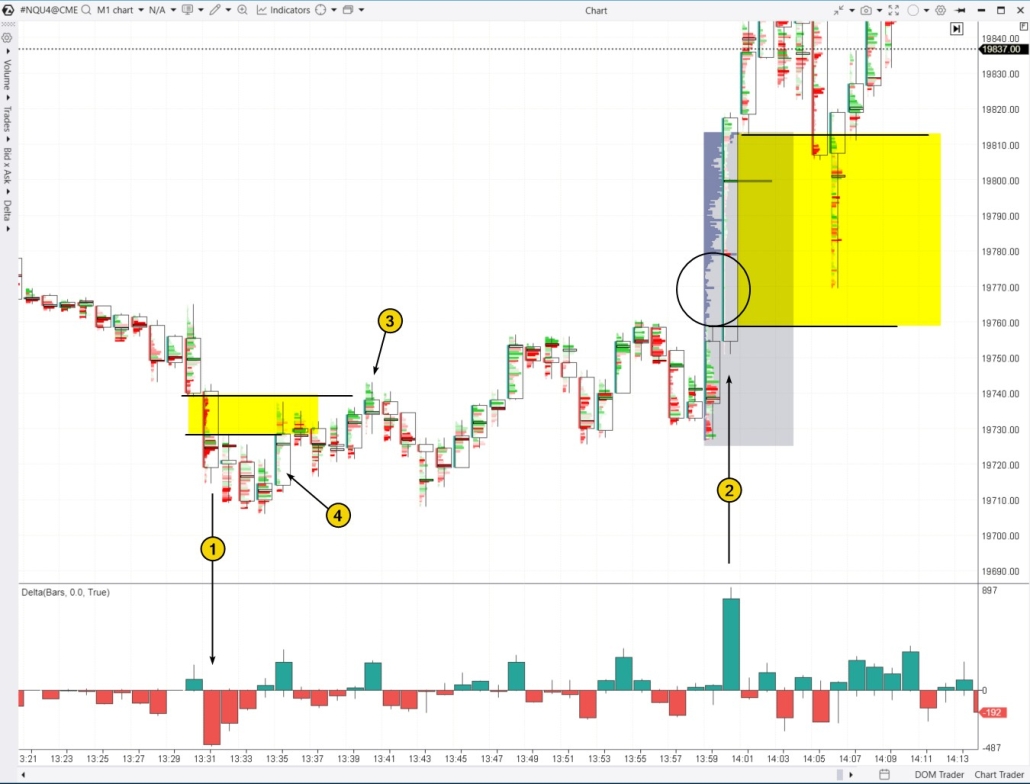
Number (1) shows a sharp price drop, forming a Fair Value Gap pattern. The dominance of sellers is indicated by the bright red clusters within the candle and the spike in negative delta. When the price reached this zone, it struggled to push higher later on. The bright green clusters on the footprint are particularly notable (indicating trapped buyers). From that point, the price began to fall, eventually reaching the area of a smaller Bullish Fair Value Gap (4).
Later, likely due to the release of significant economic news, a Bullish Fair Value Gap pattern (2) formed. The circle on the profile highlights that during the sharp price rise, there were few trades executed, signaling a lack of sellers. When the price returned to the thin profile area in less than 10 minutes, this could have been used as a setup for entering a long position, expecting the bullish momentum to continue.
Fair Value Gap on AAPL Stock Price Chart
Here is an example of a sell setup using the Fair Value Gap pattern on an intraday chart:
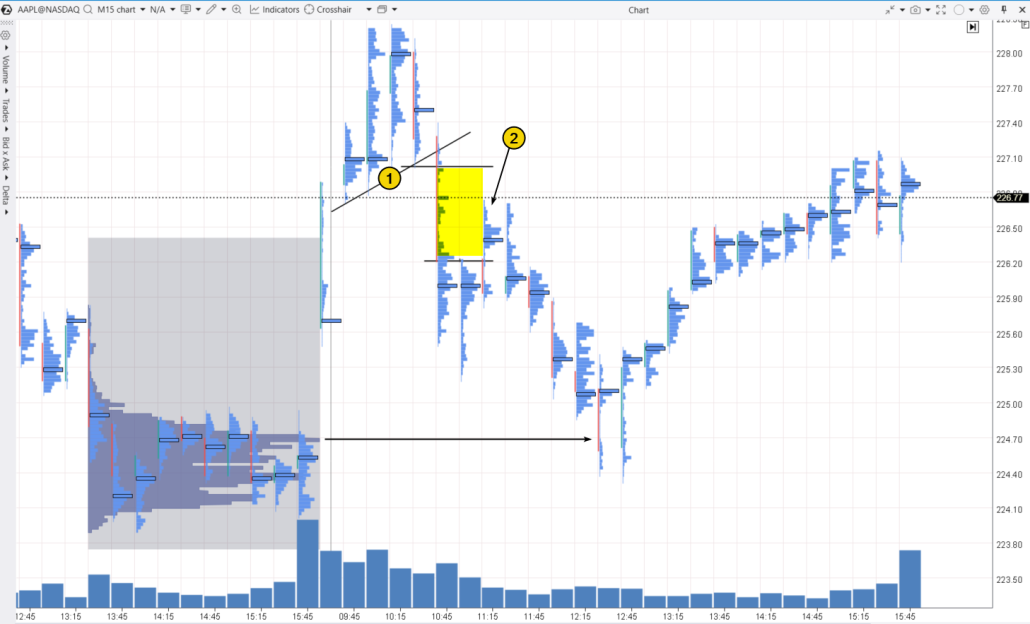
On August 23, 2024, the market sentiment was initially positive: AAPL stock opened with a bullish gap and found support from the trendline (1). However, the situation quickly reversed.
At 10:45, the price sharply declined, forming a Bearish Fair Value Gap, confirmed by a thin volume profile.
When the price retraced upwards (2), this provided a potential short entry opportunity, with a stop-loss placed just above the yellow zone. A suitable take-profit level could be set near the high-volume area formed at the end of the previous trading day around $224.70 (marked by a horizontal arrow).
Inverse Fair Value Gap (IFVG): When an FVG Flips
A Reverse (Inverted) Fair Value Gap occurs when a FVG area previously seen as support or resistance changes its role and starts acting in the opposite way. It is similar to how a support level can turn into resistance once broken, and vice versa.
An example of an Inversion Fair Value Gap. Below is a 15-minute chart of Bitcoin’s price.
Candle (1) shows a sharp price spike, forming a Fair Value Gap (highlighted in yellow).
As indicated by the bright green clusters (2), buyers were dominant just below the $61k level.
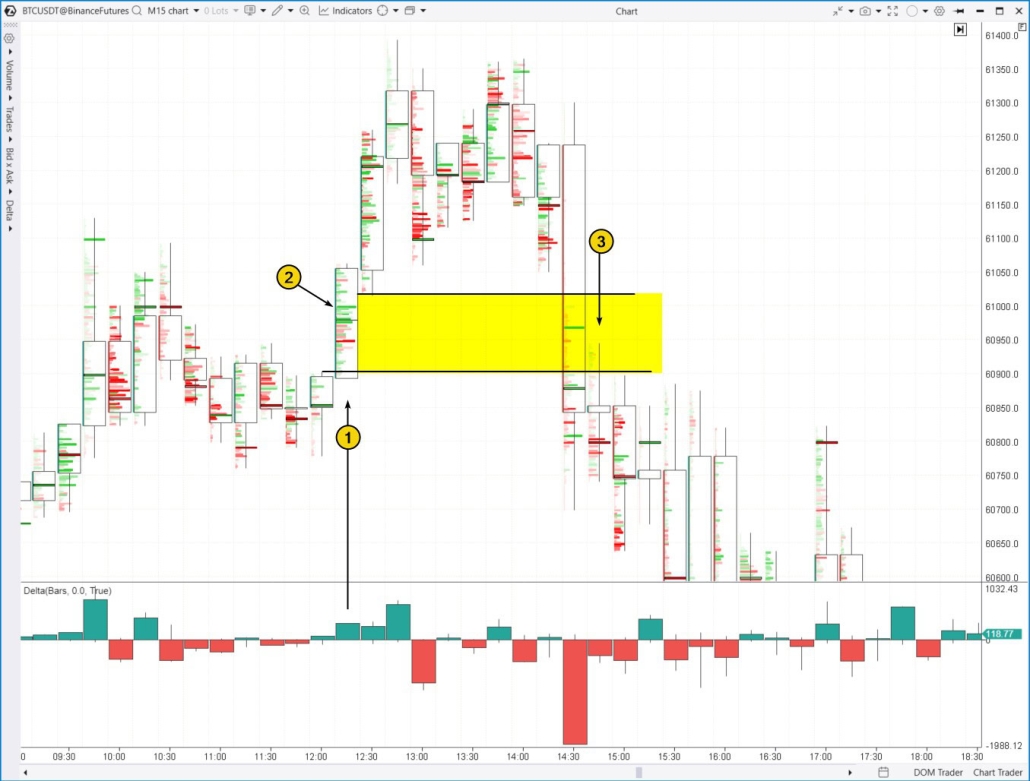
However, the bulls could not maintain momentum after pushing the price above $61k. The price held at this level for several candles but dropped to $60,700 on the wide 14:30 candle.
This breakdown through the yellow FVG zone caused it to act as resistance. The failed bullish Fair Value Gap turned into a bearish pattern, as shown by candle (3) and the following candles.
FAQ
Gap Trading is a strategy based on the difference between a stock’s closing and opening prices. Gaps often act as key support or resistance levels for price movements.
A Fair Value Gap (FVG) refers to a zone on the chart where the price moves easily due to an imbalance between supply and demand. Once this imbalance levels out, price movement tends to slow, and the FVG area often acts as support or resistance.
A Fair Value Gap can be either bullish or bearish, depending on the direction of the price movement.
The best timeframe for identifying a FVG depends on your trading style, but daily and hourly charts are commonly used by traders. For example, you can spot a Fair Value Gap on a 30-minute candlestick chart and then switch to 3-minute footprint charts to look for reversal signals within the FVG.
Fair Value Gaps can be identified in crypto, forex, and futures markets because the pattern reflects a rapid price movement with limited trading activity between certain levels. However, an FVG should not be treated as a guaranteed reversal or continuation signal. Its reliability depends on market context, volatility, timeframe, and whether the zone is supported by additional confirmation such as volume, Delta, footprint data, or market structure.
Order blocks and Fair Value Gaps are both commonly used within ICT and Smart Money concepts to identify areas where price may react. An order block usually marks a price zone associated with strong buying or selling activity before an impulsive move, while an FVG highlights the imbalance created during that move. When an order block and a Fair Value Gap overlap or appear close to each other, traders may consider the area more significant, but additional confirmation is still necessary before entering a trade.
ATAS provides a specialized Fair Value Gap indicator that highlights areas matching FVG criteria. However, in practice, you may find that market buy and sell imbalances are better assessed using tools like market profiles, footprint charts, the Stacked Imbalance indicator, and other volume analysis tools.
How to Learn Trading Using Fair Value Gap Patterns
While the Fair Value Gap may seem like a straightforward 3-candle pattern, several challenges can arise in practice:
- zones formed by this pattern may appear too frequently;
- zones may be either too narrow or too wide;
- the pattern may produce false signals.
This creates the need for additional checks using volume analysis tools to confirm the presence of a buyer-seller imbalance.
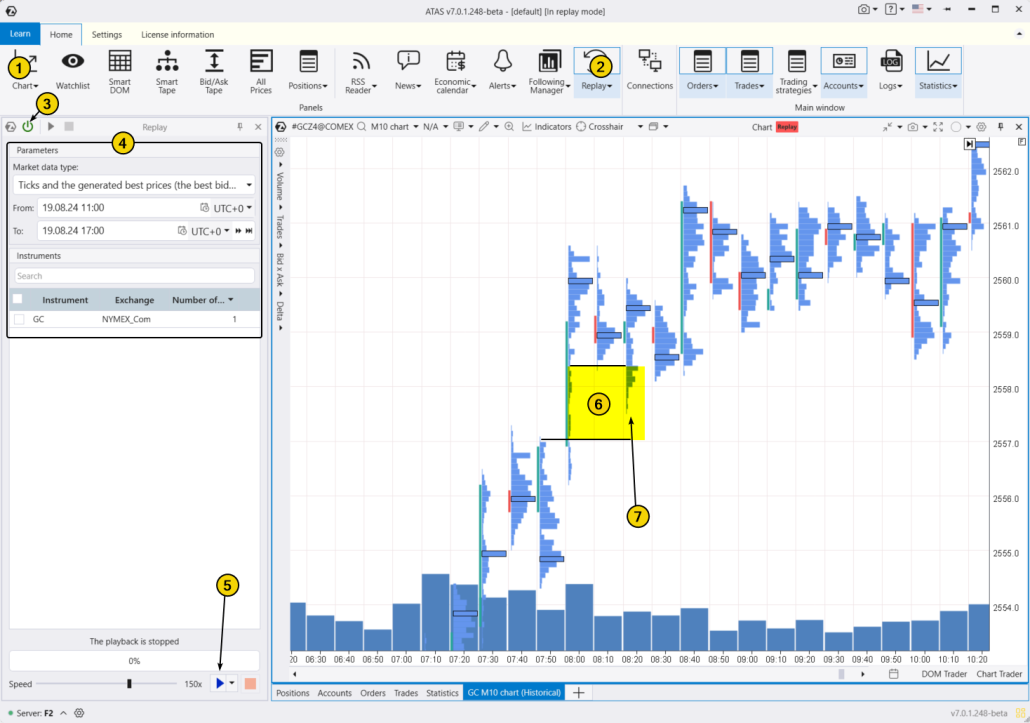
To see whether you can profitably trade using the Fair Value Gap pattern, use the ATAS Market Replay simulator for traders. This module of the ATAS platform uses historical data to recreate real-time trading conditions. There is no financial risk involved.
To try the simulator, download the ATAS platform for free, install, and launch it, and then:
- Open a chart of a financial instrument.
- Click on the Market Replay button in the main ATAS menu.
- Activate the Replay mode (the icon should turn green).
- Adjust settings like date and data type if needed.
- Start the playback and monitor when a Fair Value Gap appears on the chart to open a position during its test.
In the gold price chart example below, the FVG zone is highlighted in yellow (6) and is confirmed by a narrow profile. You can also see a test (7) of the zone where the thin profile indicates an ongoing shortage of gold sellers around the 2558 level — this can be used as a setup for entering a long position.
When practicing trading patterns in the Market Replay simulator, you can:
- adjust the playback speed, and pause;
- analyze footprint charts;
- use over 400 indicators: for example, Delta or Speed of Tape can help you identify the Fair Value Gap pattern;
- use Chart Trader and other features to trade on the built-in demo Replay account and then analyze your performance;
- use drawing objects, for example, mark support and resistance levels;
- use exit strategies;
- do much more to master the use of buyer-seller imbalances.
ATAS enables you to load tick-by-tick data from cryptocurrency, stock, and futures markets, providing a comprehensive basis for analyzing price and volume interactions. This helps refine your trading strategy by identifying key patterns.
Pros and Cons of FVG Trading
Fair Value Gaps provide a simple way to visualize areas where price moved rapidly because of an imbalance between buyers and sellers. They can help traders find potential pullback entries in the direction of an existing move, but an FVG alone does not guarantee that price will react to the zone.
The main advantages and limitations of FVG trading are summarized below:
| Advantages | Potential limitations |
|---|---|
| Clear price zones. FVGs create visually defined areas that can be used to plan entries, stops, and potential targets. | False signals. Price can move through an FVG without reacting or continuing in the expected direction. |
| Useful for trend entries. A retracement into an FVG may provide an opportunity to join an existing directional move. | Context matters. An FVG is less meaningful when analyzed without the broader trend, market structure, liquidity, and volatility conditions. |
| Works across different markets and timeframes. FVG patterns can be observed in futures, stocks, forex, and cryptocurrencies. | Too many zones may appear. On lower timeframes, traders may find multiple overlapping FVGs, making it difficult to determine which ones are relevant. |
| Can be confirmed with volume analysis. Delta, Volume Profile, footprint charts, and imbalance indicators can provide additional information about buyer and seller activity around the zone. | Risk parameters are not fixed. The FVG concept does not provide universal rules for stop-loss or take-profit placement. |
| Easy to identify visually or with an indicator. Traders can mark the three-candle formation manually or use an FVG indicator. | Requires testing and experience. Traders need to determine which FVG setups fit their market, timeframe, and trading approach. |
For this reason, Fair Value Gaps are generally more useful as part of a broader trading setup than as a standalone entry signal. Combining the pattern with market structure, volume behavior, and predefined risk management can help filter lower-quality setups.
Best Tools for FVG Trading in ATAS
ATAS provides several tools that can be combined into a practical Fair Value Gap workflow. Instead of relying only on the three-candle pattern, traders can use volume and order flow data to examine how the imbalance formed, what happens when price returns to the zone, and whether buyers or sellers are gaining control.
| ATAS tool | Role in an FVG workflow | How traders can use it |
|---|---|---|
| Fair Value Gap Indicator | Find FVG zones | Automatically identifies and highlights areas that meet the Fair Value Gap criteria, making it easier to monitor multiple setups on a chart. |
| Volume Profile | Evaluate the initial imbalance | A thin volume profile inside the impulse can show that price moved quickly through certain levels with relatively little trading activity. |
| Delta | Measure buying and selling pressure | Strong positive or negative Delta during FVG formation can help assess which side was more aggressive during the impulse. |
| Footprint Chart | Analyze the retest | When price returns to an FVG, footprint data helps traders examine activity at individual price levels and look for signs of absorption, trapped traders, or a shift in order flow. |
| Stacked Imbalance | Confirm directional pressure | Highlights consecutive price levels where market buys or sells significantly dominate, providing additional context during the formation or retest of an FVG. |
| Market Replay | Test the setup before using it in live markets | Replays historical tick data so traders can practice identifying FVGs, observing retests, testing confirmations, and reviewing different entry and exit rules without financial risk. |
A practical workflow could therefore be: identify the FVG → assess the impulse with Delta and Volume Profile → wait for a retest → analyze the reaction with Footprint and Stacked Imbalance → test the setup repeatedly in Market Replay.
Using several tools does not make an FVG signal automatically reliable. Their purpose is to provide additional information about the market activity behind the pattern and help traders make more structured decisions instead of entering solely because price has returned to a Fair Value Gap.
Conclusions
The Fair Value Gap (FVG) trading strategy takes advantage of opportunities that emerge from new impulse movements. Despite having “Gap” in its name, the FVG pattern on intraday charts is not actually a gap. Instead, it is usually recognized as a three-candle formation where the second candle is the widest.
The key feature of the Fair Value Gap trading strategy is that it is based on market imbalances, enabling you to better track the prevailing market sentiment.
Download ATAS. It is free. Once you install the platform, you will automatically get the free START plan, which includes cryptocurrency trading and basic features. You can use this plan for as long as you like before deciding to upgrade to a more advanced plan for additional ATAS tools. You can also activate the Free Trial at any time, giving you 14 days of full access to all the platform’s features. This trial allows you to explore the benefits of higher-tier plans and make a well-informed purchasing decision.
Information in this article cannot be perceived as a call for investing or buying/selling of any asset on the exchange. All situations, discussed in the article, are provided with the purpose of getting acquainted with the functionality and advantages of the ATAS platform.
Subscribe
Get the latest ATAS news delivered conveniently