In the new ATAS version, we focused on things that save time when working with data. Install Latest 8.0.12 and you’ll be able to:
- Track your account status faster,
- Manage positions more accurately,
- Mark market structure more conveniently
- Keep even the smallest activity shifts in focus thanks to compact widgets.
But first, let’s break down how to integrate the new capabilities into your analytical system.
Start now!
Try ATAS free with no time limit
Cross-Trading: Analyze E-mini, Send Orders on Micro
If you’ve ever worked with futures, you know this pain. The ES chart gives you a clean, informative picture: high liquidity, a readable footprint, and clear activity from large participants. But margin requirements don’t always let you enter. Switching to MES lowers the entry threshold, but the data quality isn’t the same: volumes are smaller and the structure is less pronounced.
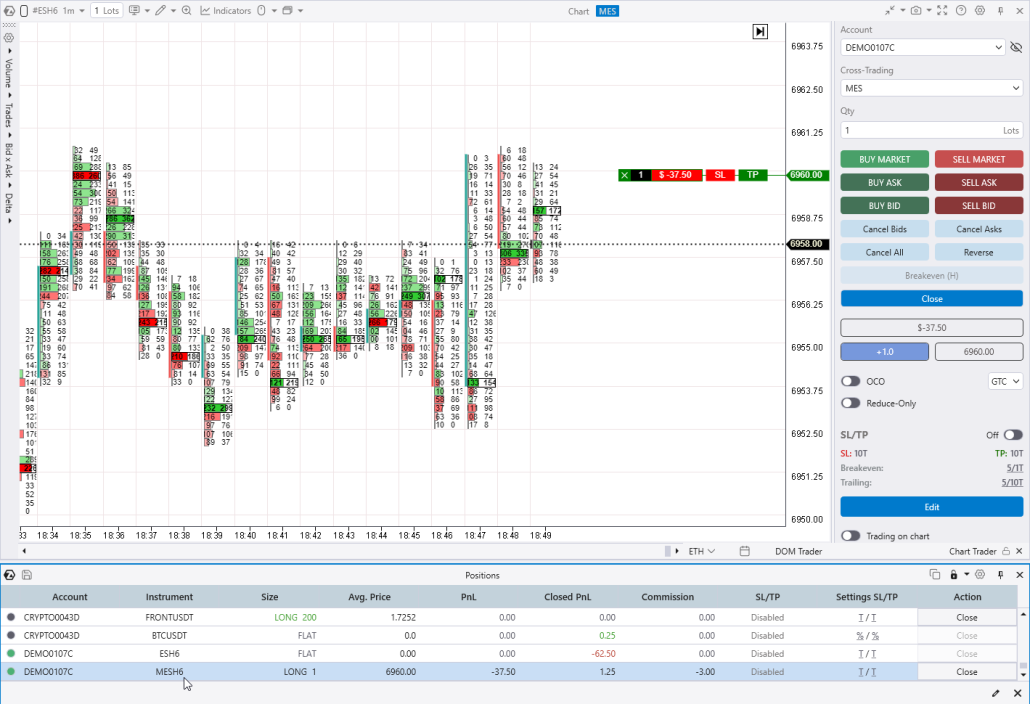
Cross-Trading solves this. The feature links two instruments: you analyze ES and manage orders directly on its chart, while execution goes through the MES infrastructure. Since ES and MES prices are correlated close to 100%, your analysis quality stays at the level of a liquid instrument—while the notional position size is 10x smaller.
How to enable it:
- Go to the platform’s General settings → check Cross-trading.
- Open Chart Trader on the E-mini chart → in the menu that appears, select the corresponding micro ticker.
- A confirmation label will appear in the window header, and Bid/Ask from the micro futures market will start streaming next to the price.
Make sure everything works as expected. As soon as you place a limit order on the main chart, it’s instantly duplicated on the micro contract. You don’t need to keep the MES chart open—the order will be sent there automatically, even if you only have ES open.
For beginners, this is a real gift: you learn on a real market with a “proper” chart, but with beginner-level risk.
Protective Orders Based on Predefined Parameters
We updated the SL/TP block in Chart Trader to make position management easier:
Previously, after opening a position you had to manually place stop and take-profit markers on the chart. In a tense moment, that’s an extra step that’s easy to do inaccurately. Now you can configure protective order behavior in advance—Stop Loss and Take Profit will be placed automatically at the moment you open a position, using the parameters you set.
How to enable it:
- In Chart Trader, check the boxes next to SL and TP.
- Switch the toggle to ON.
- Set the desired values in ticks or percent.
- Open a position manually—protective orders will appear on the chart automatically.
You can edit parameters before opening a position. After opening—via a modal window. If you need to adjust levels after entry, that’s still available through the modal window.
Widgets for Analyzing Market Pressure
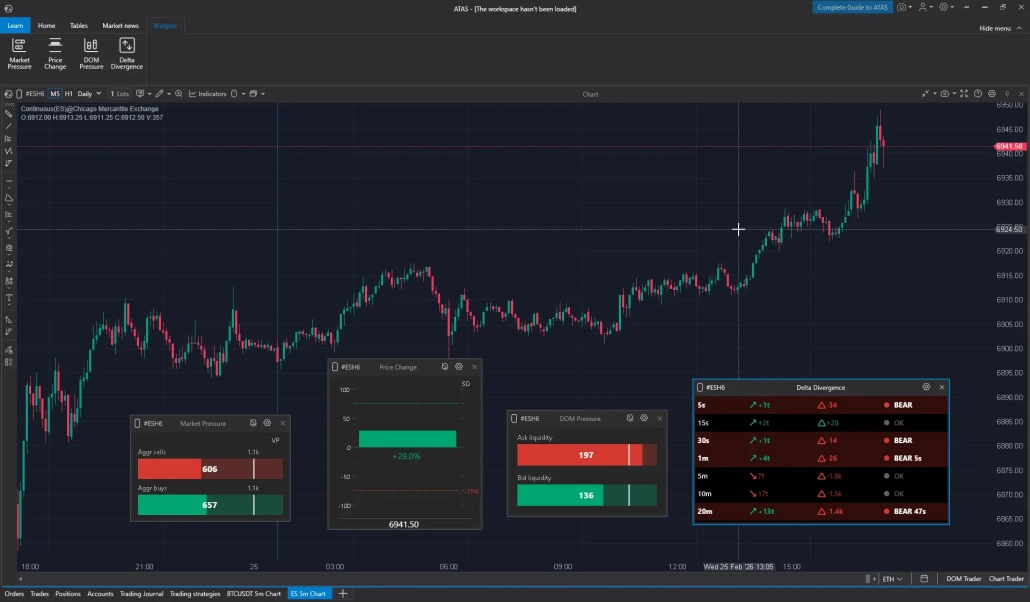
If you monitor multiple instruments, the new compact widgets help you track what’s happening in the market without switching between windows. They’re as compact as possible, so you can fit them into your usual workspace.
- Market Pressure — visualizes buyer and seller pressure. The system tracks the number and volume of trades with exponential decay, filters noise, and highlights aggressive buying and selling.
- Price Change — a price-movement intensity scale from -100 to +100. Helps you quickly assess volatility.
- DOM Pressure — analyzes the balance of limit orders in the order book. The widget calculates order strength based on proximity to the current price—so you immediately see where liquidity is concentrated.
- Delta Divergence — tracks divergences between price direction and cumulative delta on intervals from 5 seconds to 20 minutes. Use this widget to analyze situations where price and delta diverge and factor that data into your strategy.
How to enable it:
- In the Main menu, open the Widgets tab.
- Choose the widget you need.
- Specify the instrument ticker.
- Place the widget in your workspace.
Widgets are data visualization tools. They increase the informativeness of your workspace, but interpreting the data and making decisions is still up to you.
New Profile Types: Volume and Delta in One View
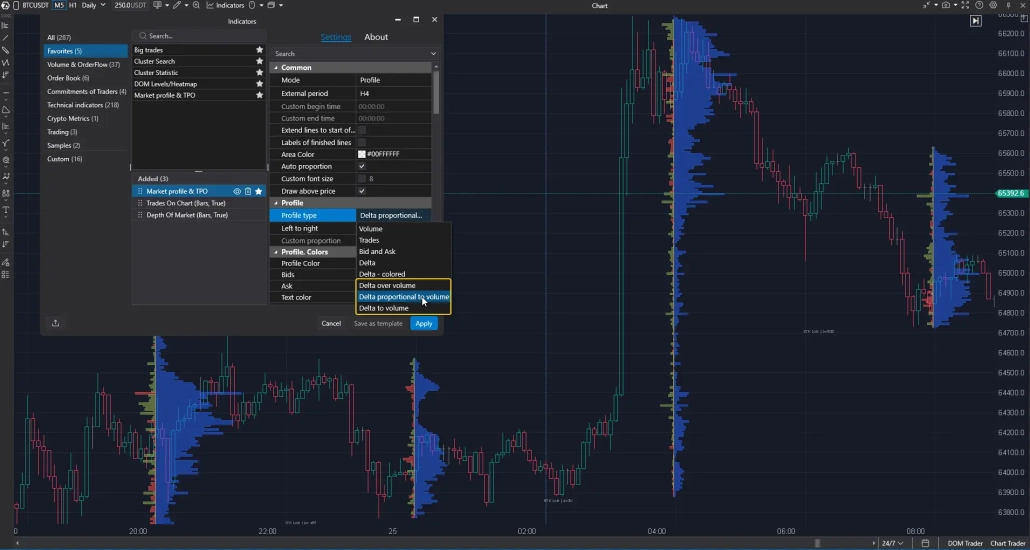
Previously, if you wanted to view a volume profile and a delta profile at the same time, you either had to switch modes or overlay two profiles on top of each other. Now, in the Market Profile & TPO settings, three new display types are available:
- Delta over Volume — the delta profile is built inside the volume profile.
- Delta proportional to Volume — delta and volume are on opposite sides of the axis; proportions between them are preserved.
- Delta to Volume — proportions are intentionally not observed in order to make delta data as readable as possible.
How to enable it:
- In the Market Profile & TPO indicator settings, find Profile type.
- Choose one of the three new modes to match your analysis approach.
All three modes are available not only in indicators, but also in the Profile drawing tool — hotkey F3.
ZigZag TPO and Profile: a Profile Inside Every Swing
A conceptually new tool—not just in this release, but globally in the history of analysis. Nothing like this has existed in any analytical platform before.
A standard ZigZag shows the wave shape, but says nothing about its “quality”: how heavy the wave is by volume, how fast it moved, and how volume relates to the price range.
The new ZigZag TPO and Profile drawing object fills this gap.
You mark extremes with your mouse—the tool automatically builds a TPO profile for each swing and adds three scales to compare waves with each other:
🔵 Blue — relative wave volume compared to the others.
🟢 Green — movement speed: the ratio of price difference to wave duration.
🟠 Orange — density: the ratio of volume to price range.
Click the dropdown menu of any swing to get exact numbers for all three parameters.
How to enable it:
- Select ZigZag TPO and Profile in the Volume Analysis section of the drawing objects menu.
- Click the extremes you’re interested in to build the structure. Right-click to finish drawing.
- Need to adjust the markup? Just drag the extreme points with your mouse.
- Customize the visual appearance as flexibly as any other drawing object.
To learn more about using the wave approach, read our article: How to analyze waves using the Weis method.
New Drawing Objects Functionality
A small but useful block—especially for those who actively use chart markup.
Brush — draw freehand on the chart
- A freehand drawing tool located in the Lines menu. By default, it draws in purple; you can change the line color and thickness in the settings.
- By default, after each stroke the tool automatically deactivates—so you don’t accidentally draw a line where you didn’t plan to.
Keep Drawing — continuous drawing mode
- A mode where the tool stays active until you turn it off yourself. Convenient for drawing several trend lines or other objects in a row—no need to reselect the tool every time.
- Controlled via the menu or a button on the drawing panel.
Drawing object timeframes
Want your M5 trend lines not to interfere with H4 analysis? In the properties of any drawing object, you can specify which timeframes it should appear on. If a 5-minute trend line isn’t needed on a 4-hour chart—just uncheck the relevant timeframe in the settings.
Account Info Display: Current Status on the Chart
This new indicator from the Trading category outputs key account parameters directly on the chart—next to the candles.
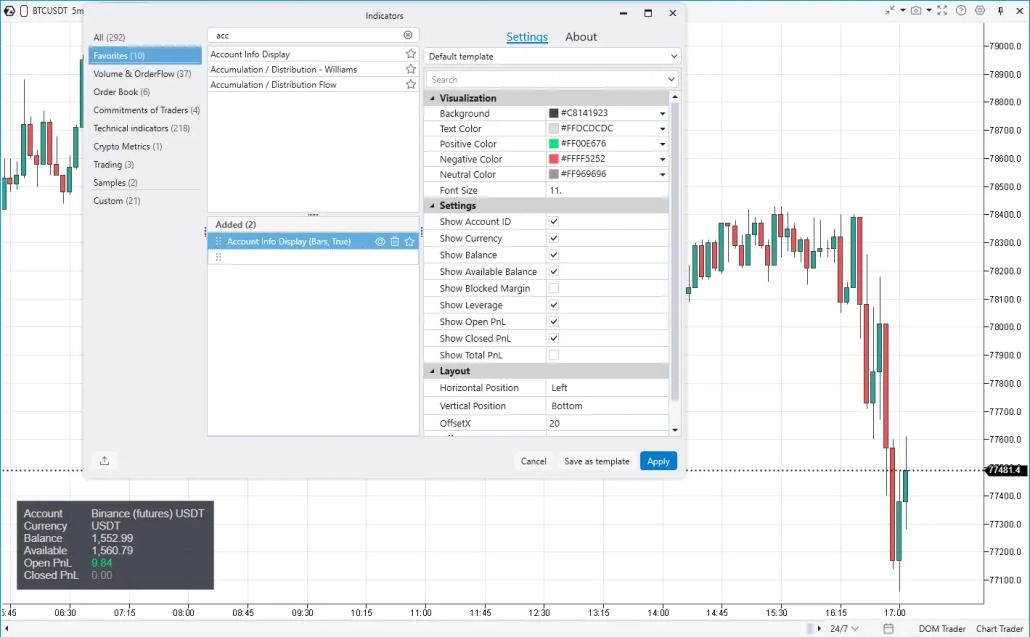
You always have in front of you:
- Current balance and available funds
- Open PnL and Closed PnL in real time
- Account name and currency
How to enable it:
- Find Account Info Display in the Trading category of the Indicators Manager (or via search).
- In the settings, define what to display: account name, balance, available funds, Open PnL, Closed PnL.
- Customize text color, background, and position (right/left, top/bottom) so the indicator fits your template.
The indicator is compact and doesn’t overload the interface—you choose which parameters to show and where.
Trading Journal: a Reimagined Statistics Module with a Playbook
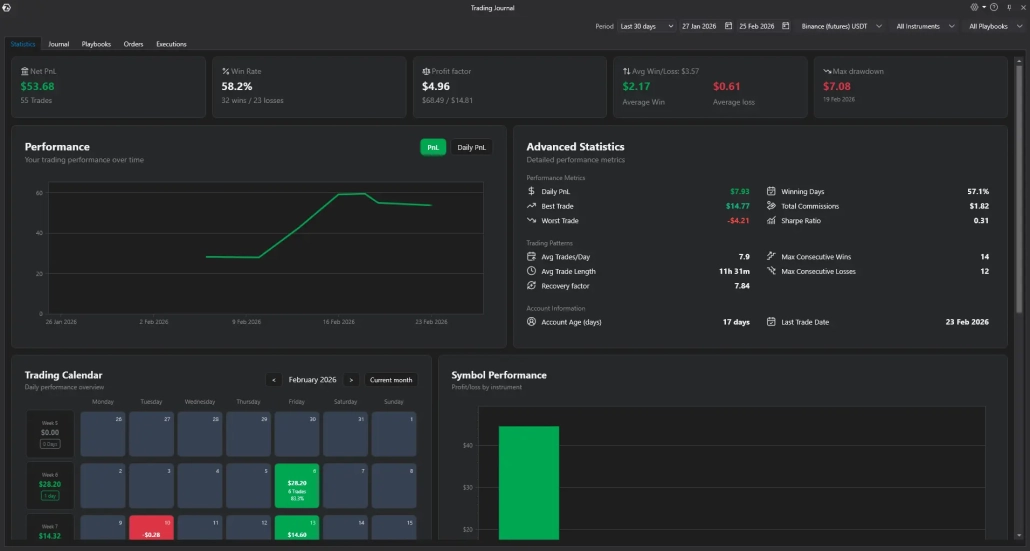
We didn’t just rename the Statistics module to Trading Journal—we completely rebuilt it first. Now it’s a full-fledged analytical center for evaluating your results.
The filter system lets you view statistics:
- by accounts: crypto, futures, Sim or Replay;
- by preset or custom periods;
- by instruments: analyze only the tickers you’re interested in.
You also get advanced reports:
- Key metrics: Net PnL, Win Rate, Profit Factor, maximum drawdown, equity change, Sharpe Ratio, Daily PnL, Best/Worst Trade, Total Commissions, and more.
- Trading calendar: track PnL by day, add notes, and set reminders.
- Symbol Performance: histograms, ticker allocation, performance by hours and days of the week.
The key new feature is the playbook. You can add personal notes to each trade: “entry off density,” “false breakout,” “greed spike,” or “trade after meditation.” Then you filter tags and get precise statistics for each setup: which has positive expectancy and which doesn’t.
Regular analysis helps you refine your approach—you’ll see what works, what doesn’t, where there’s a systematic issue, and where it’s simply an unlucky execution.
Instead of Conclusions: a Tip for Beginners
Download ATAS – a professional analytical platform for working with exchange volumes. Once you master volume analysis, the true reasons behind price movement will open up: you’ll start seeing where real liquidity is concentrated, how large participants act, and what’s behind every move on the chart. This helps you make decisions more confidently—based on data, not guesses.
If you’re just getting acquainted with volume analysis, start with the Quick Start section—there you’ll find basic materials on working with footprint, profile, and order flow.
To make it easier to apply knowledge in practice, we added the WebPages module to the Main menu. With it, you can view learning pages, blog articles, or YouTube videos directly in ATAS—without switching between windows. Just mix the module with chart windows in a single workspace.
If you have an idea for improving ATAS and you want to see it in future releases—describe it in detail on feedback.atas.net. We read everything.
Subscribe
Get the latest ATAS news delivered conveniently