In trading, a timeframe is the time interval used to build one candlestick or one bar on a chart. Another common way traders define a timeframe is as a period or time interval.
In this article, we’ll explore how using multiple timeframes can improve trading efficiency. We’ll start by defining what a timeframe means in trading and reviewing the main types of trading timeframes. Then, we’ll move on to practical examples of applying this concept in volume analysis.
What is a timeframe?
On an exchange, a timeframe can be compared to the interval of time over which chart data is updated.
- The smaller the interval, the more detail you see within the same period.
- The larger the interval, the smoother the chart appears, but with less information about short-term price fluctuations.
This is the basic timeframe definition traders work with.
Timeframe in trading
For example, the chart below shows a 5-minute candlestick chart of the ES futures contract from the CME exchange. This is a classic candlestick chart, where each candle represents one 5-minute period. On trading platforms like ATAS, you can choose from a wide range of timeframes in the chart settings menu.
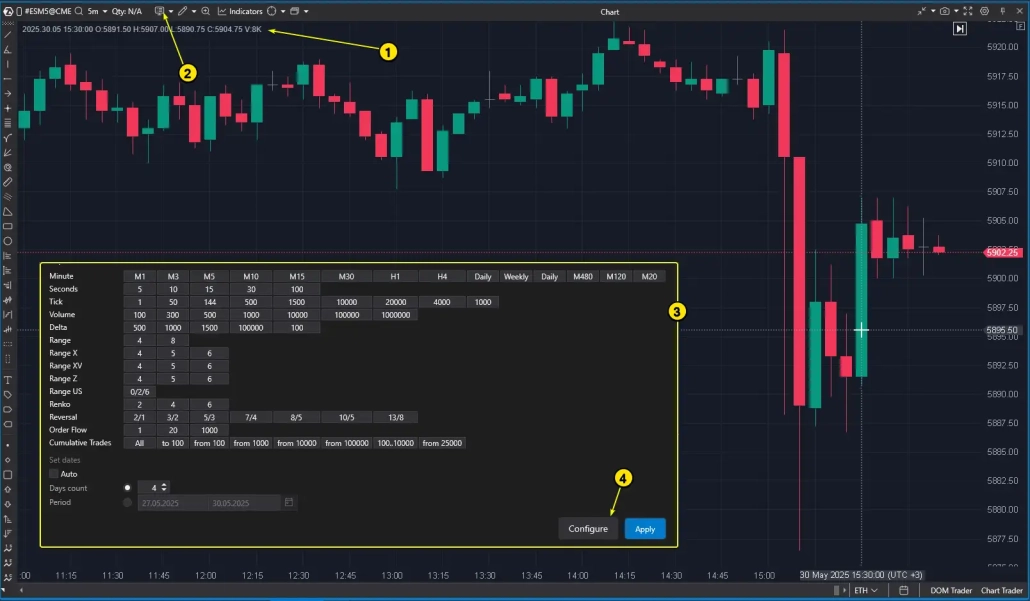
The highlighted candlestick on the chart shows a bullish candle representing upward price movement within a 5-minute interval from 15:30 to 15:35. In trading, this is called a 5-minute timeframe. This means that every 5 minutes, a new candle appears on the chart (as long as the market is open).
Arrow (1) points to the statistical data for the selected 5-minute candle:
OPEN: the price at the beginning of the period;
HIGH / LOW: the highest and lowest price within the period;
CLOSE: the price fixed at the end of the interval.
By default, ATAS charts open with a 5-minute timeframe. To change the timeframe, use the menu indicated by arrow (2).
✔ Fast (lower) trading timeframes
Examples include a 10-second or 1-minute chart. These show very detailed, short-term price movements.
✔ Slow (higher) trading timeframes
Examples include a 4-hour or daily timeframe. These provide a broader view of market dynamics, capturing trends that span several weeks or even months.
Menu (3) shows the available timeframe options. ATAS offers a wide selection, including Range and Reversal types. However, in the strict definition of a timeframe, only Minutes and Seconds count, since they are based on fixed time intervals: the period starts → a candle opens, the period ends → the candle closes, and the next one begins.
Other chart types, such as Range or Renko, do not depend on time. Their candles open and close based on price movement rather than time passing. (See also the article Chart Types in ATAS for more details.)
Arrow (4) points to the menu where you can create custom timeframes. You can set any interval you like — for example, a 13-second or 6-hour chart.
A wide range of timeframes gives traders multiple “slices” of market data, allowing them to study price dynamics at different scales.
What is the best timeframe to use?
There is no universal answer. The choice depends on your trading goals:
- For analyzing long-term trends, higher timeframes such as daily or 4-hour are optimal.
- For intraday entry points, lower timeframes like the 1-minute chart are often preferred.
Different Timeframes in Indicator Settings
When talking about timeframes, it’s important to note that the chosen period applies not only to chart construction but also to indicator settings. Many indicators include a parameter called period, which depends directly on the selected timeframe.
In classical indicators such as Moving Averages or RSI, the logic is straightforward:
- The larger the period value, the smoother the indicator line.
- The smaller the period value, the more sensitive the indicator becomes to short-term fluctuations.
However, with volume analysis indicators, timeframe selection can work a bit differently.
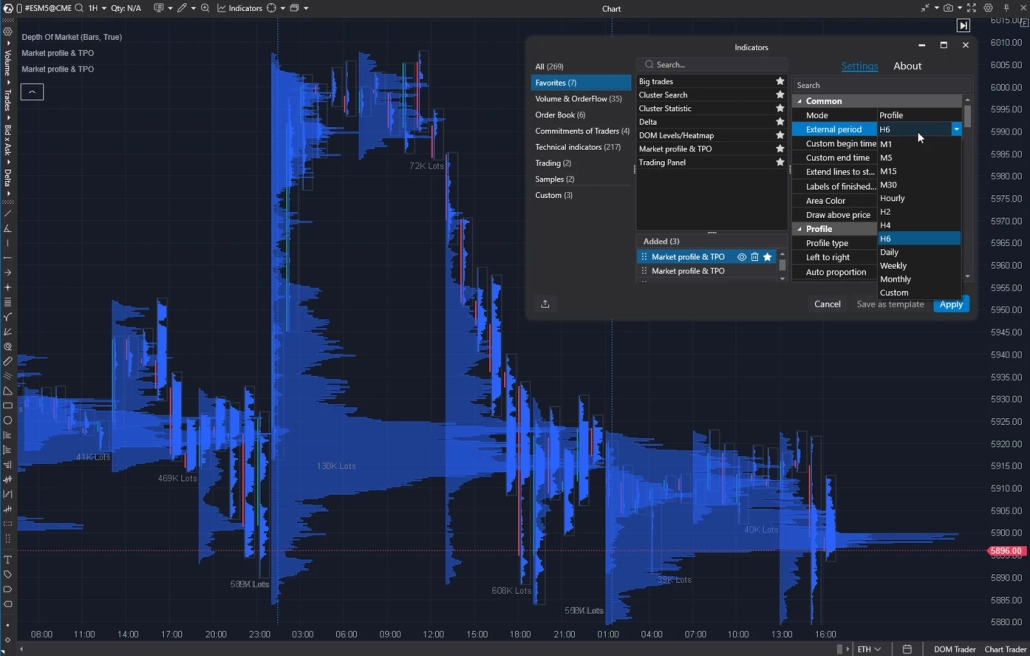
Example: Let’s look at the period parameter for one of the most powerful tools in volume analysis — the ATAS Market Profile & TPO indicator.
On the screenshot below:
- The chart is set to a 1-hour timeframe. This is not a standard candlestick chart, but a footprint displayed as volume profiles.
- Two instances of the Market Profile indicator are applied. As you can see in the indicator settings, you can choose the reference period. In this case, one indicator is set to a daily period, while the other uses a 6-hour period.
This example leads us to a key idea: using different trading timeframes in daily practice helps traders focus on their main task — finding trade setups with a higher probability of profit than loss.
Start now!
Try ATAS free with no time limit
How to Use Different Timeframes
Working with multiple timeframes forms the basis of many trading strategies, including Multi-Timeframe Analysis (MTF). This approach allows you to look at the market from several perspectives — moving from the bigger picture down to the finer details. It helps traders make more informed decisions, supported by signals from different scales.
Fractality in Trading
Markets are fractal by nature. Patterns and trends that appear on higher timeframes often repeat on lower ones. On smaller intervals these patterns are more detailed, but they also contain more “noise.” This is important to keep in mind when analyzing any selected timeframe. For example:
✔ On a daily chart, a strong trend may contain many corrections and local reversals that are visible only on the hourly chart.
✔ At the same time, a short-term move on a 5-minute chart may look like a minor ripple within a powerful long-term trend.
The Classic Approach: Alexander Elder’s Triple Screen System
The Triple Screen Trading System, developed by Dr. Alexander Elder, is one of the best-known methods of multi-timeframe (MTF) analysis. The idea is to analyze the market across three different timeframes, filtering signals step by step to increase the probability of successful trades.
1. The First Screen (Strategic / Long-Term)
✔ Goal: Identify the main market direction — the global trend.
Typical timeframes: Weekly or Daily.
✔ Trading logic:
- If the long-term trend is up → look for buying opportunities only.
- If the long-term trend is down → look for selling opportunities only.
- If the market is ranging → trade from the range boundaries or stay out until a clear directional move emerges.
2. The Second Screen (Tactical / Medium-Term)
✔ Goal: Spot a corrective move that provides a better entry price in the direction of the main trend.
✔ Typical timeframes:
- Daily or 4-hour (H4), if the first screen was Weekly.
- Hourly (H1) or 4-hour (H4), if the first screen was Daily.
3. The Third Screen (Execution / Short-Term)
✔ Goal: Pinpoint the exact entry to minimize risk and maximize profit potential.
✔ Typical timeframes: Hourly (H1), 15-minute (M15), 5-minute (M5), or even faster.
At this stage, the trader no longer questions the trade direction. The focus is on timing a precise and well-planned entry. Triggers may include:
- Breakouts of local support or resistance levels.
- Footprint pattern analysis.
- Signals from ATAS tools such as Smart DOM or Smart Tape, which highlight local bursts of buying or selling pressure in real time, improving trade accuracy.
Stop-loss placement is usually based on the analysis of the third screen, while take-profit levels can be set according to signals from the second screen.
Which Timeframes Should You Track?
The choice of timeframes depends on the trader’s temperament, trading style, and personal preferences. However, a common guideline is the “multiplier rule” (typically from 3 to 6) when selecting working timeframes.
Examples:
- Scalping: H1 (strategic) → M5–M10 (tactical) → M1 (entry).
- Intraday trading: H4 (strategic) → M30 (tactical) → M5 (entry).
- Swing trading: Daily/Weekly (strategic) → H4/H6 (tactical) → H1 (entry).
The main goal of this approach is to achieve synchronization across different market scales. A trade confirmed on multiple timeframes statistically carries a higher probability of success, as it accounts for both short-term price dynamics and long-term market sentiment.
Example of Multi-Timeframe Trading
Let’s look at how the multi-timeframe approach works in practice when searching for entry points. As an example, we’ll take the gold futures market and the situation that developed in the first half of 2025.
Step 1. Analyzing the Higher Timeframe
Identifying the global trend is straightforward: the first half of 2025 was marked by a series of higher lows, supported by several fundamental factors such as trade conflicts, geopolitical instability, and strong demand for gold from central banks.
On the 4-hour chart, a support line can be drawn to highlight this bullish movement. The next step is to wait for the price to approach this trendline, anticipating either a bounce upward or even a reversal that could push the market to new highs.
At the time, analysts — including those from Goldman Sachs — predicted that gold prices could reach around $3,500 by the end of 2025.
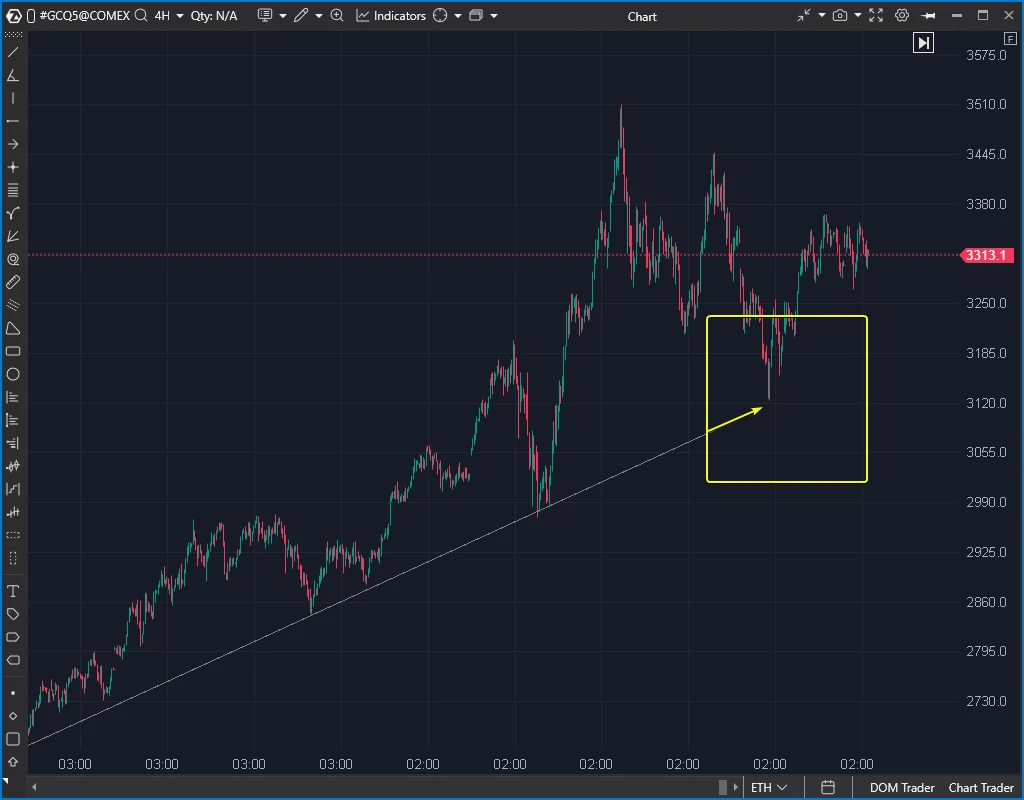
Let’s assume we didn’t miss the moment when the price pulled back to the support line. At this stage, it makes sense to switch from the first screen (higher timeframe) to the second screen for a more detailed analysis.
Step 2. Analyzing the Medium (Working) Timeframe
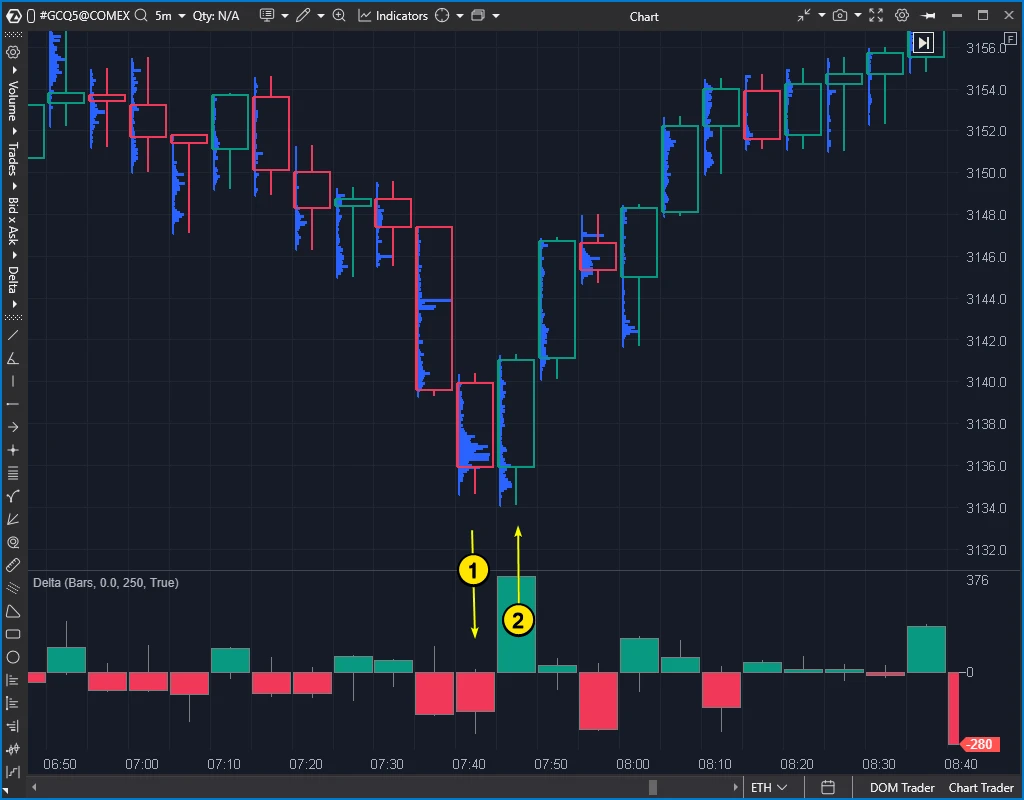
On the 30-minute chart, our goal is to look for confirming signals. For this, we switch to a cluster chart (footprint) and add the Delta indicator.
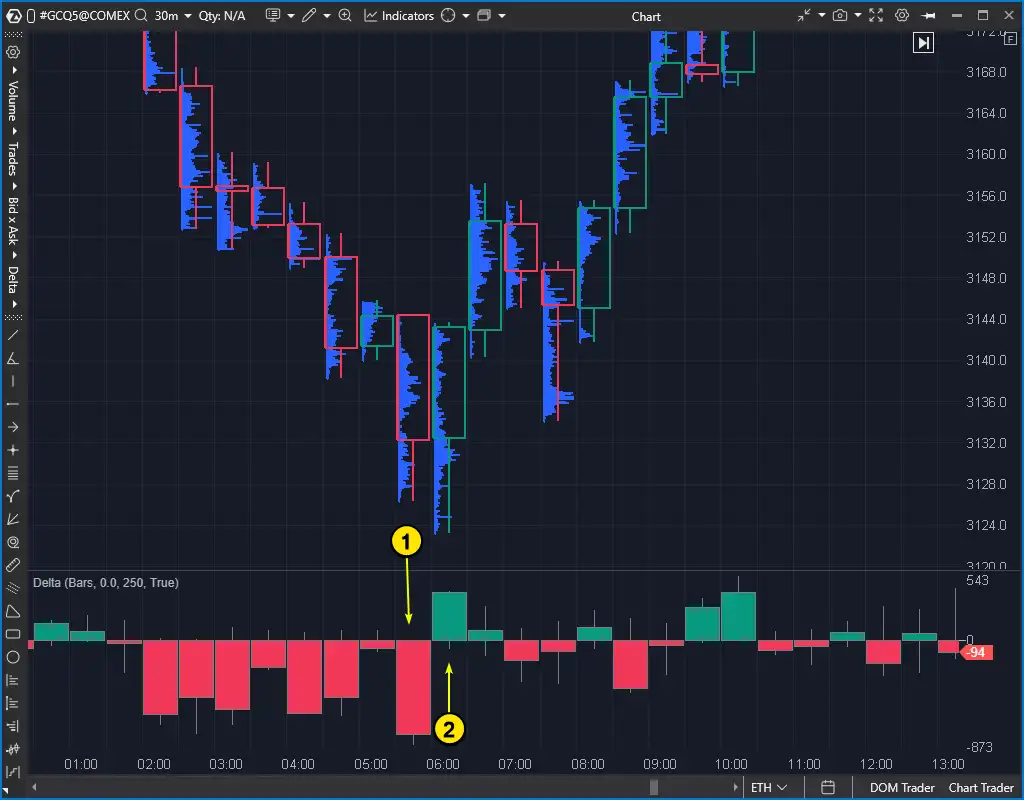
This simple but powerful volume analysis setup provides clear confirmation signals:
- A surge of negative Delta on a large bearish candle indicates heavy market-sell pressure, showing strong seller dominance.
- A sharp reversal of Delta from negative to positive.
Such a reversal, similar to a candlestick bullish engulfing pattern, can be interpreted as a panic-driven selling climax followed by aggressive buying from traders who considered the current price attractive for entry.
More on the topic:
Important detail: Candle (2) closed at its high, above the volume profile bulges (at $3,136 and $3,131). This adds another sign of strength in the market.
From the first screen perspective , price action and volume analysis confirm the relevance of the long-term uptrend line. Tactically, this justifies entering a long position.
Step 3. Analyzing the Lower Timeframe / Alternative Chart
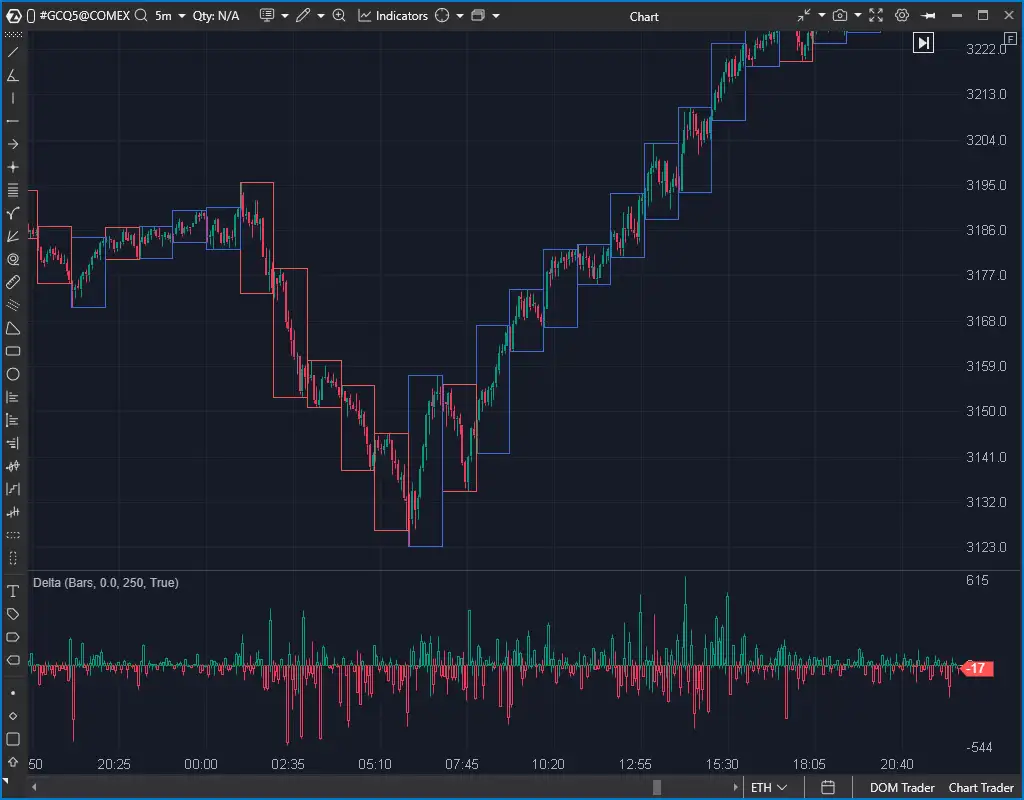
Now we switch to the 5-minute chart to identify a precise entry. For this task, tools such as the ATAS Smart Tape (Time & Sales), the Smart DOM (order book), the Order Flow indicator, and other ATAS features can be used. In this example, however, we’ll keep the same chart settings, as they provide a clear enough picture.
The Delta indicator highlights another sharp shift in sentiment: the flow of market sells was replaced by a sudden burst of market buys — right at the $3,131 level, which we previously marked as a high-volume area. On the 5-minute chart, this looks not only like a classic bullish engulfing pattern but also a reversal from the profile bulge, confirmed by Delta.
With this timeframe, the trader can act according to a structured plan (your plan may differ):
- Enter a buy at the close of candle (2).
- Place a stop-loss below the reversal formation (1–2).
- Set a take-profit at least three times the stop size — or better yet, let profits run toward a major resistance level.
Combining different timeframes with volume analysis provides a solid framework for building a trading plan. It allows you to pinpoint precise intraday entries (e.g., using Cluster Analysis, Order Flow, or Smart DOM), while aligning them with broader market context from Market Profile or long-term trend analysis. This way, decisions are based on a consistent, multi-level strategy.
FAQ
Which Timeframe Should You Use in Trading?
The choice of timeframe depends on your trading style. There is no single “rightful answer, but here are a few practical tips:
✔ Experiment with different timeframes on a demo account to find the time intervals that suit you best.
✔ Apply Multi-Timeframe (MTF) Analysis. Combine several timeframes on the same market to create synergy — for example, when buy signals align across three different charts.
✔ Most importantly, make sure your chosen timeframe matches your strategy and the intended holding period of your positions.
What are the best indicators to use on multiple timeframes?
The example of finding a trade across three different timeframes shows that the following indicators can be useful for effective analysis:
Volume Profile
This indicator displays the distribution of traded volume at different price levels, helping to identify key support and resistance zones (POC, Value Area) on various timeframes.
Delta and Cumulative Delta
These indicators measure the imbalance between buyers and sellers, making it easier to see which side of the market is showing aggression.
Cluster Chart (Footprint)
This tool details the volume inside each candle, with the ability to separate bid, ask, and delta values. On higher timeframes, it helps highlight important zones, while on lower timeframes it confirms entry signals.
In addition, you can use other indicators available in the ATAS platform. It is important that they complement each other, providing deeper market insights across multiple timeframes.
It should be noted that ATAS focuses on volume-based indicators and tools, which provide significantly more information than classic instruments such as Moving Averages (MA) or RSI, which are known for their lagging effect.
Also, using Moving Averages on different timeframes can be inefficient, since switching timeframes with an MA is essentially the same as just changing the period setting in its parameters, which does not provide additional advantages.
Is it possible to see multiple timeframes on one chart at the same time?
Yes, it is. One way to do this is by using the External Chart indicator, which allows you to overlay candlestick or bar outlines from a higher timeframe (for example, hourly) onto your current chart (for example, 5-minute).
This approach makes it possible to view several timeframes on one chart, helping traders better analyze the interaction between short-term and long-term market dynamics.
Conclusion
Multi-Timeframe (MTF) analysis involves studying the market step by step, moving from higher timeframes that show the picture in general to lower ones that reveal specific trading opportunities.
When combined with ATAS volume analysis tools, this approach helps traders identify more precise entry points.
Advantages of trading with multiple timeframes:
✔ Higher probability of success. Signals from different timeframes can align and reinforce each other, creating synergy instead of conflict. The key is to base the analysis on facts — strong price levels and reliable methods of decision-making. This is especially true for volume analysis, which clearly shows who controls the market (buyers or sellers) at different price levels across different timeframes.
✔ Optimized risk management. Stop-losses can be placed beyond significant volume levels identified on lower timeframes, while profit targets can be set using the medium timeframe. This provides an attractive risk-to-reward ratio, grounded in analysis rather than wishful thinking.
✔ Flexibility in using different indicators. For example, due to its nature, the Commitment of Traders indicator (COT) is only relevant on higher timeframes, while the Smart Tape is useful for intraday trading. By applying multiple timeframes, traders can combine such tools effectively within a single strategy.
Risks of Trading with Multiple Timeframes
✘ Fewer trading signals. Because of strict filtering, where signals must align across several timeframes, the total number of potential trades may decrease. This can improve trade quality but may frustrate traders who prefer frequent entries.
✘ Increased analytical workload and fatigue. Monitoring and comparing data from multiple charts simultaneously can be tiring and may lead to “analysis overload” or hesitation.
✘ Higher demands on discipline and organization. MTF analysis often involves reviewing many markets on higher timeframes. Tracking numerous charts with different timeframes and tickers can become overwhelming, especially for traders with weak self-organization skills.
✘ Complexity for beginners. Learning the MTF approach — especially when combined with specialized volume analysis tools (such as those in ATAS) — requires more time, practice, and a deeper understanding of market mechanics compared to analyzing a single chart.
Is it worth applying multi-timeframe analysis?
Yes, it’s worth trying, at least at the initial stage. Start with just two charts and use a simple, time-tested approach that many successful traders rely on. For example:
- In the morning: Analyze higher timeframes (such as hourly or daily) and mark important levels on the chart.
- During the day: Watch the 5-minute or 1-minute chart only when the price approaches those pre-marked levels.
This structured way of applying multiple timeframes can evolve into a powerful analytical tool — especially when combined with advanced volume analysis features available in ATAS.
Information in this article cannot be perceived as a call for investing or buying/selling of any asset on the exchange. All situations, discussed in the article, are provided with the purpose of getting acquainted with the functionality and advantages of the ATAS platform.
Subscribe
Get the latest ATAS news delivered conveniently