Trend trading has obvious advantages. In this article you will read about the idea of a trend trading strategy that uses professional indicators such as the Cluster Search and Dynamic Levels Channel from the ATAS platform.
Read in the article:
Benefits of trend trading
What is Dynamic Levels Channel
What is Cluster Search
Idea of trend trading strategy
Examples
Important! The described strategy (as any other strategy) does not guarantee profit in each trade. Use it with a critical eye and do not expose your own capital to unjustified risks.
Benefits of trend trading
“The trend is your friend.” Perhaps it is the most popular saying among traders and there is a reason for it.
Trend trading strategies assume that the price of a financial asset will continue to move in the same direction as it is currently trending.
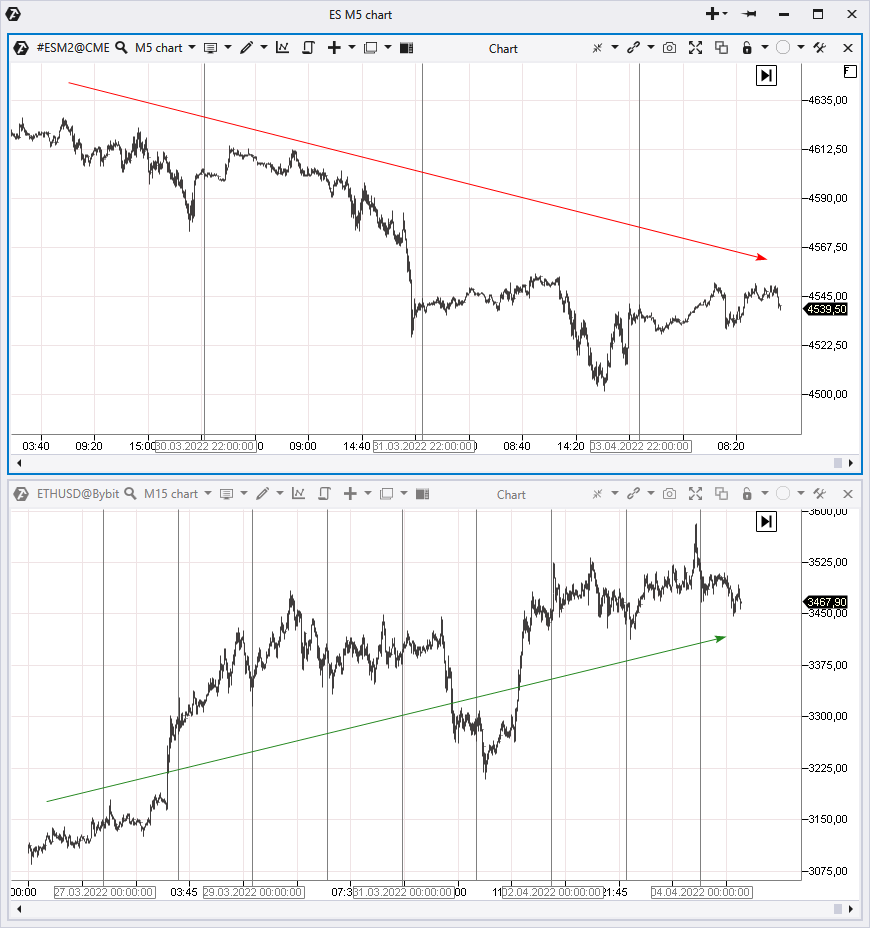
The top chart shows a downtrend in the S&P-500 futures market. Opening a short position will have more priority according to trend trading .
However, if the trend is upward, opening a long position will have more priority (the bottom chart, ETHUSD market).
If you trade with the trend, you:
probably act in harmony with market sentiments and its fundamental background;
increase your overall chances of making a profit;
reduce the amount of time that is required for a position to show profit;
increase the potential of the trade.
However, there is some bad news:
sooner or later trends come to an end. Some trends last for a very short period of time;
it is quite difficult to determine the strength and direction of a trend.
In the following part we will show you how to identify a trend using the Dynamic Levels Channel indicator. After that we will use the Cluster Search to find a good entry point.
What is Dynamic Levels Channel indicator
The Dynamic Levels Channel indicator is based on the analysis of horizontal volumes.
To put it simply, imagine that you want to buy a guitar. You have considered many offers and now you realize that:
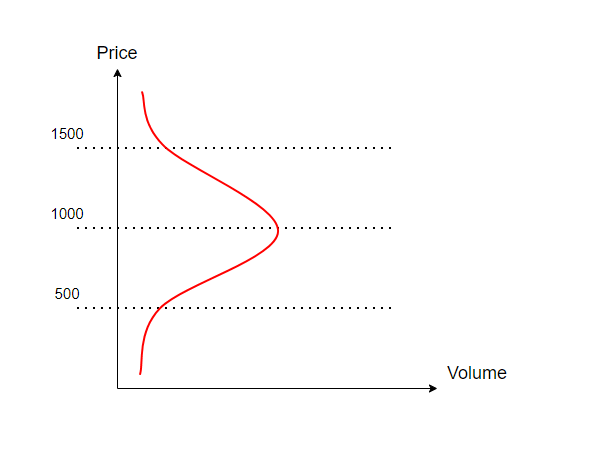
the average price is around $1000 per instrument, most of the offers fluctuate around this price.
only a few sellers ask below $500 and above $1500.
The red line on the chart below shows how the number of offers is distributed depending on the price.
The laws of supply and demand apply to any market, whether it is a musical instrument market or a stock exchange.
As for horizontal market volumes:
the maximum volume is called the Point of Control (POC);
the lower boundary is called Value Area Low (VAL);
the upper boundary is called Value Area High (VAH).
Usually 70-80% of all prices are between VAL and VAH and the curve has a bell shape (also known as a normal distribution curve).
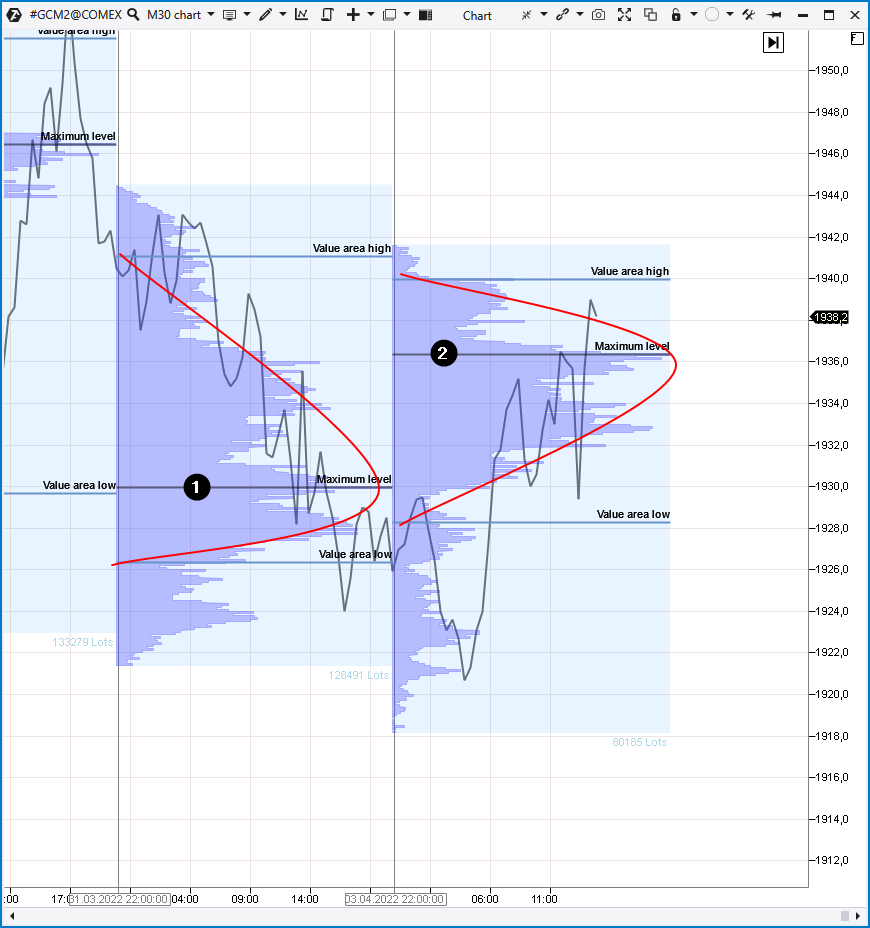
This is how it looks on a market chart:
This data was taken from the gold futures market, the TPO and Profile indicator (time frame = 1 day) was added to the chart.
On the first day (1), the maximum trading volume was at the price of 1930.
A day later (2), the maximum volume level rose to 1936,4, which indicates stronger bullish sentiments.
It is confirmed by a thin profile at the bottom of the second day. The lowest price is far away from VAL, which means that there was very little activity below the 1928 level, most likely due to a lack of sellers.
If you analyze profile features using the TPO and Profile, you can get an idea of the actual market sentiments.
The Dynamic Levels Channel indicator shows the movement of the POC, VAL, VAH lines in dynamics, you can set almost any time period in the indicator settings.
The indicator consists of three lines:
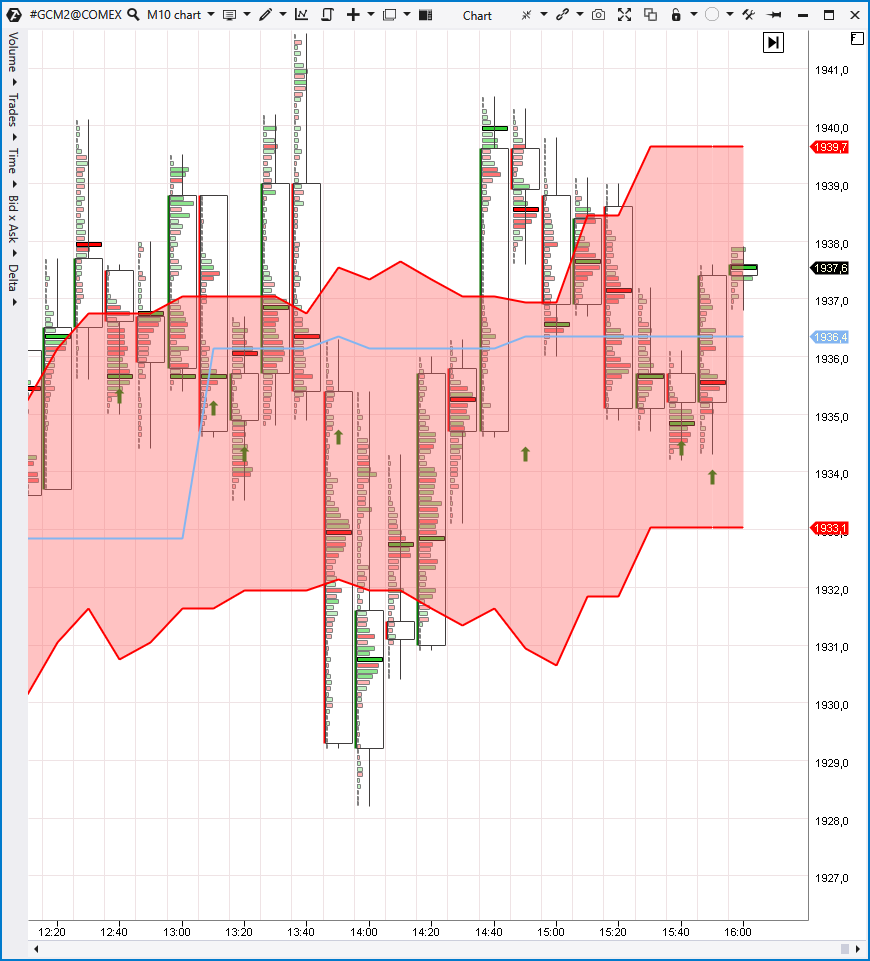
For example, on the footprint above the green clusters indicate a predominance of market buyers over sellers, and the red clusters indicate a predominance of sellers.
There are a lot of clusters, therefore, the Cluster Search was created to make working with them easier. This indicator highlights clusters that fulfill the following conditions:
You can see how two Cluster Search indicators work together on the chart below. They highlight clusters with high buy volume in green and with high sell volume in red.
Having looked at the chart above, one might wonder why prices can fall down after the appearance of big clusters of buys (1), and why they can rise after the appearance of big clusters of sells (2).
It is likely that in the first case sellers placed stop loss orders below the previous high and their positions were liquidated. In the second case, buyers placed stop loss orders below the previous low and their positions were liquidated. This reasoning will be used in the following description of the strategy’s idea.
Tip. To get more information about the Cluster Search indicator, read these articles:
The idea of the strategy is to buy a commodity that becomes more expensive at a lower price and open a short position at a higher price in a declining market.
To apply this logic, let’s use the Dynamic Levels Channel and Cluster Search indicators. The first one will show the direction of a trend and the second one will show a signal to enter a position.
Thus, a buy entry signal will be received, if two conditions are fulfilled:
levels of the maximum volume are growing on the Dynamic Levels Channel indicator (an upward trend);
the price is falling below VAL (to buy at a lower price);
there is a big cluster of sells and a positive price response to it, which presumably means that common traders were thrown out of the market.
The opposite is true for a sell signal.
Examples
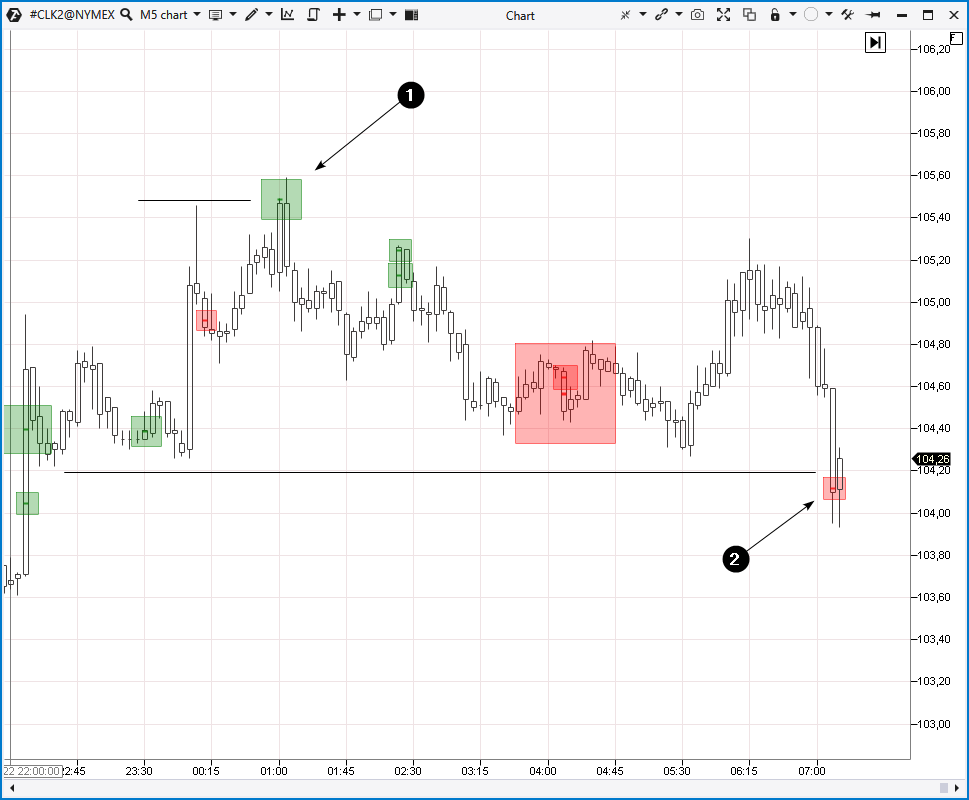
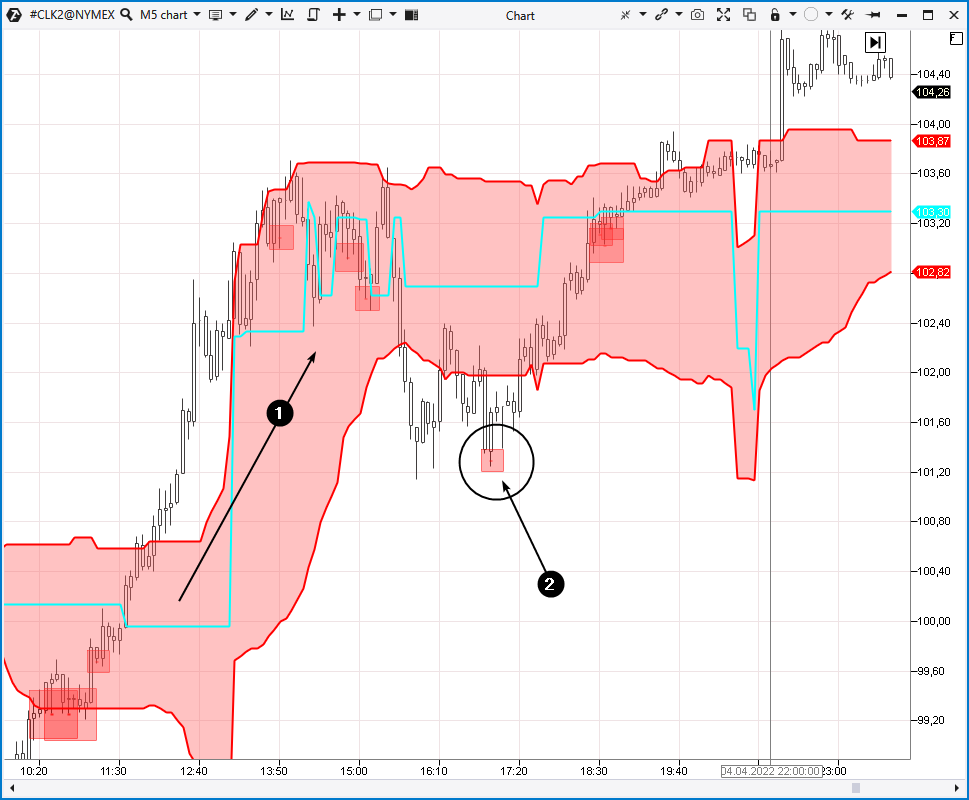
The first example is on a 5-minute chart from the oil futures market.
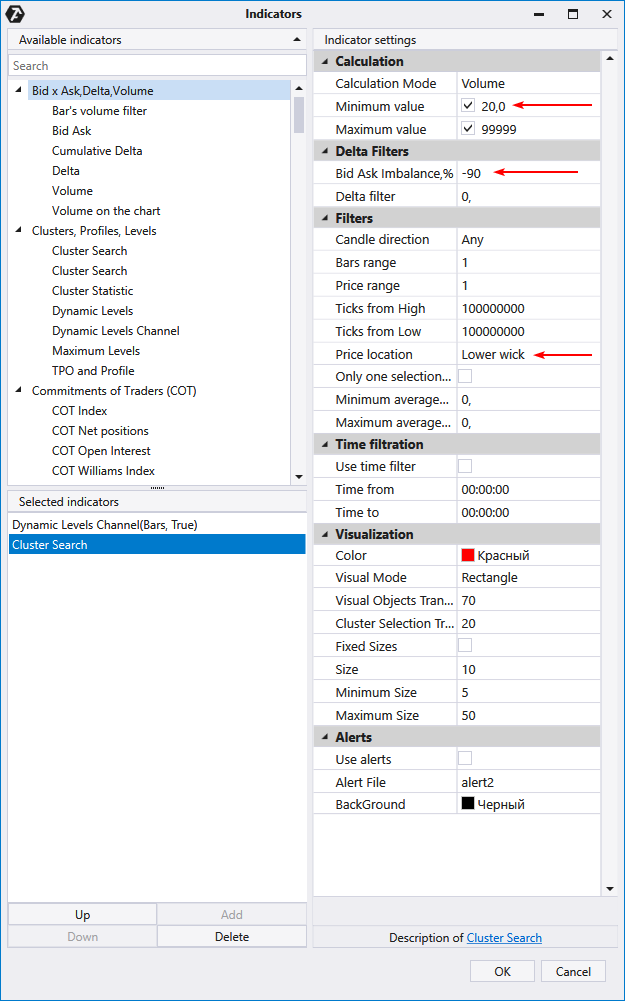
We have added the Cluster Search indicator, you can see the settings below. The indicator highlights clusters of sells (that is why Imbalance = -90) from 20 contracts, and the cluster should be located on the lower shadow of the candle in order to draw attention to the price increase after the cluster of sells has appeared.
Let’s also add the Dynamic Levels Channel with a period of 60. We get the following picture:
Number 1 indicates the price increase and the upward movement of the POC, VAL, VAH lines, which means that the trend is upward.
Number 2 indicates:
a price drop below the VAL level. One could buy an asset that gets more expensive at a bargain price.
A big cluster of sells around 101.25 and a price rise after it. This is a sign that buyers’ stop losses have been activated. The price does not drop despite the market sells, therefore, the ATAS indicator gives more confidence to enter a long position.
The signal turned out to be promising. For example, if you buy a contract at 101,50, it makes sense to hold it to the VAH level in order to sell it at the upper border around 103,60 (if you are an intraday trader). However, you can keep holding it if you expect the continuation of the uptrend in the oil market during the energy crisis (if you are a swing trader).
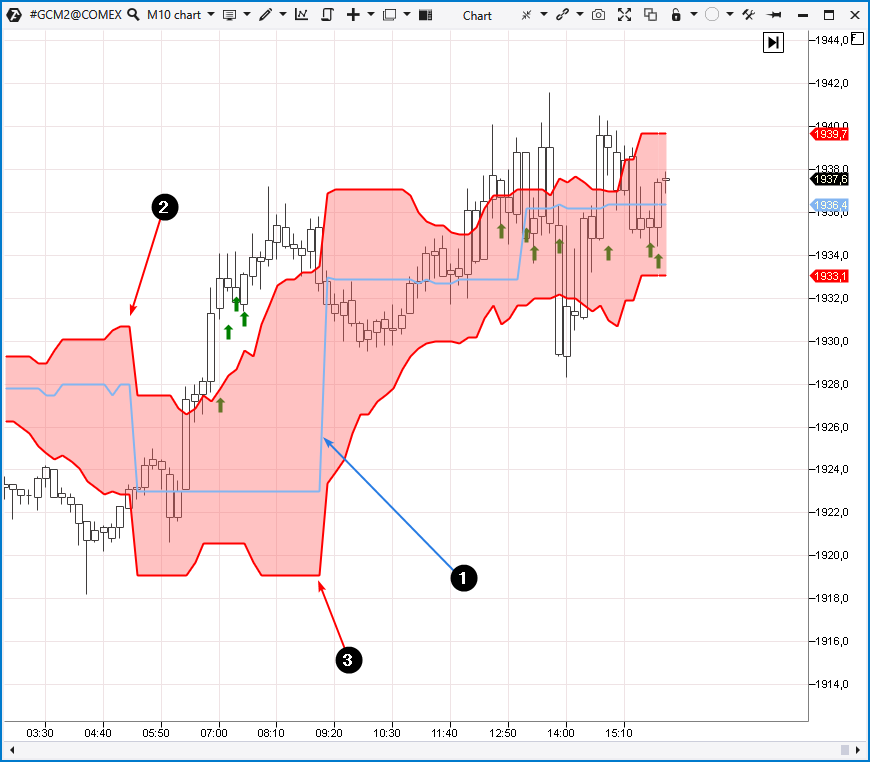
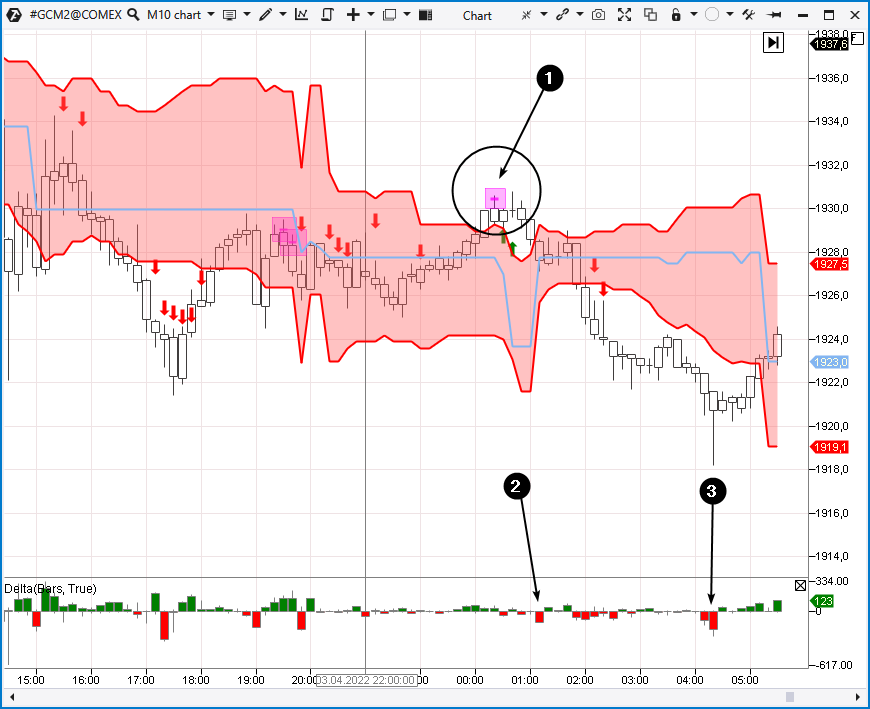
The second example is on a 10-minute chart from the gold futures market.The Delta indicator has been added to the chart.
The dynamics of the lines of the Dynamic Levels Channel indicates that the market is bearish. Therefore, you should look for a sell setup.
Number 1 indicates this moment:
The price has exceeded VAH;
The Cluster Search indicator points at a splash of market buys on the upper shadow of the candle (it is likely that stop losses were activated above 1930).
Number 2 indicates a negative delta. If it was coupled with a bearish candle, there would be more confidence in making the right decision in case a short position was open.
You can hold a short position with a trailing stop or use data from the chart to find an exit. For example, number 3 indicates a candle with a long lower shadow and a splash in sales. This is a sign of a local selling climax below the 1920 level, it is a reason to close the short position.
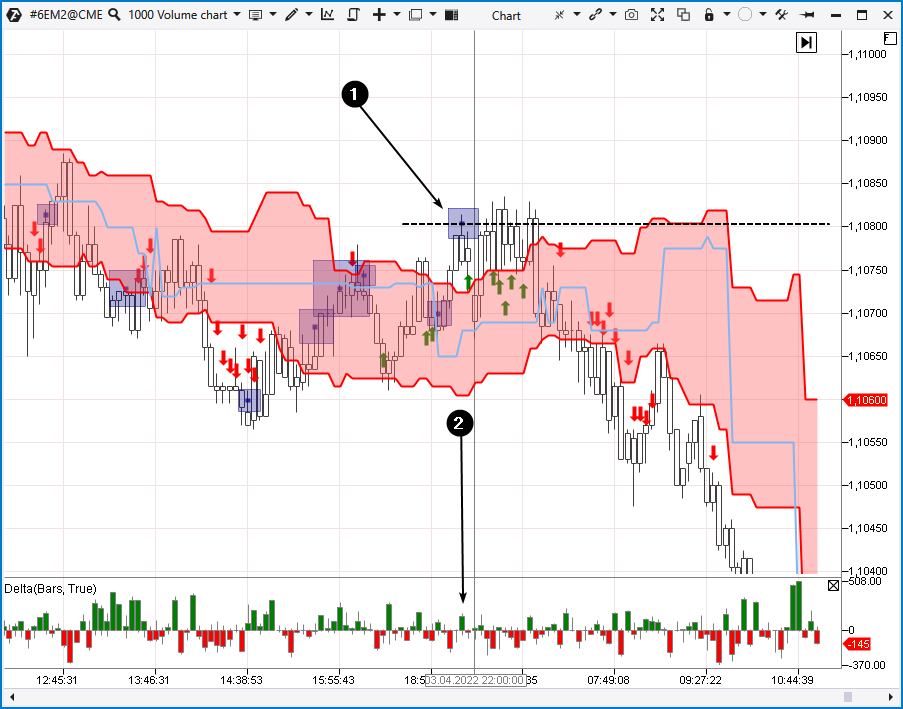
The third example is from the currency futures market.
A non-standard time frame Volume1000 was used.
Number 1 indicates a sell setup. The delta indicator (2) confirms the splash of buys. We assume that stop losses were activated a few ticks above the 1,108 level.
You can hold the position until the VAL level is reached in order to move it to breakeven and expect the continuation of the downtrend.
The fourth example.
Another sell signal in the same market.
Number 1 indicates a sell setup.
Delta dynamics look quite interesting. It may indicate that buyers’ pressure is decreasing (2) and there will be a splash of buys (3) due to stop loss activation above 1,10250.
How to start trading
We hope that information presented in this article was useful for you. Trend trading is recommended for beginner traders, but remember that the price does not change in a straight line, otherwise it would be too easy to make money.
Usually there will be local lows during bearish trends to make it harder for buyers to trade, i.e. to motivate them to close a position manually or by stop losses. The same is true for bearish trends.
The strategy, that we described in general terms, is designed to enter a position when others exit because they believe that the trend is over. Check how this strategy works on your charts. Explore how the Cluster Search and Dynamic Levels Channel can help you find profitable setups.
Download the free version of ATAS right now! Try a powerful cluster chart analysis tool for stock, futures and crypto markets.
Conclusions
To trade with the trend applying professional indicators and the strategy from the article, use:
The Dynamic Levels Channel to identify trends and the VAL, VAH levels that can indicate which price is high and which is low at the moment.
The Cluster Search indicator to find entry points during pullbacks within a trend.
Download ATAS. There are four good reasons for that:
It’s free and you can continue using the program even after the 14-day trial period.
You will be able to analyze divergences in the stock, futures and crypto markets.
There is a demo account built into the ATAS platform, so you can practice trading without risking your real capital.
Information in this article cannot be perceived as a call for investing or buying/selling of any asset on the exchange. All situations, discussed in the article, are provided with the purpose of getting acquainted with the functionality and advantages of the ATAS platform.