

The falling wedge is a chart pattern (or formation) in technical analysis that belongs to the category of triangle patterns. According to classical interpretations, the falling wedge signals a potential trend reversal. But does this hold true in practice?
In this article, aimed at beginner traders, we examine the falling wedge in more detail: how to identify it, how to confirm it using chart examples, what its profit statistics are, and how its profitability can be improved with the help of professional indicators and volume analysis on the ATAS platform charts.
How Does a Falling Wedge Pattern Work?
The falling wedge is one of the most well-known chart patterns in technical analysis. This pattern can signal a potential slowdown in a downtrend, as traders begin to anticipate a bullish breakout capable of breaking resistance and reversing the market.
This pattern can indicate that a downtrend is slowing down, and traders begin to anticipate a bullish impulse that could break out the resistance and reverse the market.
If you are just beginning to study chart patterns like the falling wedge, here are a few useful articles to deepen your understanding of how they work:
How Does a Falling Wedge Pattern Form?
On a chart, the falling wedge does indeed resemble a wedge, as it forms when the price fluctuates between two converging, downward-sloping lines. The lower line acts as support, while the upper line serves as resistance.
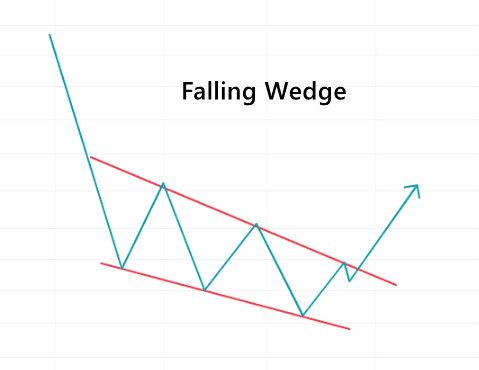
It is generally accepted that a falling wedge should include at least five touches of these lines — for example, three on the support line and two on the resistance. The more touches there are, the more reliable the pattern is considered to be.
However, if one demands precise touches and strict adherence to the required number, a textbook falling wedge is relatively rare on stock, futures, or cryptocurrency charts, regardless of the time frame.
Falling Wedge Pattern Interpretation
The converging lines of the pattern indicate that market volatility is fading. While this may seem obvious, what does it imply for forecasting future price behavior?
According to classical technical analysis, a “textbook” falling wedge typically forms at the end of a downtrend. This signals that buyers are starting to step in, as the price reaches new lows. As a result, the slope of the support line becomes less steep, and together with the descending resistance line, it forms a wedge.
Example of a Falling Wedge on the Chart
The chart below shows an example of a falling wedge that formed in the WTI crude oil futures market:
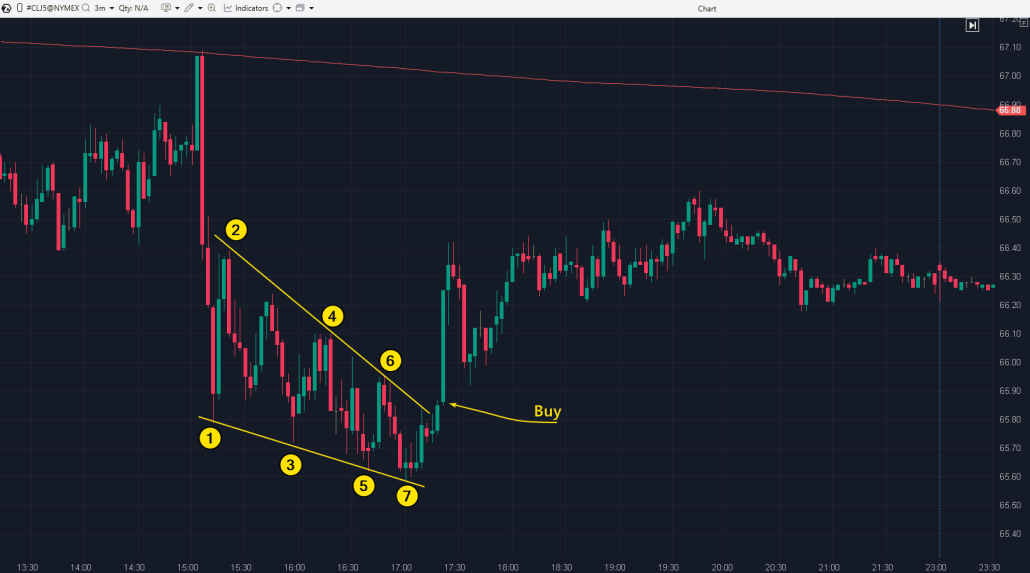
The red line at the top represents a simple moving average, indicating that bears remain in control — the price is trading below the average and continues to move downward. However, on one of the days shown, a falling wedge begins to form:
- 2-4-6 – the resistance line;
- 1-3-5-7 – support levels, with the distance between them gradually narrowing. This signals that bears are finding it increasingly difficult to push the price to new lows — and even more so to hold it there.
In such cases, classical technical analysis suggests expecting a bullish breakout above resistance, potentially signaling the beginning of an upward trend.
Trading the Falling Wedge Pattern
A classic falling wedge trading strategy – a step-by-step guide:
Step 1. Ensure the market is in a downtrend.
Step 2. Identify the falling wedge pattern on the chart. Draw the support line (the lower boundary of the pattern) and the resistance line (the upper boundary). These lines should converge, pointing toward each other.
Step 3. Wait for a breakout of the upper boundary of the wedge. A breakout accompanied by increased trading volume is considered a positive sign.
Step 4. Enter a long position immediately after the breakout of the resistance line (or wait for a candle to close above the resistance — this is called the signal candle).
Step 5. Close the trade if the price moves against you, and make sure to secure your profits in time.
Example. In the example above, the breakout occurred near the $65.80 level. The arrow marks the long entry point, taken at the opening of the candle following the signal candle.
How to Set a Stop Loss in a Falling Wedge Pattern Trading Strategy
Placing exit orders is a crucial element of capital management in financial market trading. Let’s look at two options for setting a stop-loss:
Option 1. The classic approach.
Place the stop-loss just below:
✓ the lower boundary of the wedge or the most recent local low.
For example, when the falling wedge is broken in this case, the stop-loss can be set just below the consolidation low (around $65.70), which lasted about 6 minutes before bulls broke through the resistance.
Option 2. The non-standard approach.
▪️ apply your custom position management strategy configured in exit strategies available in ATAS;
▪️ use footprint charts to find the most detailed signals for placing a short but well-justified stop-loss;
▪️ manually track price movement and adjust the stop-loss in the direction of the price to protect profits. Read more about what a trailing stop is.
How to Set Price Targets for Falling Wedge Pattern
Option 1. The classic approach.
To calculate the profit target, follow these steps:
▪️ Measure the maximum height of the wedge.
▪️ Add the measured value upwards from the breakout point. This will give you an estimate of how much the price could rise after the breakout.
In the falling wedge example above, the pattern’s height is measured between points 1 and 2, giving a value of 0.60 (66.40 – 65.80). If the breakout occurred around 65.80, the profit target would be 65.80 + 0.60 = $66.40. In this case, the target was reached in just two candles — one of the most favorable scenarios.
Option 2. A more flexible approach.
By considering the context, alternative methods can be used to forecast the target. For example, you could place a take-profit order within the BSL liquidity zone (a term from the Smart Money Concept strategy). Once the price reaches the target, you can partially close the position, anticipating the trend to continue.
Success Rate and Reliability of the Falling Wedge Pattern
Similar to the rising wedge pattern, renowned chart pattern expert Thomas Bulkowski considers the falling wedge to be a poor pattern for trading. However, he notes that the falling wedge can perform well when trading a downward breakout during a bearish market. This contradicts the original interpretation of the pattern, which suggests an upward breakout of the resistance and a reversal of the downtrend.
According to Bulkowski’s statistics, based on 800 examples of falling wedges formed on stock charts during a bull market:
- In about 2 out of 3 cases, the breakout level is tested.
- In approximately 3 out of 4 cases, the position reaches breakeven.
However, it is important to highlight an example of a falling wedge provided by Bulkowski: it does not appear as a formation at the end of a bearish trend but rather as a type of consolidation (correction), after which the uptrend continues. This underscores the importance of analyzing the context and stage of the market. And, of course, the need to use professional tools for analyzing market activity, available to modern traders.
Best Technical Analysis Indicators to Use With a Falling Wedge Pattern
Let’s examine another example of this pattern—again on crude oil futures, but this time on a footprint chart, using the Market Profile and Delta indicators.
The lines labeled R and S outline the falling wedge, with an additional wedge inside it. The upper boundary of this inner wedge is marked by line R2.
According to classical analysis, entering a long position on the bullish breakouts of these lines is likely to be profitable. After the breakout above line R2, the price did not fall below the breakout level, and the breakout above line R was followed by a rally.
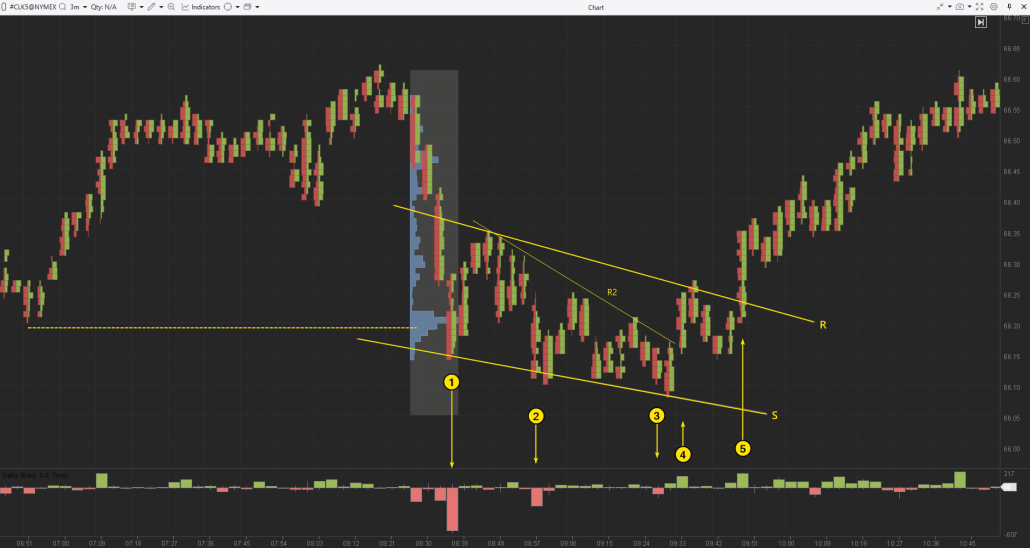
A volume-based approach. A closer examination of the footprint charts reveals the following sequence:
- The price moved below the previous local low (marked with a dotted line), triggering stop-losses from buyers — this is confirmed by a spike in negative delta (1), followed by a price increase on the next candle.
- After that, selling pressure began to weaken, as the delta gradually decreased on subsequent declines (2 and 3) — the price dipped only slightly below the prior low.
- In simple terms, the bulls recognized that bearish momentum had faded (or that the cluster of stop-losses below the dotted line had already been cleared — a concept referred to as a Liquidity Sweep in the Smart Money Concept) and decided to seize the initiative. This is evident in the surges of positive delta (4 and 5) as well as in the price breaking through the R2 and R resistance levels.
Advantages of volume analysis. As we can see, the second case offers a more meaningful interpretation and better reflects the intentions of market participants. This becomes possible through the use of delta indicators, market profile, footprint charts, and other tools that support more informed trading decisions.
Example: Falling Wedge as a Consolidation Pattern
Let’s examine a case from the euro futures market (see the footprint chart below), where lines R and S mark a falling wedge pattern that developed within an ongoing uptrend. This upward movement was driven by a weakening U.S. dollar amid concerns over the potential imposition of trade tariffs by the Trump administration in early 2025.
In this context, the falling wedge appears to represent a consolidation phase that took place during the Asian trading session (figuratively speaking — American bulls were already asleep, while European traders had yet to wake up).
The green arrow indicates the breakout of the resistance line forming the upper boundary of the falling wedge, which serves as a potential signal for entering a long position.
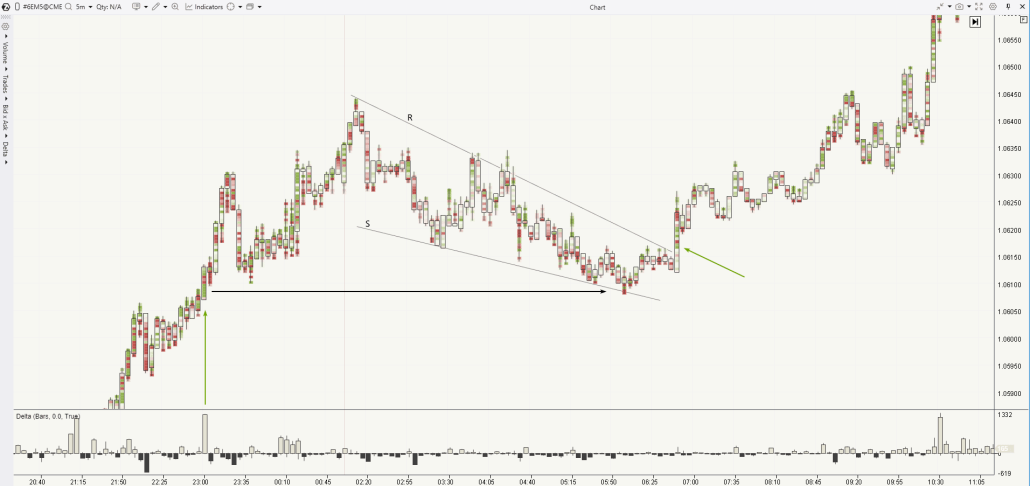
Footprint analysis offers valuable insights that can increase confidence and provide stronger justification for a long entry. Moreover, a more aggressive trading approach could have allowed for an earlier entry.
Note that in the left section of the chart, the first green arrow indicates bullish activity during a breakout above local resistance near the 1.0605 level. The Delta indicator shows a spike in positive values (evidence of significant market buying), which is clearly visible on the footprint chart. This level later acted as support, forming the low of the Asian session. The bright red clusters in the lower wick of the candle around 06:00 signal that the correction (in the form of a falling wedge) is likely coming to an end.
Learn more: How to Identify the End of a Correction.
Example: Falling Wedge on a Stock Chart
The following footprint chart shows an example of the pattern on a stock chart (in this case, NVDA on the NASDAQ exchange). Lines R and S form a falling wedge, illustrating a price decline.
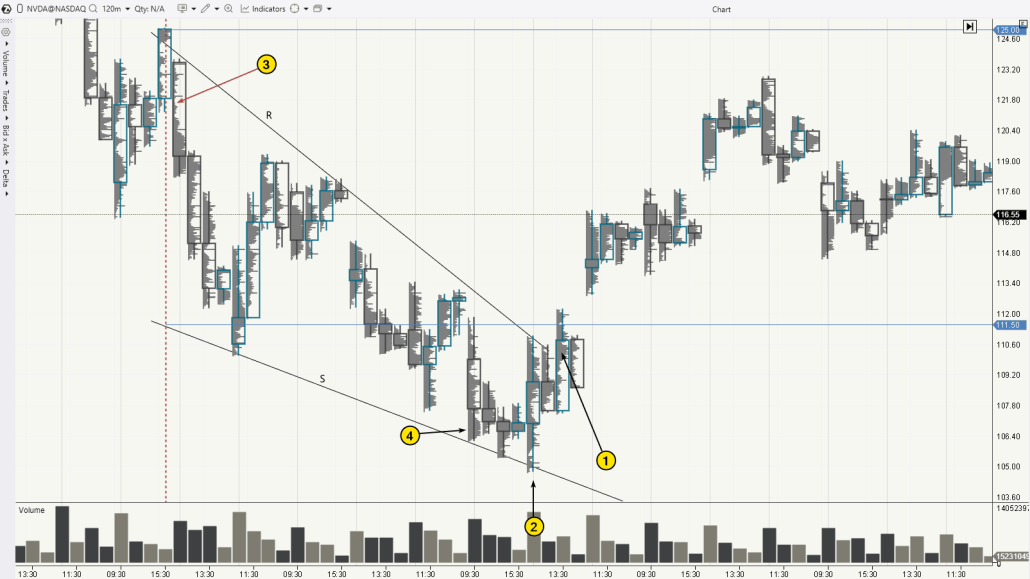
Key points are marked with numbers:
(1) Trading activity increased near the resistance level prior to the breakout. Buyers were likely accumulating shares from sellers, anticipating a continued drop following a short-term recovery.
(2) The price rose on a high-volume candle — a sign of strong buyer activity at the market open. This may have indicated a shift in sentiment toward the bullish side.
(3) A narrow profile at the market open, situated within a wide bearish candle, pointed to an imbalance where sellers were in control. Such areas often act as resistance. In this case, it prevented the price from reaching the target, which was calculated based on the maximum height of the pattern between 111.5 and 125, measured along the red vertical line (projected upward from the breakout point above the upper boundary of the falling wedge).
(4) High volume in the lower wick suggested confident buyer activity, as traders accumulated discounted shares. This resembled the Bag Holding pattern from the VSA strategy.
Tips and Questions on Trading the Falling Wedge Pattern
The falling wedge pattern is frequently encountered by beginner traders. Despite its popularity, it raises several questions: How can one accurately identify a breakout? How can the pattern be confirmed? And what should be done if the price does not exactly touch the boundaries? Due to these uncertainties, many novice traders face challenges. However, using volume analysis indicators can help avoid mistakes and enhance the precision of trading decisions.
What is a falling wedge in trading, and what does it mean?
The falling wedge is a chart pattern that forms when the price declines with a narrowing range of fluctuations. These fluctuations are bounded by converging lines (support and resistance) that slope downward, visually resembling a wedge. According to classical technical analysis, this pattern, appearing after a period of declining prices, suggests a potential reversal to an upward trend. However, in practice, this scenario requires solid confirmation, as it involves taking long positions against a bearish trend.
How to trade the falling wedge?
Like other chart pattern breakouts, wait for the price to close outside the pattern and open a position in the direction of the expected trend (alternatively, you can wait longer to enter on a test of the breakout level).
Useful information on the topic:
What are the best time frames and markets for trading the falling wedge?
The falling wedge is a versatile chart pattern that can be traded on any market and time frame. It is often thought to be more reliable on higher time frames (such as 1-hour, 4-hour, or even daily charts), but this is not always the case. The effectiveness of trading the falling wedge depends more on the trader’s expertise and the tools they use, rather than the specific market choice.
Is the falling wedge a bullish or bearish pattern?
By default, the falling wedge is considered a bullish reversal pattern. However, the converging downward lines can appear in different contexts. For example, when a falling wedge forms in a bearish market, a steeper angle of the resistance line may indicate selling pressure, suggesting that the downtrend could continue. In this case, the falling wedge acts as a bearish continuation pattern.
What is the difference between a falling wedge and a rising wedge?
These patterns are mirror images of each other. For more details, see the article about the rising wedge.
How to learn to trade the falling wedge?
Use the ATAS Market Replay. Practicing in a market simulator is one of the best ways to learn to trade various strategies. Replay historical data in real time, identify chart patterns (including the falling wedge), and develop your trading skills on the built-in demo account. You can then analyze your mistakes—all without risking real capital.
To try the simulator,download the ATAS platform for free, install and launch it, and then:
- Click on the Market Replay button in the main ATAS menu.
- Activate the Replay mode (the icon should turn green).
- Adjust settings (date and data type).
- Start the replay (you can adjust the speed and pause it).
- Have you spotted the falling wedge? Trade using the Chart Trader panel.
Conclusion
The falling wedge is a chart pattern in technical analysis that is believed to signal a potential change in market direction. Typically forming during a downtrend, this pattern indicates the emergence of buying pressure that prevents the price from continuing to fall at the same pace.
Advantages of the falling wedge pattern
✔ Versatility. This pattern can be applied to a wide range of assets, including stocks, forex, commodities, and cryptocurrencies.
✔ Profit potential. Since trading the wedge involves a breakout from consolidation, it offers the opportunity for traders to enter at the start of a new trend.
Disadvantages
✘ Risk of false breakouts. A trader may find themselves buying at a local high. It is crucial to approach this cautiously—such as by incorporating volume analysis indicators into the decision-making process (alternatively, consider switching strategies and trading not the breakout, but the test of the breakout).
✘ Importance of market context. Analyzing the market structure and understanding the position of the falling wedge within it can boost confidence in trading. However, this can be a challenging task for novice traders.
✘ Subjectivity in interpretation. Identifying and accurately interpreting the falling wedge is always a subjective process. Different traders may interpret price movements in different ways.
We hope you now have a clearer understanding of what the falling wedge is in trading, how to trade it, and whether it is worth trading at all. The ATAS platform is here to help you succeed in your trading journey.
Do not miss the next article on our blog. Subscribe to our YouTube channel, follow us on Facebook, Instagram, Telegram or X, where we publish the latest ATAS news. Share life hacks and seek advice from other traders in the Telegram group @ATAS_Discussions or on Discord.
Information in this article cannot be perceived as a call for investing or buying/selling of any asset on the exchange. All situations, discussed in the article, are provided with the purpose of getting acquainted with the functionality and advantages of the ATAS platform.


