
What is a spread?
A spread is the difference between the best bid and ask. In other words, the spread is the distance between:- the highest price a buyer is ready to pay;
- the lowest price at which the seller is ready to part with a financial asset (futures contract, stock or cryptocurrency).
Why do wide spreads occur?
The spread width on the stock exchange is a variable value. It should be obvious. The spread can widen for various reasons. We believe the most common of them are: Spread widening at night or during the holiday period. When trading activity goes down, the DOM “empties”. The number of buyers and sellers naturally decreases, therefore, supply and demand spread occurs. Fewer trades are made at the price that suits both parties. Due to order matching algorithms. Order matching is a way (predetermined by the exchange) for buyers and sellers to find each other. It means that orders are matched in a trade. This is a rather complicated process, and we talked about it in detail in the following article: During high order flow on the exchange, matching algorithms can produce unusual results under extreme conditions — spread widening is one of them. This is possible during the release of important news or breakouts of important levels when the price gets into a cluster of stop-losses. In unpopular markets. For instance, shares of unknown companies or futures contracts that are far from expiration (what is futures expiration). As a result of forex brokers’ manipulations. This does not apply to trading on a centralized regulated exchange. As a result of technical failures on the exchange. Or due to actions of high-frequency trading algorithms (HFT).How to identify widening spreads
To identify the widening spread in real time, you can use the market depth indicator in the ATAS platform. The only downside is that monitoring spread changes can seem too tedious and monotonous. However, identifying the spread on a historical chart seems like a more interesting task. Try switching to non-standard chart types. For example, range charts. When the spread exceeds the range value, you will see characteristic gaps. You can also try tick charts. Below you see a bitcoin futures chart. A small tick is selected for illustrative purposes, the classic ATR indicator is also added to the chart.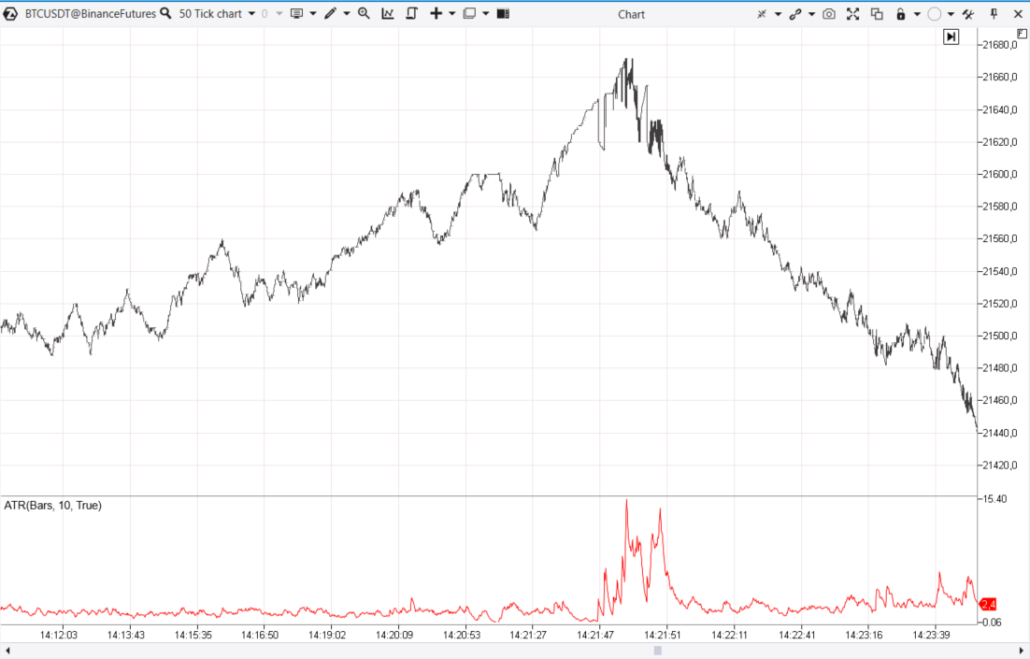
Then the amplitude of fluctuations increased. The tick chart began to draw wide candles. As if a seismologist detected an earthquake. It is likely that the spread was widening at that moment, therefore, there were price spikes between adjacent trades.
ATR helps visually recognize this moment. Market context aside, it can be assumed that the balance of supply and demand changed. There was a trend reversal. The amplitude returned to normal (more or less), but the price plunged down. And here is another example of a tick chart with the ATR indicator. This is DAX index futures.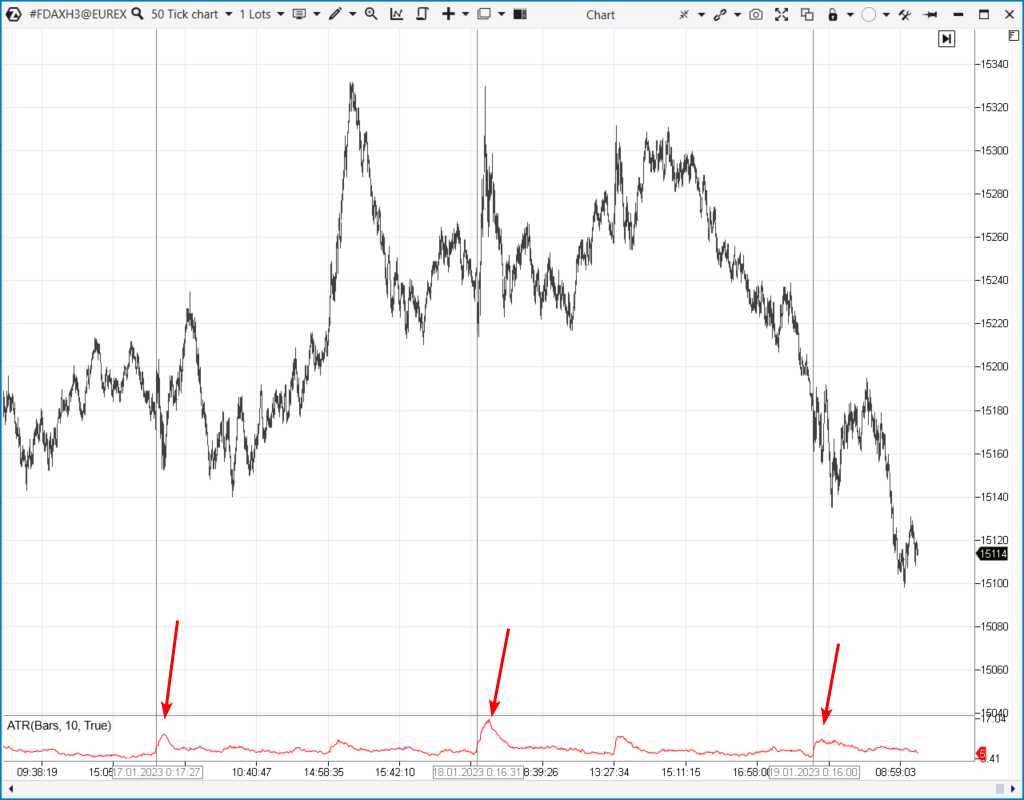
Dangerous features of the widening spread
The widening spread means that the risk is increasing. If you buy during the wide spread, you can only make money if the price passes the entire spread’s width. Wide spread = more chances that:- a stop-loss will be activated;
- an order will not be executed at the desired price;
- you will make a mistake because the decision must be made quickly (unless we are talking about the widening spread occurring at night in an unpopular market).
How to use the widening spread in trading
The example above shows how the widening spread can indicate a trend reversal. But how accurate is this signal? Does a reversal always occur? First you need to carefully analyze the history and characteristics of the market. Due to the difference in order matching algorithms and the unique features of each market, spread widening patterns can have a different look. Moreover, spreads may not widen at all or widen very rarely. The examples below can provide some food for thought, as well as ideas for building your own strategies.Example 1. Euro futures
This is a range chart. At some point, the candles became wider than the set range size. The ATR indicator signals a key moment when the spread must have been widened. It seems that after a period of growth, a sharp decline in the price led to some panic.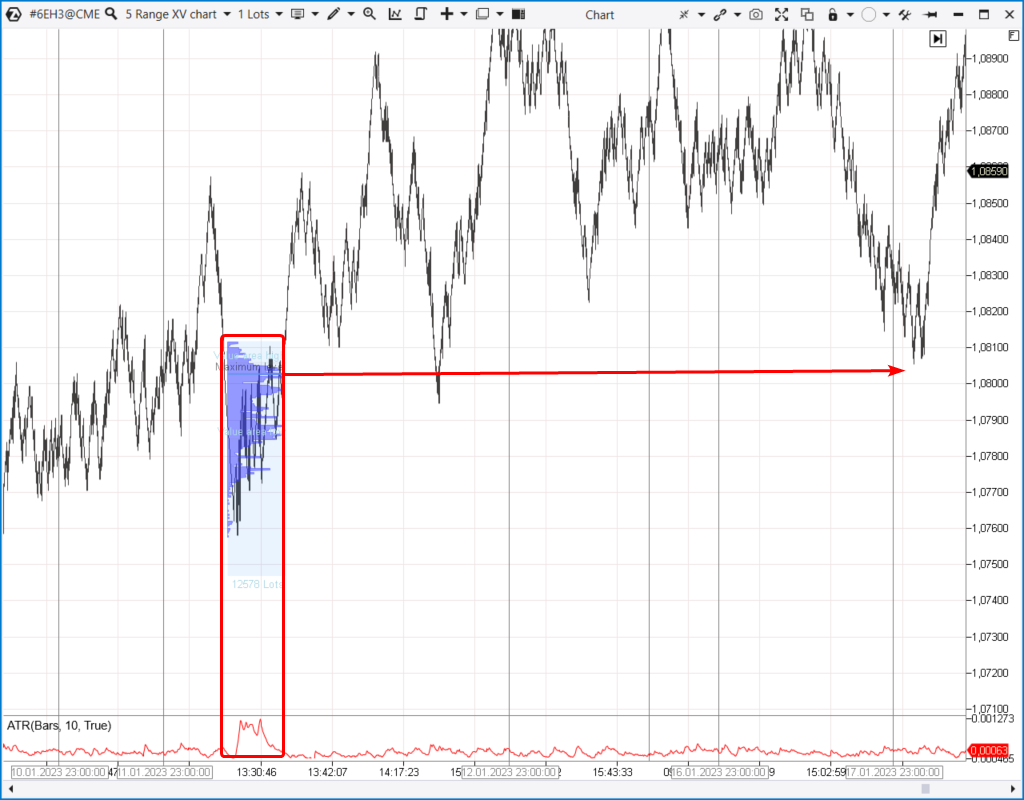
The price went up after a spike on the ATR indicator — this gives reason to believe that weak buyers were “thrown out”, and the mood remained bullish.
It can be applied in practice in the following ways: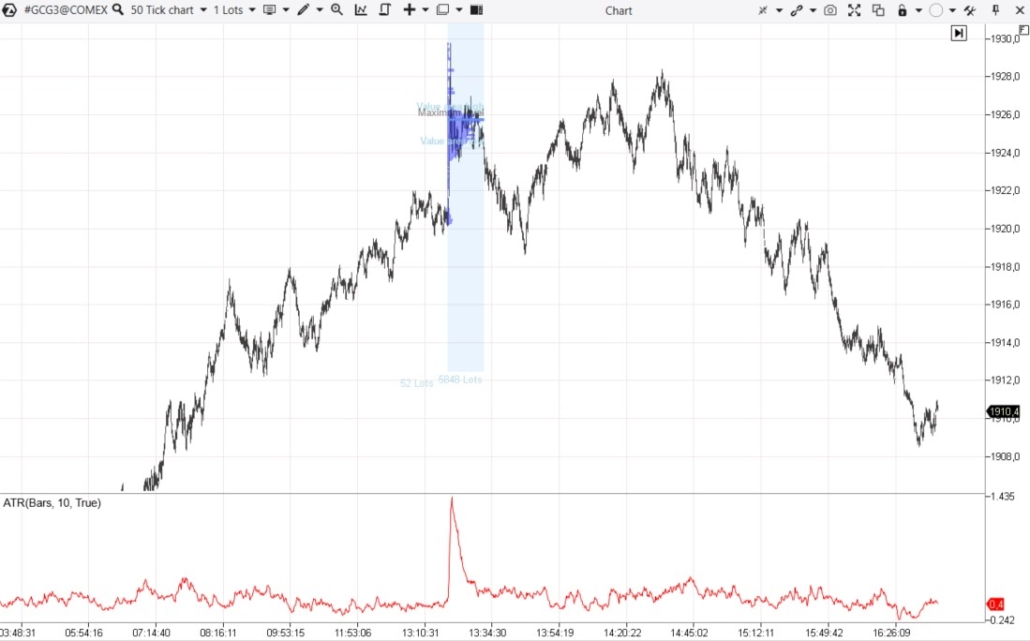
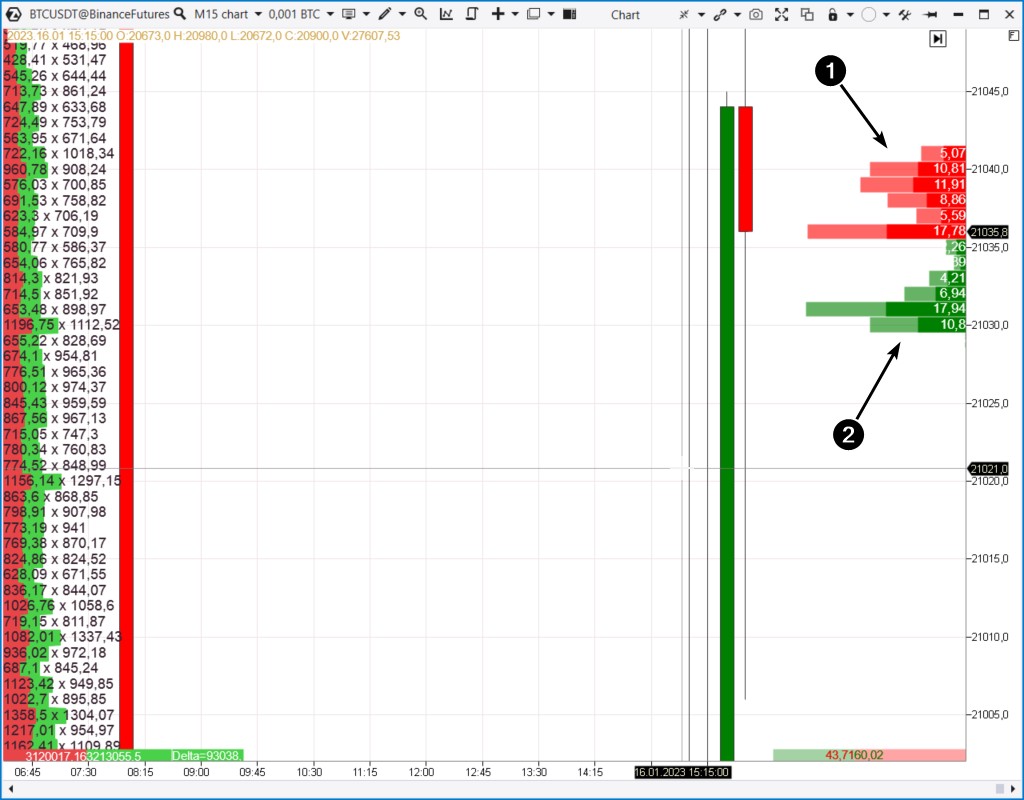
Example 3. Bitcoin futures
Data from the Binance exchange. The chart suggests that there was a widening spread around 17:48 after the price fell below the 19300 level. Perhaps there was a cluster of stop-losses. Market sell orders were matched with limit buy orders. Market buy orders were executed at the best selling prices. Since the spread between the best prices is wider than usual, the candles’ height significantly exceeds the usual range size.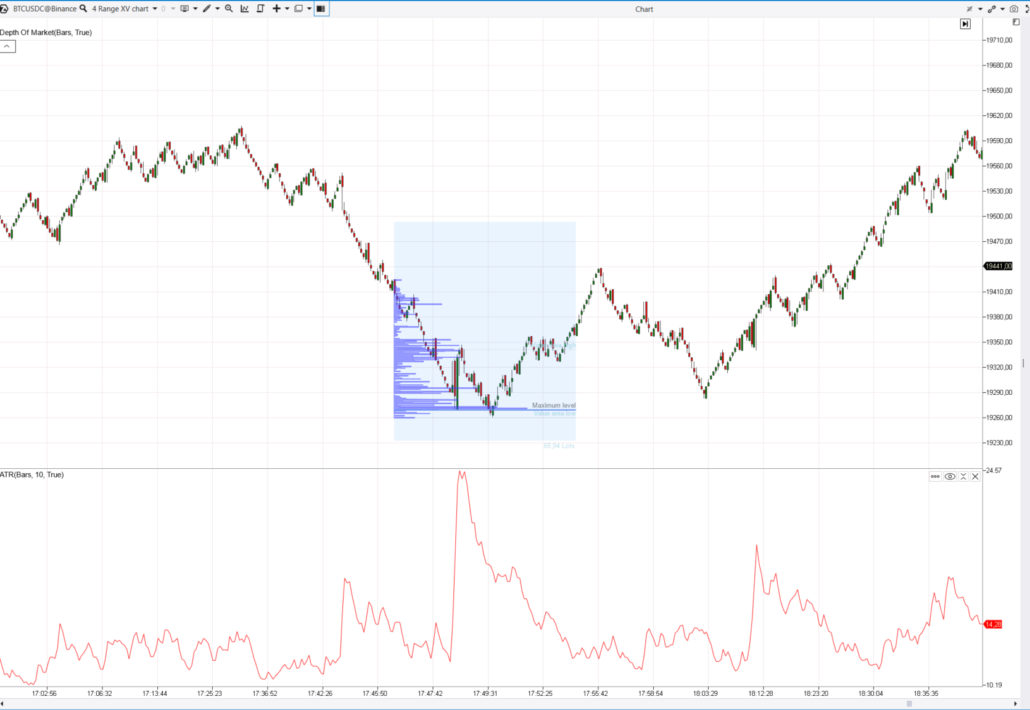
Example 4. Another futures from a cryptocurrency exchange
Let’s have a look at a range chart of meme cryptocurrency futures.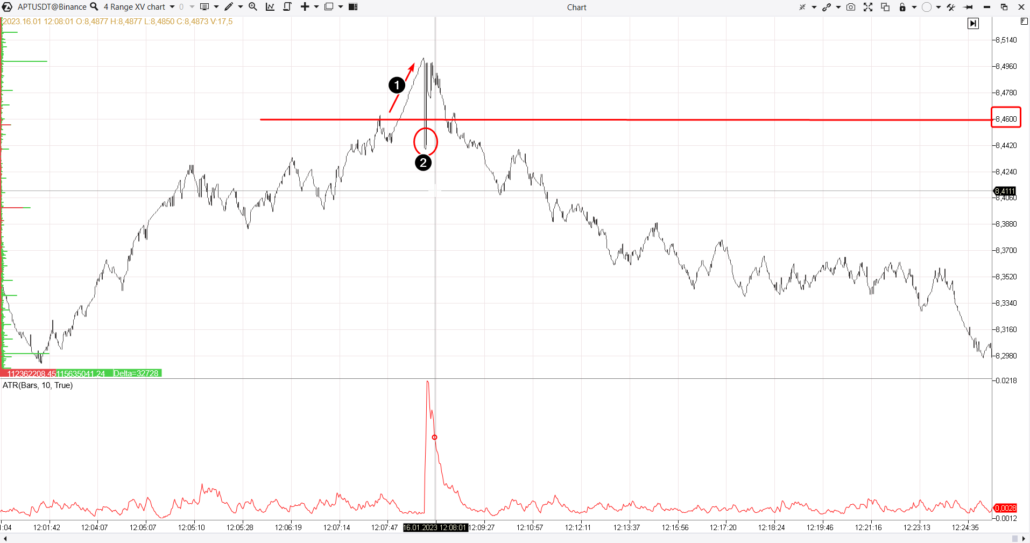
How to start using widening spread signals
Before risking real money, you must make sure that you can earn more than lose in the long run. There cannot be 100% winning trades, but the odds should be in your favor. This is true for any strategy. ATAS will help you build your own strategy using a widening spread. Download Free Trial ATAS. There are at least four good reasons for that:- It is free and you can continue using the program even after the 14-day trial period.
- The platform enables you to download tick history from the futures, stocks and crypto markets to see if a particular widening spread will give you a trading advantage.
- Market Replay (a simulator for a trader) is built into the ATAS platform. You can practice trading without risking real capital.
- The platform offers many benefits for traders who want to combine momentum and pullback trading with user-friendly cluster charts and useful indicators.
Information in this article cannot be perceived as a call for investing or buying/selling of any asset on the exchange. All situations, discussed in the article, are provided with the purpose of getting acquainted with the functionality and advantages of the ATAS platform.


