Read in this article:
- What scalping is;
- Scalping possibilities in the ATAS platform;
- Scalping in the order book;
- Scalping with the Heiken Ashi indicator;
- Example of trading in the real market;
- Important scalping parameters;
- Advantages and disadvantages.
What scalping is
Scalping is such a trading style, which is characterized with a very short period of holding positions with the profit rate in several ticks. The “short period” is a rather vague notion. As a rule, scalpers hold their positions from several seconds to several minutes and operate on second and/or minute charts.You can find an opinion in the Internet that scalping is the most profitable trading strategy, since one can increase the initial deposit in 100 times during one month. Theoretically, it is possible. For the deposit grows like a mushroom collecting profit from all small intraday fluctuations. But every coin has its reverse side. A possibility of quick and big profit is always accompanied with higher risks.
What markets is the scalping applied at?
Scalpers prefer volatile markets where asks and bids (what asks and bids are) are close to each other. Inactive and slow price quotes with a thin order book is not the place where scalpers operate. The examples of platforms for scalping are volatile futures on oil, gold, exchange indices (such as NQ futures) and popular currency pairs.Dealers that provide trading services in the over-the-counter Forex market give a possibility to use the credit leverage of up to 1:500. It is very attractive for beginner scalpers, since a probability of fast profiteering becomes absolutely blinding.
What software is required for scalping?
As a rule, standard trading terminals, which are provided by brokers to their clients are not acceptable for making frequent trades. That is why scalpers use special software. As a result, their working space looks like a gaming space where everything moves and flashes.One of the most advanced platforms for scalping is ATAS, which you can download free of charge from the atas.net main page for testing.
How to trade with scalping elements
Figuratively speaking, scalping is a trading universe, but observed at the highest speed and in the maximum approximation. There is a huge multitude of approaches to formation of a scalper’s trading plan and it is practically impossible to consider all of them in one article.We will consider three variants of scalping:
- Scalping in the order book;
- Scalping by Heiken Ashi candles;
- Scalping with the help of the cluster analysis.
Scalping in the order book
A special functional Smart DOM (DOM – Depth Of Market) drive was developed in the trading and analytical ATAS platform for trader’s work with the order book.
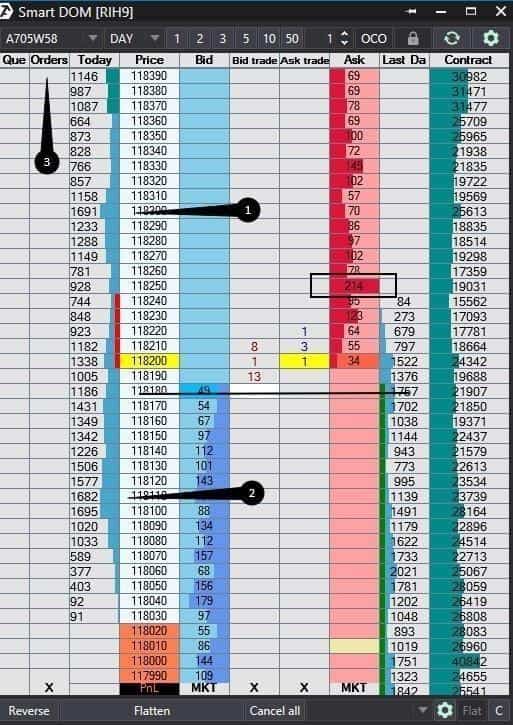
- sell and buy orders are posted and cancelled in one go (3);
- it is easy to assess the general number of limit buy and sell orders visually;
- it is easy to detect levels, at which significant volumes were traded (1, 2).
Monitor the price reaction at the closing and opening levels of the previous day. Note the price approaches to the big limit order levels. If big limit orders (marked with a black rectangle) are posted with true intentions, they will stop the price movement.
In order to understand how true intentions behind these orders are, you can check the volume (traded at this level), which is available in the real time mode in the Bid trade/Ask trade columns.
It is fast and easy to trade and informative to analyze by the Smart DOM book.
Scalping with the help of the Heiken Ashi Indicator.
A Swedish trader Dan Valcu published an article in the Technical Analysis of Stocks & Commodities American magazine in February 2014 about a new display of Japanese candles using the method of price averaging. It is called Heiken Ashi in the Japanese language. The popularity of Heiken Ashi has grown up significantly since then.A trader, who is known as Heikin Ashi, wrote the Scalping Is Fun series of 4 books. He specialized in scalping and intraday trading for more than 15 years and his Scalping Is Fun is completely about trading with the help of the Heiken Ashi Indicator.
You can find the Heiken Ashi Indicator in the list of ATAS technical indicators.
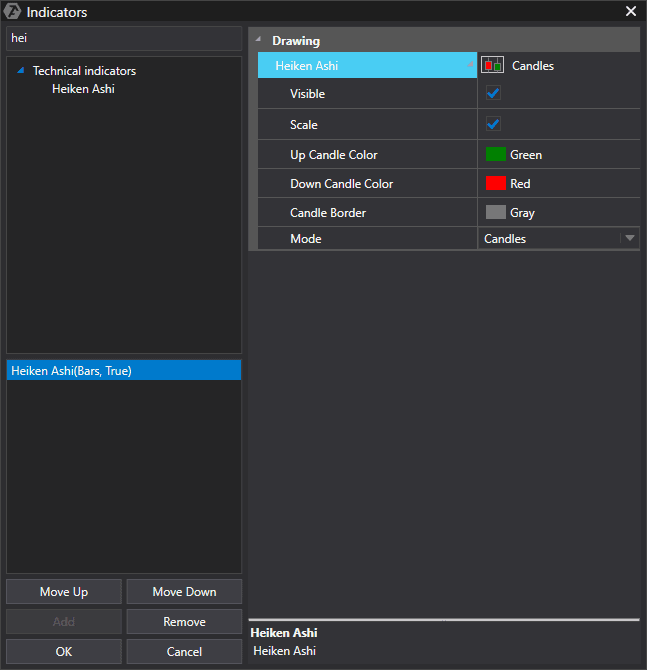
- Price of opening of the current candle is calculated as an average value between the price of opening and price of closing of the previous candle;
- Price of closing of the current candle is calculated as an average value of the high, low, opening and closing of the current candle.
You can find a detailed calculation algorithm in the Knowledge Base. This indicator shows a focused movement with the help of colors. Green candles are a bullish trend while red candles are a bearish one. The indicator goes together with the technical and cluster analysis instruments. It could be used as a basis for building more advanced trading strategies.
| Trend | Bullish market | Bearish market |
| Trend beginning | Growing green candles | Falling red candles |
| Trend strengthening | Candle bodies become longer | Candle bodies become shorter |
| Trend fading | Candle bodies become shorter while the upper shadow becomes longer. Candles do not form new price highs. | Candle bodies become shorter while the lower shadow becomes longer. Candles do not form new price lows. |
| Trend consolidation/reversal | Emergence of doji or candles with long two-sided shadows. | Emergence of doji or candles with long two-sided shadows. |
Let us consider an example in 1-minute chart of a mini DAX index futures (FDXMH9).
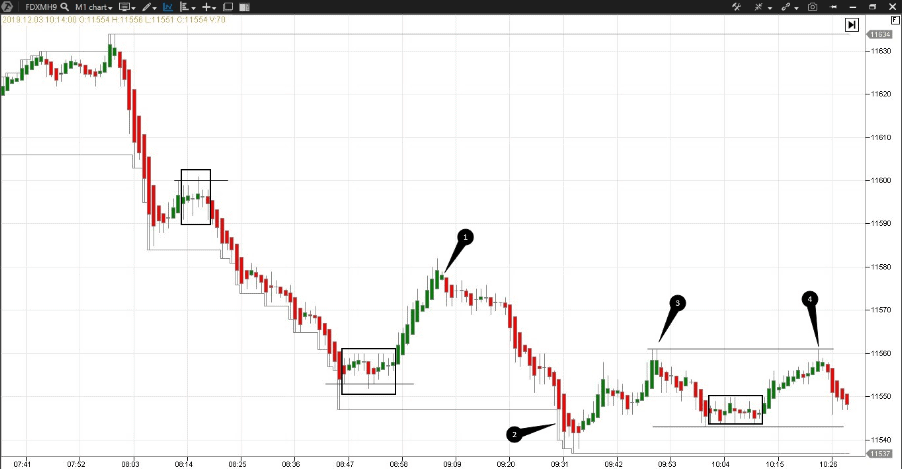
Number 1 marks a small candle – the last one of the growing trend. It makes sense to register profit and look for a point of entry into a trade in the opposite direction when such a candle emerges. Number 2 marks reducing candles at the level of the day’s low and it makes sense to think about registering profit. Numbers 3 and 4 mark a double peak in a range. It is convenient to open short positions from this level with a limit order with a small stop.
The most simple rules of scalping with the help of the Heiken Ashi indicator are the following:
- trades are opened at significant levels – these could be support/resistance levels, day’s lows/highs and round numbers;
- counter-trend trades are opened when exiting a consolidation area towards a new trend, identified by the candle color;
- trades are closed when the first candle of the opposite to the current trend color emerges;
- if the market cannot move higher, it means that it will move lower and vice versa.
While scalping you smoothly move from the short position into the long one in harmony with market waves and enjoy the process.
Important! The above instructions are provided in educational purposes and there is no guarantee that they will work profitably in your situation. Try your scalping skills using a demo account before you start trading using the scalping elements.
Example. The chart below shows an example of a real-life trade in the USD/RUB futures (SI-3.19) market.
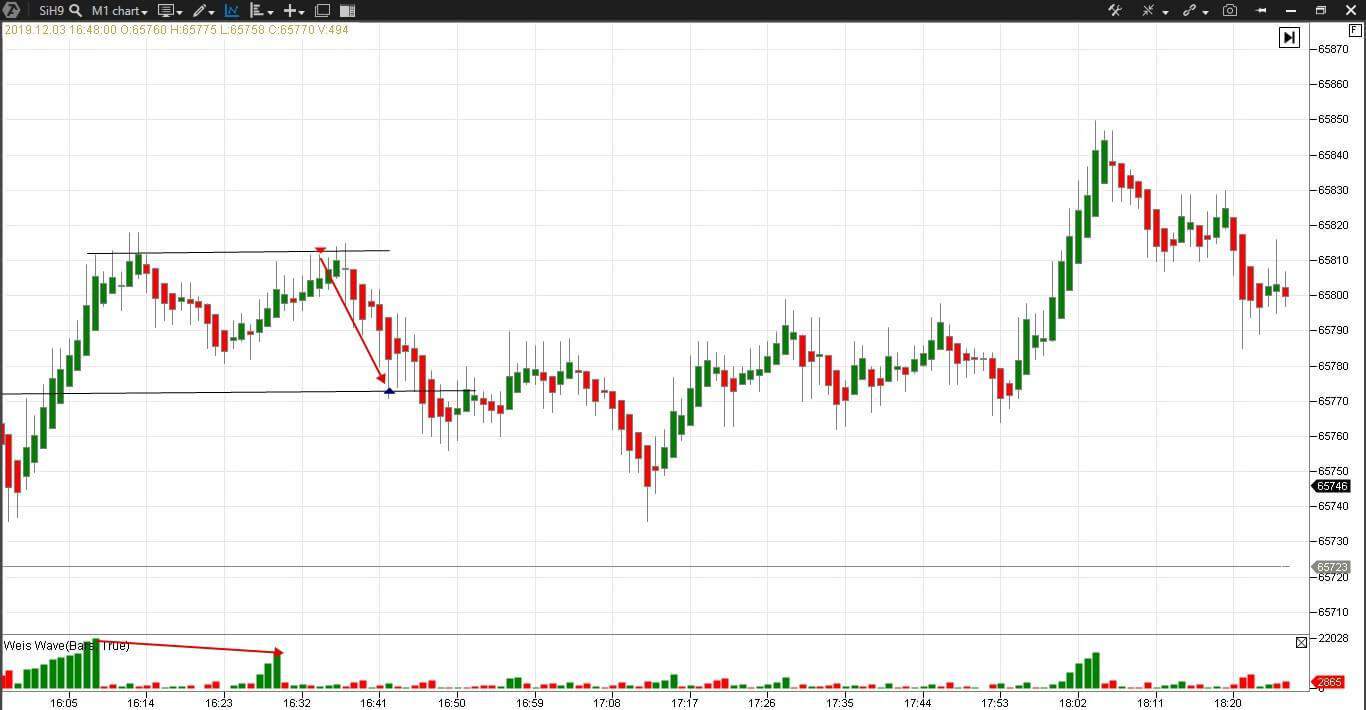
- daily highlow – dynamic day’s high and low. The price reacts to these levels and it is convenient to trade from them since the stops are minimal;
- Weis Waves – this indicator works worse in minute charts than in charts that are not time-related. The wave on the second peak was less in this trade than the wave on the first peak, which additionally confirmed a short sell.
The trading and analytical ATAS platform allows trading directly from the chart in one go, which significantly simplifies the process and contributes to better trading efficiency.
Scalping with the help of the cluster analysis
Many scalpers trade using minute charts, that is why all of them see the same picture. The trading and analytical ATAS platform can increase the rate of response with, for example, tick charts and accuracy with the cluster analysis.Example. Look at the tick chart of a E-mini Nasdaq futures (NQM9). On the one hand, this chart type does not depend on time and a new bar appears every 25 ticks. On the other hand, this chart type is built faster than the minute one for this futures. We will add the delta indicator in order to see aggressive buyers and sellers.
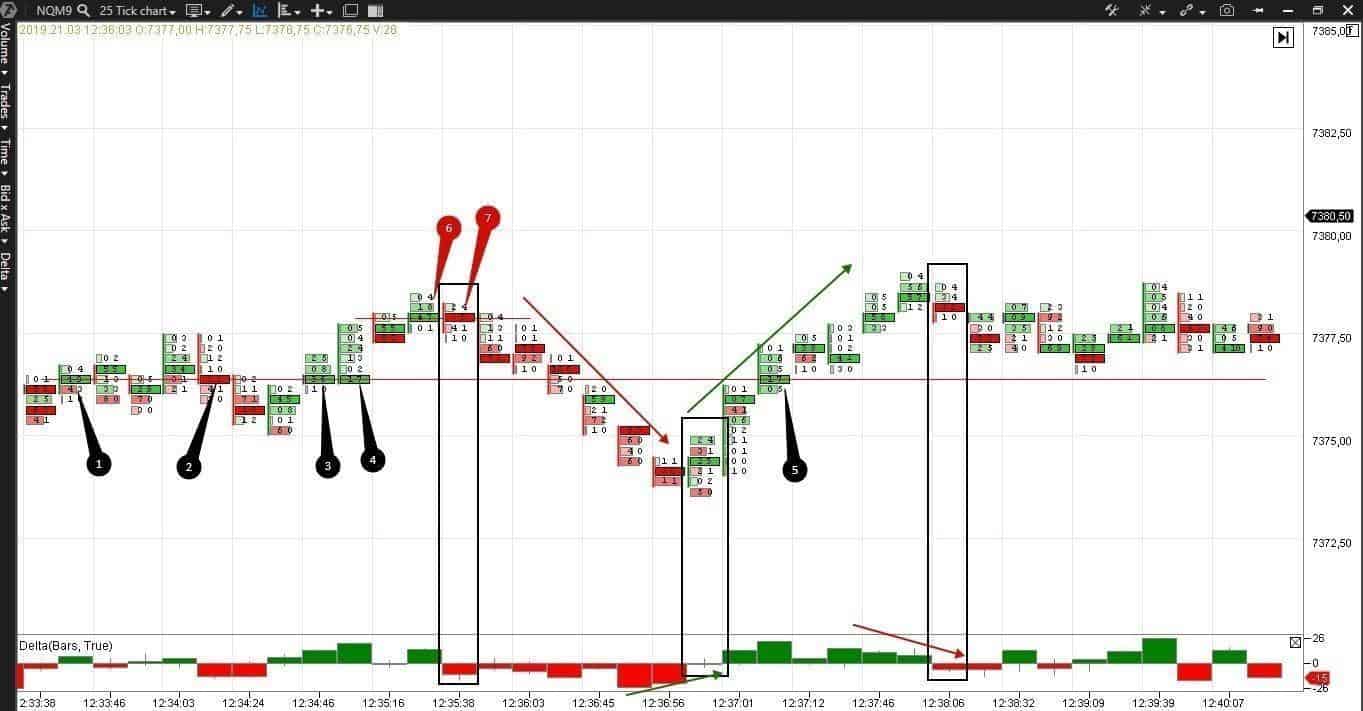
- The bars are formed faster than the minute ones;
- The levels of the maximum volume of each bar, marked with black and red numbers, line up as a support or resistance level right in front of our eyes. The price, as a rule, slows down at these levels and tends to change the movement direction. Also, it is convenient to locate limit and stop orders here;
- The levels of the maximum volume consistently move upward or downward, which is confirmed by the ascending or descending trend (marked with red and green arrows in the price chart);
- The delta changes its color on top or in the bottom of the current trend, which warns about a reversal (the bars are marked with black rectangles);
- We can see divergence of the delta and price, which means that the price reaches new peaks/valleys while the delta doesn’t. This also warns about a reversal (red and green arrows in the delta chart).
At first sight, these details are insignificant. But they form a substantial competitive advantage during a series of trading sessions.
Important scalping parameters
- Stop-loss should not be more than several ticks;
- Payoff-ratio – an average profit/loss should stably be higher than 1. This indicator is more important for scalpers than for position traders because commission fees are significantly higher in scalping;
- Hit rate – a number of profitable/loss-making trades. This indicator is less important for scalpers than the payoff ratio; the 55-60% level will be very decent;
- The Scalping Is Fun author uses one more parameter – Expectancy, or expected profitability of trades.
Expectancy= (hit rate of profitable trades * average profit) – (hit rate of loss-making trades * average loss).
From the point of view of trading, this is a number of profit ticks a trader might get in each next trade, based on statistics of his previous trade.
Calculation example:
| General number of trades during a week | 40 |
| Number of profitable trades | 24 |
| Number of loss-making trades | 16 |
| Average profit, ticks | 4,5 |
| Average loss, ticks | 6,5 |
| Hit rate | 24 / 40=60% |
| Payoff-ratio | 4,5 / 6,5=0,69 |
| Expectancy, ticks | (0,6 * 4,5)-(0,4 * 6,5)=0,1 |

