In general, the technical analysis indicators are designed to help traders in assessing the market situation and making respective trading decisions. In fact, indicators are mathematical methods of filtration, stemming from formulas.
Multiple indicators and their combinations help traders to:
- identify trend movements, their strength or fading;
- identify the flat;
- find possibilities for opening and closing positions.
We already wrote about such classic technical analysis indicators as RSI, Bollinger Bands, CCI and MACD. In this article, we will tell you about one of the most popular indicators – Moving Average.
Read in this article:
- What the Moving Average (MA) indicator is.
- Example of the indicator.
- How to set up the Moving Average.
- Examples of trading strategies.
What the Moving Average indicator is
Perhaps, Moving Average is the simplest method for identifying the trend direction. It is a technical analysis indicator, which means that all previous period prices are summed up and divided into the number of periods.And we get the line of average prices, which is:
- either moves up (uptrend),
- or moves down (downtrend),
- or slightly fluctuates (flat).
Advantages of the approach:
- Moving Average smoothes prices and removes sharp fluctuations.
- Allows making a quick assumption with respect to the trend direction.
- The Moving Average (MA) indicator could be combined with the cluster analysis.
- Moving Averages lie in the basis of some technical indicators, for example, MACD and Bollinger Bands.
Most commonly, three types of averages are used:
- SMA – Simple Moving Average. Values of the futures periods, including the current one, are summed up and divided into the number of summands. For example, in order to calculate the 22-day SMA, you need to sum up the values for the previous 22 days, including the current one, and divide the sum into 22. All prices, including the most distant ones, are equally important in the Simple Moving Average.
- WMA – Weighted Moving Average. Many analysts believe that fresher prices exert a bigger influence on the current price than the older ones, that is why WMA emerged. To calculate such an average, the prices are ‘weighted’ by their closeness to the current price. Fresh data get a bigger weight, that is why WMA is closer to the price chart and it is less smooth than SMA.
- EMA – Exponential Moving Average, which is one of the special cases of WMA. When EMA is calculated, the prices are not weighted but multiplied by certain ratios depending on their remoteness. The prices, which are closer to the current moment, are multiplied by higher ratios. Thus, EMA is also closer to the price chart and it is also less smooth than SMA.
Example of the indicator
Let’s consider the example of the Moving Average for each of the three types in the 5-minute E-mini S&P 500 futures chart.We added the SMA red line, WMA black line and EMA blue line to the chart. The length of all indicators is 11 periods. See Picture 1.
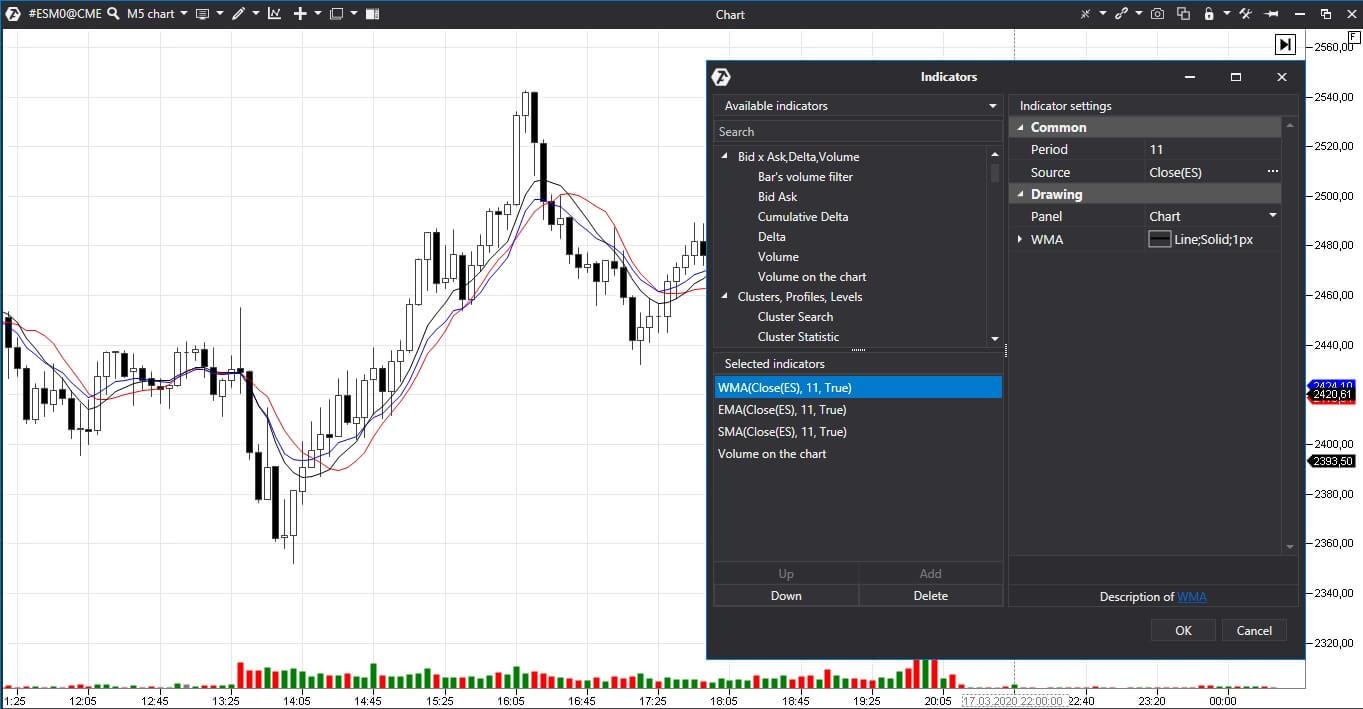
Moving Averages could be calculated by any price – high, low, opening or closing. Some traders believe that it is more expedient to use average prices for a selected period rather than closing prices.
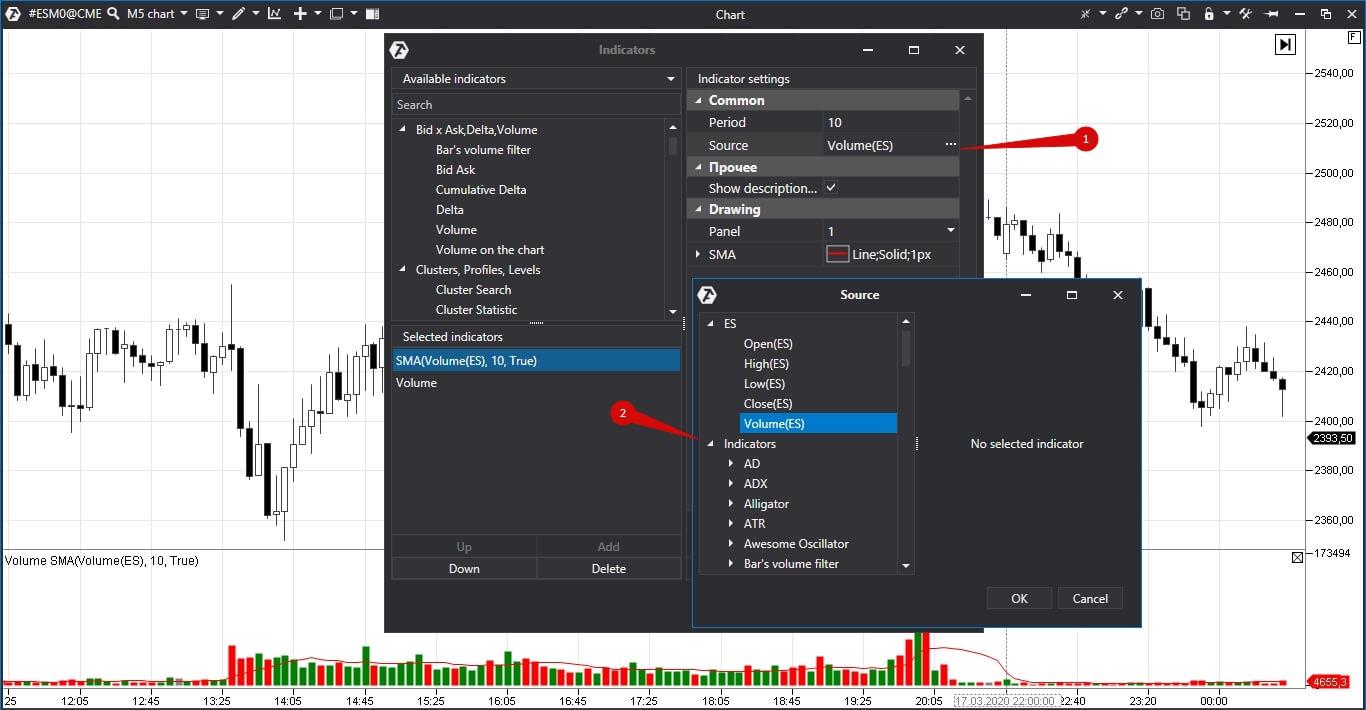
The Moving Average chart could also be built in ATAS by indicators, for example, Volume or ATR. To do it, you should select the desired indicator as the source of data. See Picture 2.
The Moving Average indicator is the simplest trend indicator. He may help to identify the current trend and find the signs of its possible change.
- If the asset price is above the Moving Average, it is an uptrend and the buyers are happy with the profit.
- If the asset price is below the Moving Average, it is a bearish trend and the sellers are happy.
- Trend changes when the price chart intersects with the indicator.
How to set the Moving Average
Technical analysis books offer to apply the following MA settings for various trade situations.| Trend | Length of the Moving Average |
| Very short | 5-13 |
| Short | 14-25 |
| Medium-short | 26-49 |
| Medium | 50-100 |
| Long | 100-200 |
Moving Averages are closely connected with cycles. For example, the most well-known cycle of the futures market consists of 22 days – it is approximately a calendar month. A bigger cycle is two times longer than the 22-day one and a smaller one is 2 times shorter. Namely, that is why the popular periods of Moving Averages are 22, 11 and 5.
For long-term trends, traders often use the 39-week or 200-day Moving Average.
In the general case, analysts offer to use the following formula for calculation of an ideal Moving Average – (Cycle length + 1)/2.
The Moving Average is used in order to identify the support and resistance levels by curves.
Example of the Moving Average
Let’s consider an example of building lines in the 15-minute Nikkei index futures chart. We use SMA with the period of 5. However, the length of the Moving Average should be identified experimentally for different instruments. See Picture 3.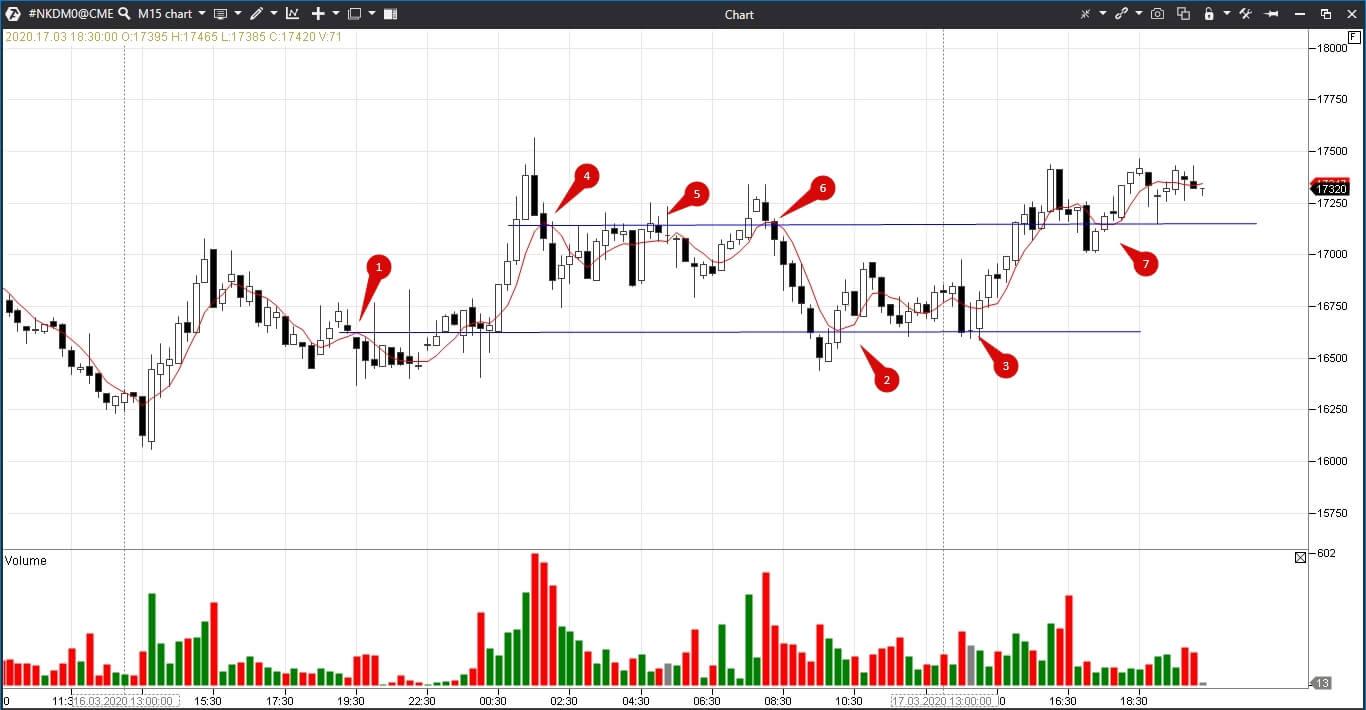
The red levels mark ‘internal’ curves. There are many of these levels and not all of them could be significant. Let’s see how the price interacted with the levels built by the Moving Average curves.
- The price didn’t return back to level 1 during the day.
- Level 2 worked as both support and resistance.
- Level 4 held down the price during the whole trading session but turned into the support level on the next day.
- There are many levels in rectangles 3 and 5, which creates a certain chaos. In order to avoid it, it is possible to change the Moving Average parameters. However, the price also slowed down at red levels and it was possible to work there.
- Two upper black levels attracted the prices during the whole trading session and it was possible to use them both for opening positions and for the take profit.
Drawbacks of the Moving Average
- The smoother and longer the Moving Average chart, the bigger it lags the price chart.
- Many false signals emerge if short periods are used. Traders have to look for a compromise between lagging and false operation.
Examples of trading strategies that use the Moving Average indicator
The first and most widely used variant is to open trades when intersecting the chart of the price and indicator. Example – 5-minute Alibaba Group stock chart with SMA and period of 22. See Picture 4.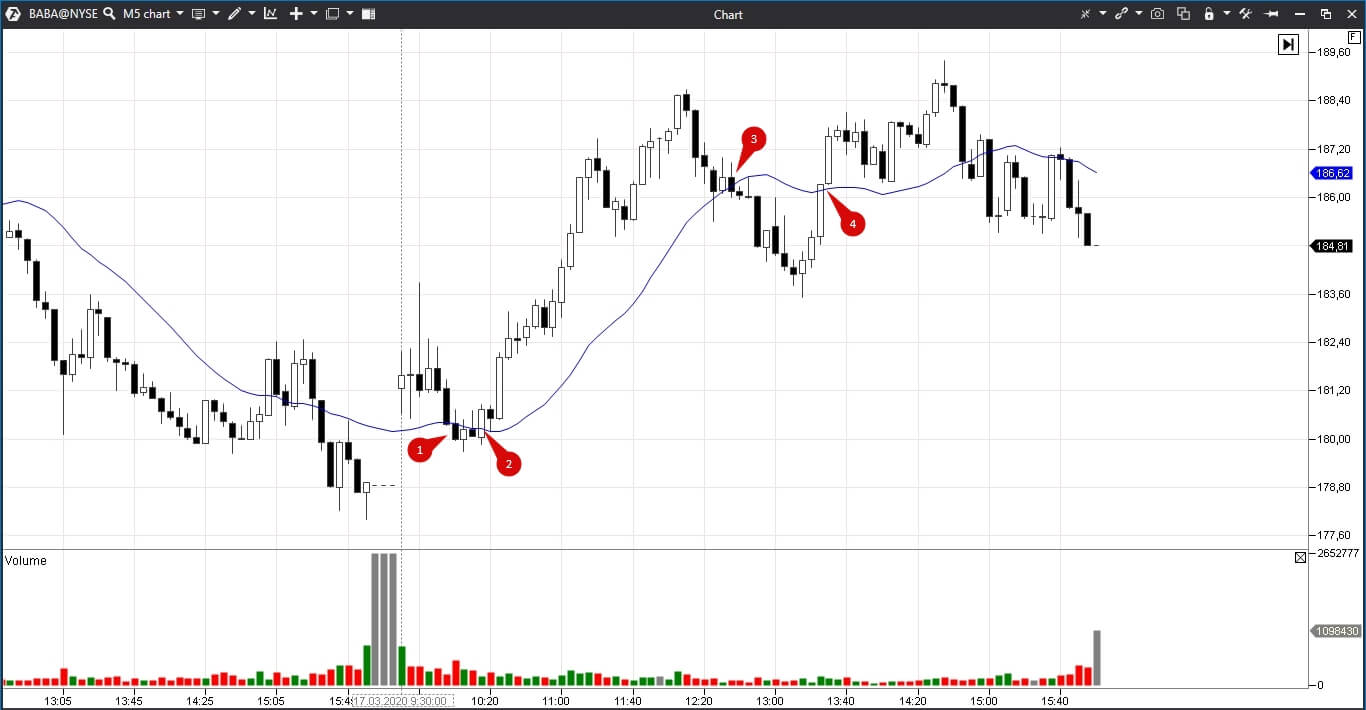
- Point 1: the candle closes below the Moving Average after the intersection, which means that you should sell here.
- Point 2: the candle closes above the Moving Average after the intersection, which means that you should buy here. If a trader uses a non-stop system, he closes one trade and immediately opens another one.
- The sell signal again appears in point 3 and a buy signal – in point 4.
Despite the fact that we used a rather long SMA, there are false signals.
The second variant is to open trades at the intersection of a short and long Moving Averages. In this case, the tendency is identified by a longer average and the moment of entry into a trade is selected with the help of a short one. Example – 5-minute Alibaba Group stock chart. The chart shows two Simple Moving Averages: the red line is MA with the period of 5 and the blue line is MA with the period of 10. See Picture 5.
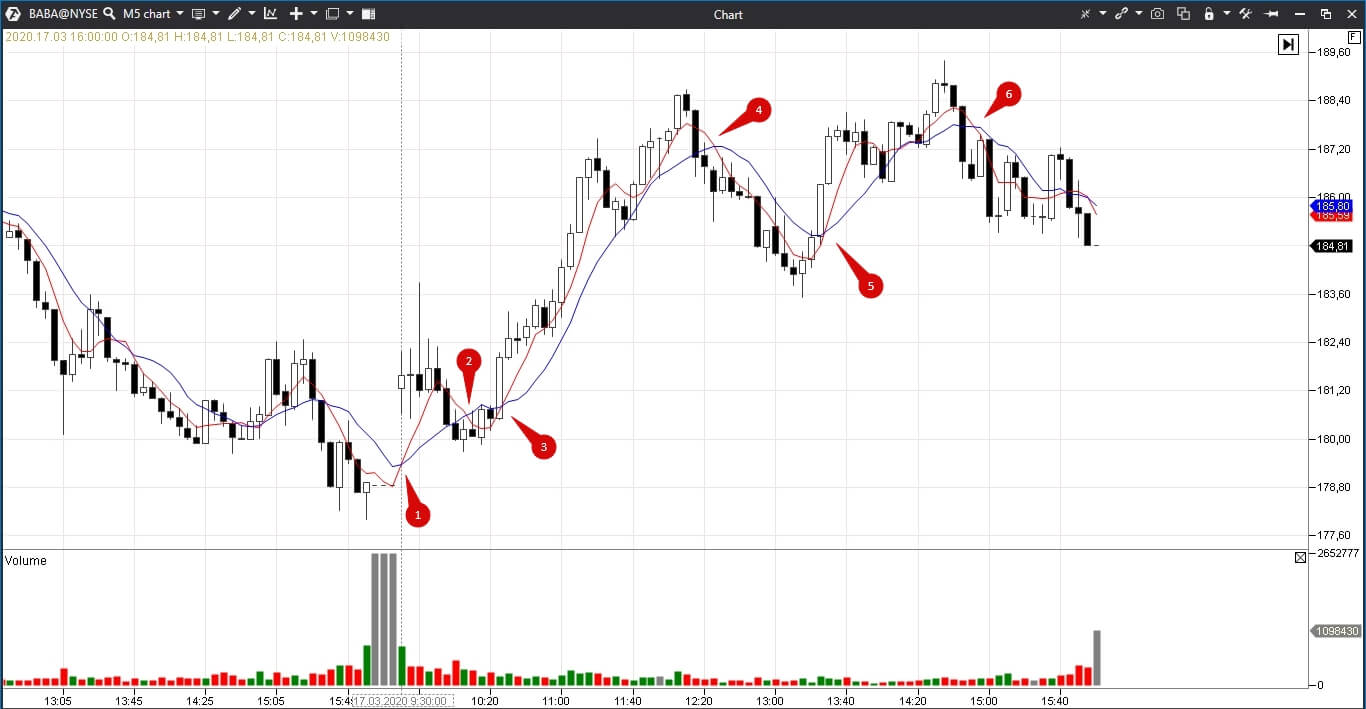
Additional filters could be added to such a trading system – for example, to open trades only if the price closes above or below both averages after their intersection. In this case, positions are not opened between the two indicators.
The third variant is to open trades in case of intersection of more than two indicators. Trader’s fantasy is not restricted here – you can work with an unlimited number of indicators.
Summary
Moving Average is a very well-known indicator. However, if many traders use some instrument, the competitive advantage and potential profit decrease. Moreover, Moving Average is inefficient in the flat.Every trader decides by himself whether to use the MA indicator in his trades and how. We will just show you two screenshots of testing trading strategies by Moving Averages.

- we buy when the price closes above SMA (50);
- we sell when the price closes below SMA (50);
- we apply a non-stop strategy, which means that we are always in a position – either selling or buying.
The picture shows dynamics of the capital when this strategy is applied in the BTC/USD market with the hourly time-frame. As you can see, more than 700 trades were executed and the profit factor was around 1. It means that theoretical probability is close to 50%. In practice, it would have been a loss due to commission fees and slippages.

- we buy when SMA (9) closes above SMA (18);
- we sell when SMA (9) closes below SMA (50);
- we apply a non-stop strategy, which means that we are always in a position – either selling or buying.
The same BTC/USD market with the same time-frame. The result is better since the profit factor increased to 1.2. However, it doesn’t necessarily mean that the benefit from this strategy will not be invalidated by commission fees and slippages in the real market.
Hence, we recommend to approach the use of the Moving Average with due consideration. Supplement your trading system with more modern cluster analysis, tape reading and unique indicators. This would help you to analyze the market situation with a higher quality, reduce the number of false signals and increase the profit expectations. Do not miss the next article on our blog. Subscribe to our YouTube channel, follow us on Facebook, Instagram, Telegram or X, where we publish the latest ATAS news. Share life hacks and seek advice from other traders in the Telegram group @ATAS_Discussions.
Information in this article cannot be perceived as a call for investing or buying/selling of any asset on the exchange. All situations, discussed in the article, are provided with the purpose of getting acquainted with the functionality and advantages of the ATAS platform.

