If you’ve connected to the US futures market, you know how straightforward it is. Gold (GC) data comes from COMEX, S&P 500 (ES) from CME, oil (CL) from NYMEX. One data package from one centralized source. You see everything happening in the market.
The US stock market works differently. It’s not one exchange — it’s a decentralized network. The same security trades on multiple venues. Apple stock (AAPL), for example, trades on Nasdaq, NYSE Arca, Cboe EDGX, BATS, and other alternative exchanges and dark pools.
For traders analyzing volumes, this creates a challenge:
✘ Problem: Liquidity is scattered across venues. To see the complete picture, you need data from all sources. Trades execute on different exchanges, each publishing its own order book and volumes.
✔ Solution: Professional tools consolidate data from multiple exchanges to show a unified market picture.
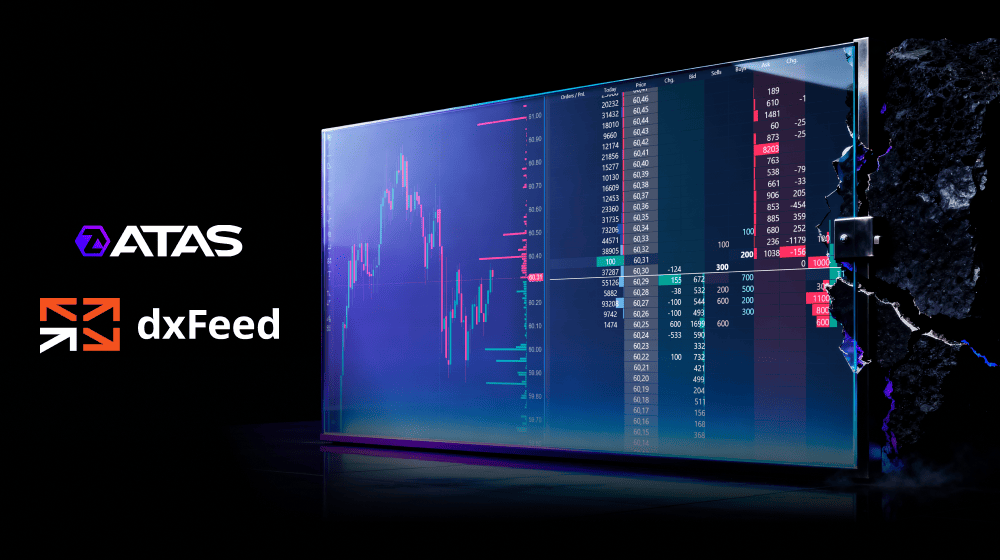
ATAS now provides exactly this solution — a feed for analyzing US stock trading volumes with consolidated order book depth data.
Through the ATAS and dxFeed partnership, you can piece together the puzzle — seeing total volumes and an aggregated order book, just like professional traders.
Below, we’ll explain:
- How consolidated data works in the US stock market.
- How to connect a unique data feed in ATAS and gain an advantage in volume analysis.
Start now!
Try ATAS free with no time limit
The Basics: What Are SIP, CTA, and UTP?
Let’s start with a few key concepts that explain how stock trading works across different exchanges in the US. When a stock is listed on Nasdaq but trades on many other venues, you need a systematic way to organize the data.
Consolidated data feed — information from multiple exchanges combined into a single stream. It provides quotes, trades, and other market data in real time.
SIP (Securities Information Processors) — the official standard for exchanging market data (prices and trades). It was approved by the SEC (Securities and Exchange Commission).
SIP was adopted in 1975 — four years after Nasdaq was created. This happened through amendments to the Securities Exchange Act of 1934. The result was a transparent and efficient market data infrastructure that ensures traders get the best prices for their stock trades (NBBO — National Best Bid and Offer).
The SIP standard includes three plans: UTP and CTA (for stocks) and OPRA (for options). Let’s look at the first two:
- UTP (Unlisted Trading Privileges) — consolidates and distributes market data for stocks listed on Nasdaq.
- CTA (Consolidated Tape Association) — collects, consolidates, and distributes trading information for stocks traded on NYSE, AMEX, and other exchanges.
What Data Is Transmitted Through UTP and CTA
The CTA plan includes two data streams:
✓ CTS — trade data (ticks)
✓ CQS — quote data (current bid and ask prices)
This data is distributed worldwide through Tapes or Networks:
✓ Tape A — stocks listed on NYSE
✓ Tape B — stocks listed on NYSE Arca, Cboe, and other exchanges
The UTP plan uses Tape C to distribute data for Nasdaq-listed stocks:
✓ UTDF — trade data (ticks)
✓ UQDF — quote data (current bid and ask prices)
In practice, traders choose the data feed they need and order it from a provider. Here’s what the selection menu looks like on the dxFeed page:
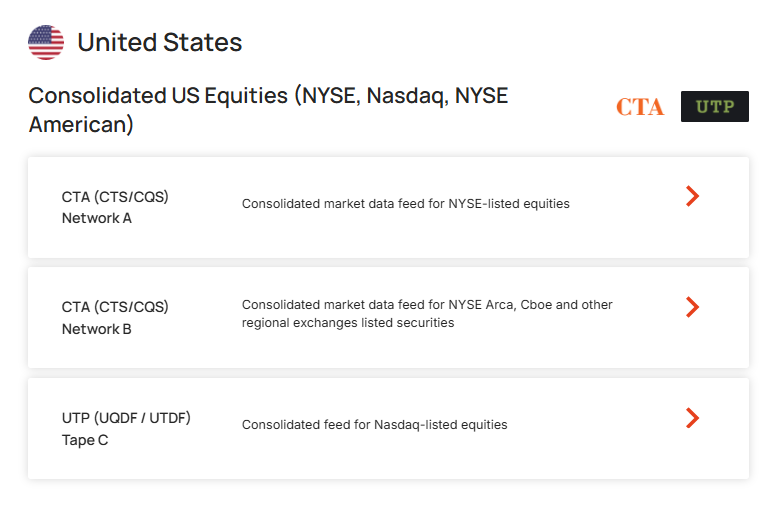
If you specialize in trading technology stocks, order a Tape C data feed and connect it to your analytical platform. You’ll get consolidated data from different exchanges, including trade history for building candlestick and cluster charts in ATAS, plus current Bid and Ask prices.
What About Market Depth (Level II)?
Trade history is straightforward — the government “stitches it together” through SIP. Market depth (order book, limit order book, liquidity) works differently: officially consolidated Level II data is not provided.
Traders typically see the order book from only one exchange, such as:
- Nasdaq TotalView — Nasdaq order book;
- Cboe EDGX Depth — EDGX depth;
- NYSE Arca Book — NYSE Arca depth.
This means traders miss the full picture. Important levels with large orders on other exchanges go unnoticed. Volume analysis becomes incomplete.
But don’t be discouraged.
dxFeed Data Consolidation in ATAS
The ATAS team has gone beyond standard solutions. Users now have access to real-time analysis of consolidated CTA and UTP data, as well as consolidated Level II data analysis — when sufficient data is available through dxFeed feeds.
How It Works
Step 1: Order consolidated price and trade data.
Visit the dxFeed website and select data distributed through Tapes A, B, or C. Stock market professionals rely on CTA and UTP because they deliver:
- accurate data for all US stocks;
- a unified stream instead of dozens of fragmented ones;
- correct tick charts that meet market standards.
Step 2: Order market depth (Level II) data.
On the dxFeed website, select the venues you need:
- Nasdaq TotalView only;
- Nasdaq + Arca NYSE;
- Nasdaq + EDGX;
- or the complete package.
Step 3: Connect ATAS to the dxFeed data provider.
Follow the connection instructions here.
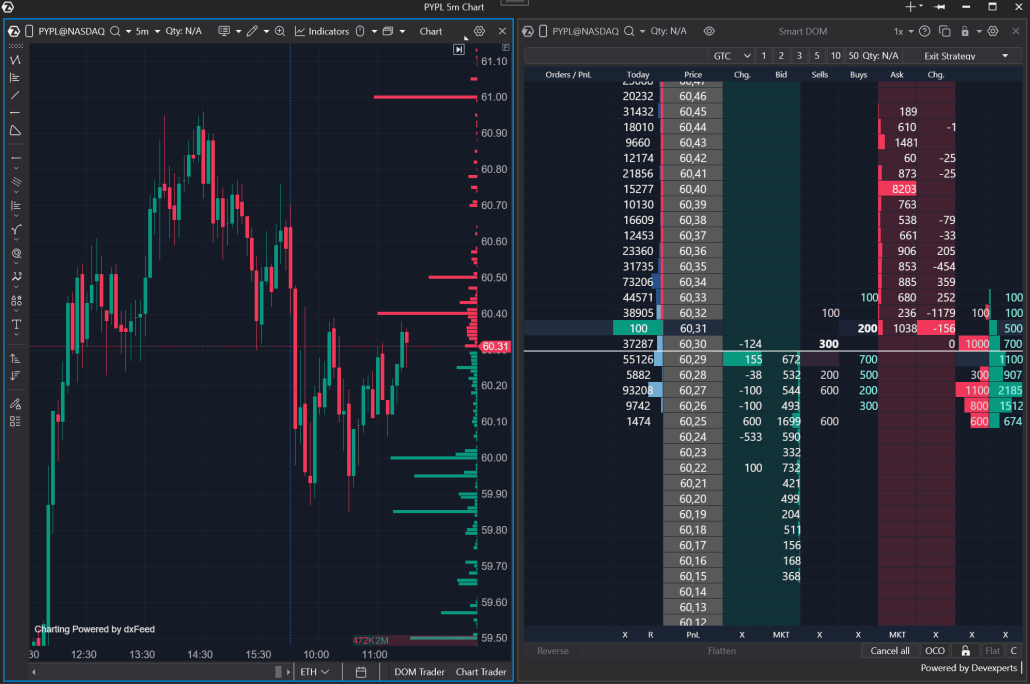
ATAS automatically collects this data and displays it in the DOM and footprint.
Important! Market depth data consolidation is a unique ATAS feature unavailable in other analytical platforms. It gives you significant advantages over other traders:
- Unified market picture. All US stock trades collected in one place.
- Flexible depth selection. Order data only from the venues where you analyze liquidity.
- Instant setup. ATAS automatically connects and processes your selected feeds.
FAQ
Why do ATAS candles differ from those on free websites like TradingView?
Free sources often use data from only one exchange (for example, Cboe BZX) because it’s cheaper. They show only part of the volume. ATAS, through dxFeed (CTA/UTP), displays the maximum number of trades in the market. If you’re analyzing volumes, complete data is essential.
Does this affect indicators like Big Trades and Cluster Search?
Yes. ATAS indicators use data from the entire market, not just one venue. This increases signal accuracy.
Which dxFeed plan should I choose?
On the dxFeed website, you can create ready-made packages. For example:
Basic package (optimal for chart and indicator analysis):
- CTA + UTP (quotes and trades);
- without market depth.
Extended package:
- CTA + UTP;
- plus a set of Level 2 feeds (TotalView, NYSE Arca, EDGX, combinations). The more venues in the package, the fuller the DOM order book in ATAS.
Conclusions
The US stock market has a unique decentralized structure.
For traders using volume analysis, this creates a serious problem — the “incomplete data trap.” Your datafeed is connected, but the picture is distorted. The order book appears insufficiently liquid, candles don’t match other sources. Where’s the truth?
The ATAS and dxFeed integration provides a reliable solution:
1. Unified trade tape (via CTA/UTP) ensures benchmark accuracy for chart analysis.
2. Order book aggregation (a unique ATAS feature) lets you analyze full liquidity that other traders see only in fragments.
Set up a professional datafeed and analyze the market to gain a clear advantage over most traders worldwide.
Information in this article cannot be perceived as a call for investing or buying/selling of any asset on the exchange. All situations, discussed in the article, are provided with the purpose of getting acquainted with the functionality and advantages of the ATAS platform.
Subscribe
Get the latest ATAS news delivered conveniently