ATAS turns 14! This milestone is not only a chance to reflect on our journey, but also to thank everyone who has ever explored footprint charts or DOM in our analytical platform.

We wouldn’t have reached this milestone without our users. Everyone who has analyzed markets with ATAS over these years has contributed to the project’s development. Our goal has always been to make market data transparent and your decisions confident. This anniversary is an opportunity to thank our community: traders, partners, our friends from the industry — everyone who has supported us. Together, we’re creating something more than software — we’ve built a global community of professionals who see the market more deeply.
– Denis Ivashchenko, board member of ATAS LLC.

It may sound formal, but behind these words lies the real experience of all our users: their first discoveries in volume analysis, first market insights, first trades (and the inevitable mistakes along the way). All of this forms part of ATAS’s shared history.
How It All Began
We are proud to have created a reliable market analysis tool that benefits thousands of traders worldwide. ATAS’s history is filled with numerous small (and not-so-small) steps, sleepless nights, continuous improvements, and invaluable user feedback. Swipe through the carousel to see how our analytical platform has evolved from inception to the latest updates.
2009 — Creation of the First Algorithm
It all started with an idea that came to us while trading on the Chicago Exchange: “What if we could track major players directly in the time and sales tape?”
2010 — The Print Tape Got Smarter
The Print Tape Got Smarter
2011 — One Tape Wasn’t Enough..
We added charts, DOM, indicators, support for new exchanges, and the ability to independently manage orders directly from the interface.
2012 — ATAS Became a Commercial Product
Thanks to the support of early users, we were able to develop our software. This led to the creation of Range bars, Cluster Search, DOM Power, Dynamic Levels, RTIndicator, graphical objects, and other features that many still love today.
2013 — More Connectors and Indicators
We didn’t rest on our laurels: we added ZenFire and IQFeed connectors, as well as Market Profiles, VWAP, and Spread Volume indicators.
2014 — ATAS Became Available to Users Worldwide
Connections to Interactive Brokers and Quik appeared, along with the ability to work simultaneously with multiple exchange accounts and test strategies on ATAS SIM.
2015 — Improved Risk Management
Finding an entry point is only half the battle; it’s equally important to exit a trade on time. Customizable protective strategies made exits safer. We also added 7 connectors, composite portfolios, and a statistics module.
2016 — More Personalization and Capabilities
Each user got a Personal Area. The Exante connector and Dom Levels indicator became available. An important step for community development was the referral program — with it, you can earn income beyond exchange trading.
2017–2019 Crypto Market Pioneers
At the dawn of the crypto era, we opened access to analysis of the first crypto exchanges and coins. The ATAS interface became more modern and user-friendly.
2020 — Major Functionality Expansion
We added connectors to MT5 and 500 liquid CBOE EU stocks. Traders gained access to Scalping DOM, Watchlist, and automated strategies. We also introduced almost two dozen new indicators.
2021 — Enhanced Analysis Tools
We expanded cryptocurrency analysis to ByBit and added 60 new indicators to strengthen your trading hypothesis confirmations.
2022 — Advanced Trading Capabilities
We connected to Bitget, adapted Chart Trade for cryptocurrencies, and added 50 new indicators. Our “time machine” Market Replay feature launched, allowing users to practice volume analysis on historical data without real-market stress.
2023 — Visualization and Account Management
OKX and Whitebit joined our crypto exchange lineup. The new Heatmap feature made liquidity visualization more intuitive, while Following Manager enabled simultaneous order management across multiple linked accounts. We also made graphical objects global, allowing you to manage them across all charts of a single instrument.
2024 — DOM Innovations
We enhanced Smart DOM and the protective strategies block, introduced MBO DOM with 6 new indicators, implemented automatic cancellation of pending orders, added customizable ATAS SIM balance settings, and launched the new Economic Calendar module.
What’s happening now?
2025 is in full swing, and there are still many surprises ahead. Nevertheless, we’ve already accomplished impressive work:
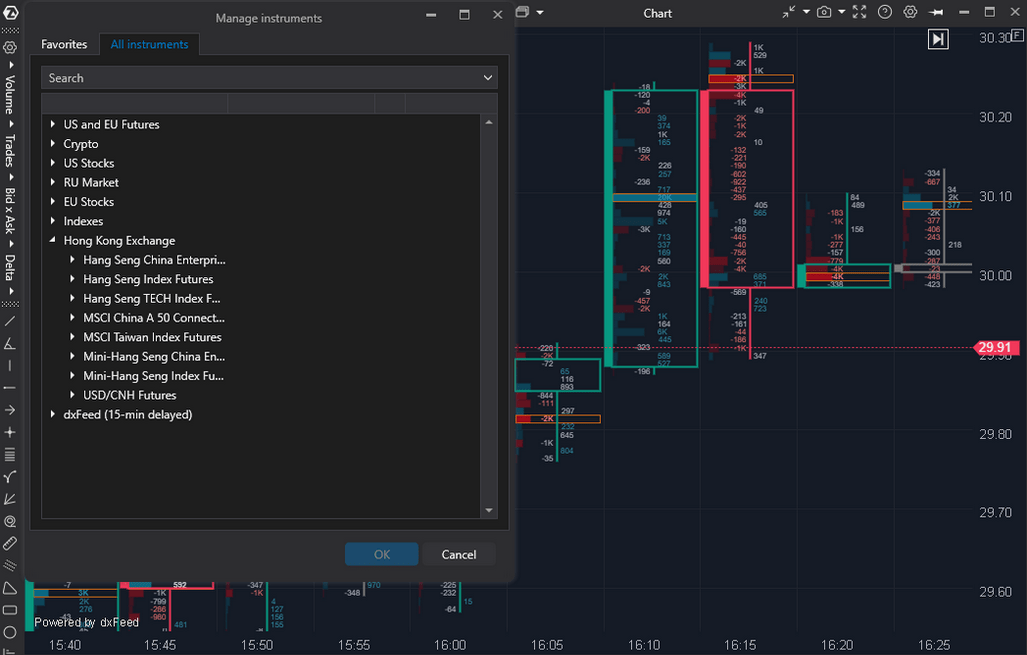
✔ Instruments from Hong Kong Exchange (HKEX) and the Kraken crypto exchange are now available. Cryptocurrency analysis has become more convenient with the display of USDT volumes in the footprint.
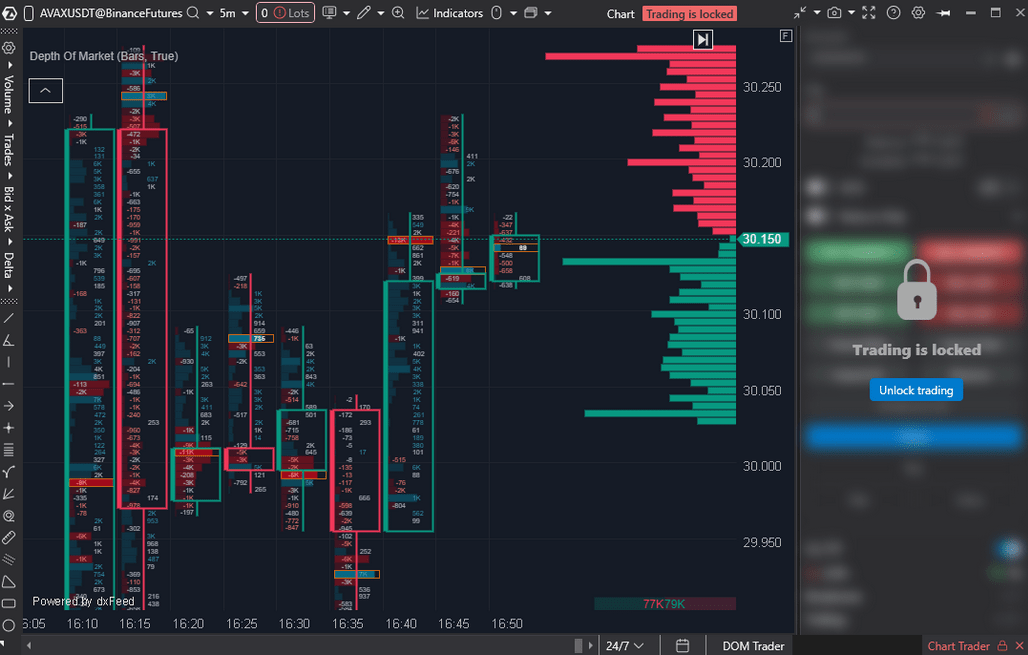
✔ Chart Trader now features privacy and trading lock modes, while Volume Selector lets you set volume in coin, USDT, or % of account.
✔ Smart DOM has become more flexible: you can analyze footprint, MBO DOM, and dynamic column. The interface is more user-friendly with quick column dragging and improved data readability thanks to the new design.
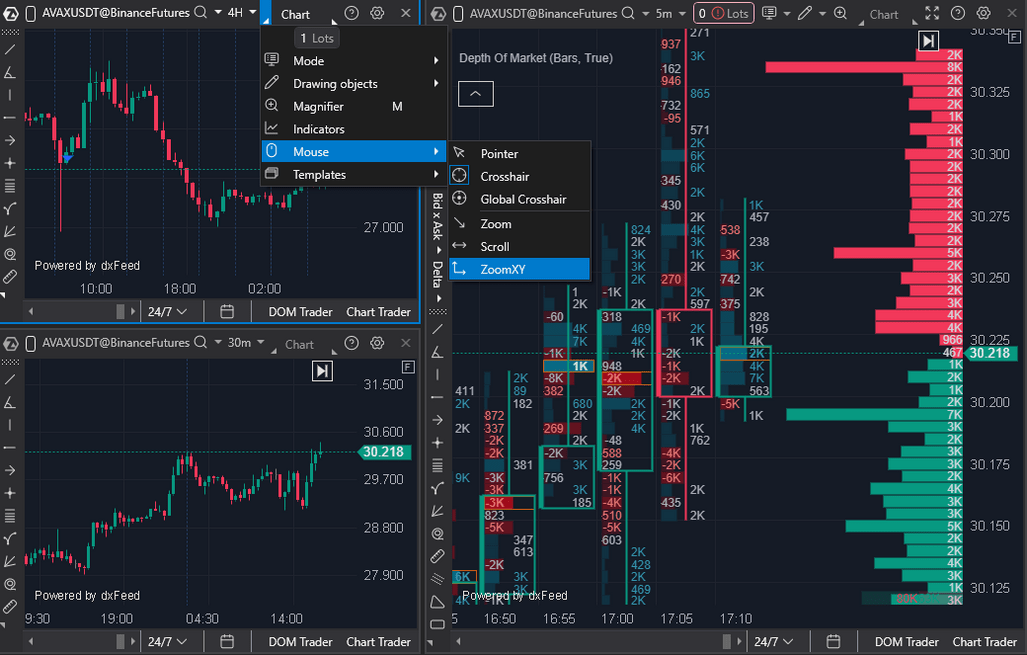
✔ Chart scaling is more convenient with the new ZoomXY scroll mode. Charts now render without gaps even during poor internet connection.
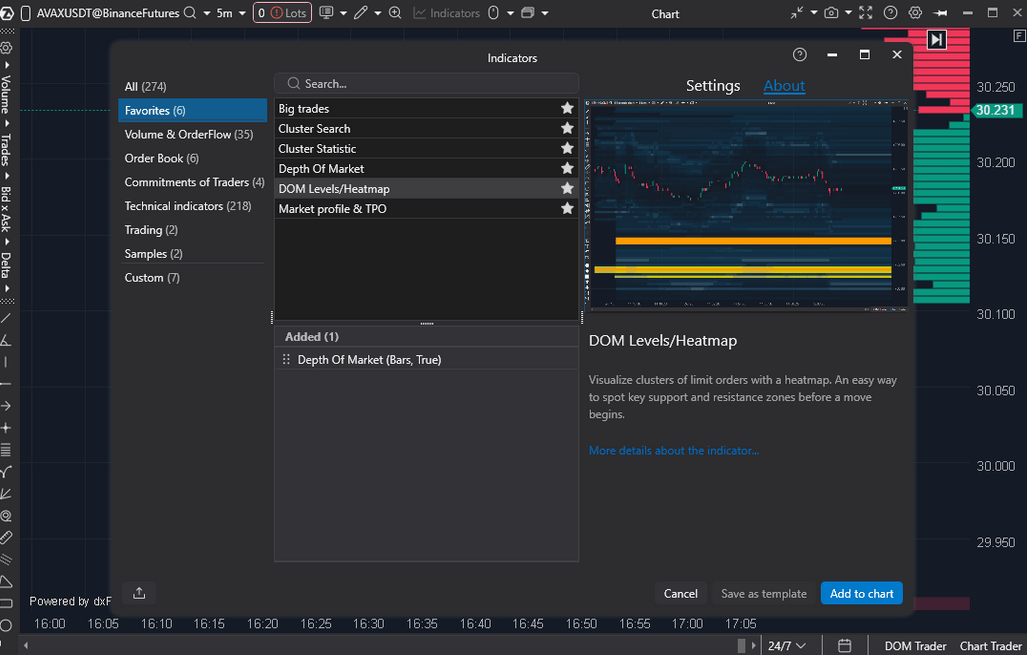
✔ Working with indicators is simpler with the updated manager, now divided into three windows: categories, list and search, settings and help.
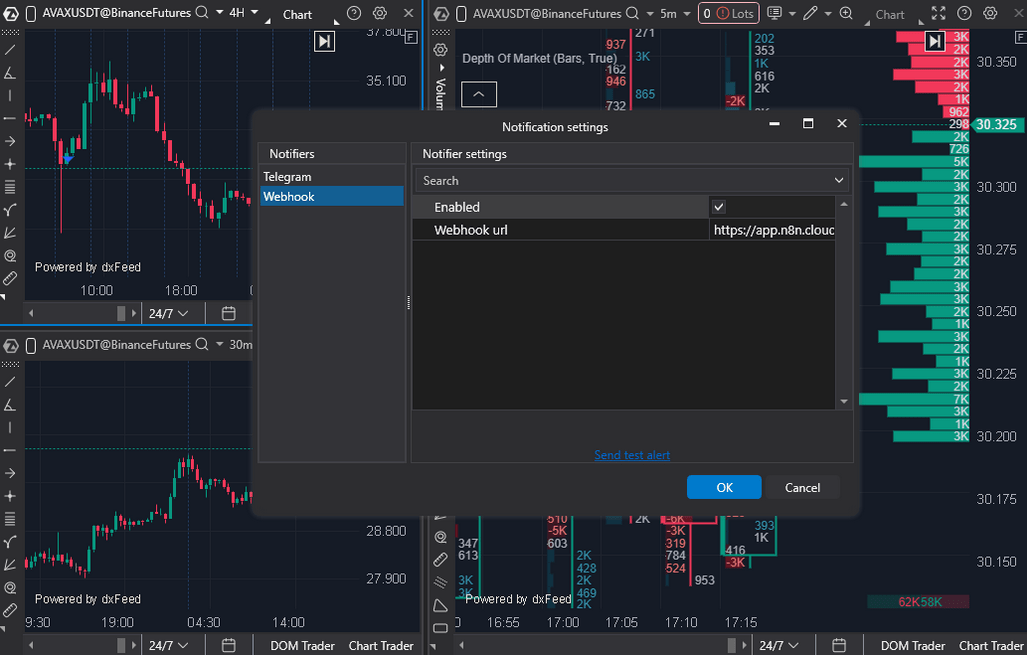
✔ We’ve added a quick alerts button and webhook support through n8n — so you’re always aware of what’s happening.
Most importantly — we listen to your ideas and suggestions. This year alone, we’ve made 3,145 code changes. Each change represents progress, whether it’s a small optimization or a major functionality expansion. We’ve released 212 updates: 167 Alpha versions, 29 Beta versions, and 16 Latest versions. Yes, we’re amazed by these numbers too!
Long-awaited for Mac owners
The answer to that question you’ve been asking for years: “When will there be a macOS version?” First users are already testing the alpha version of the new software, and you can join them — just submit your application via the link.
Soon ATAS will be available for all Mac owners!
This is perhaps the most anticipated feature in our entire history. And yes, we’ve heard all the jokes about ATAS being the last reason to stay on Windows.

We make ATAS for you
ATAS isn’t about abstract numbers and modules; it’s about real people with their own habits, strategies, and psychology. We already have more than 360,000 users from 159 countries, and each sees the market in their own unique way.
Some open ATAS for just a couple of minutes — to drink coffee while reading charts instead of the morning newspaper. Others keep windows open 24/7, watching the price like a cat: seemingly asleep, but ready to pounce at any second.
Favorite exchanges and instruments
Everyone has their own path in ATAS. Many start with cryptocurrencies and dive into Binance Futures. Others immediately gravitate toward classics—opening COMEX charts and analyzing metals and energy resources.
If we map all these routes together, the TOP-5 instruments look like this: NQ, BTCUSDT, ES, GC, and FDAX. Recognize your favorite? 😉
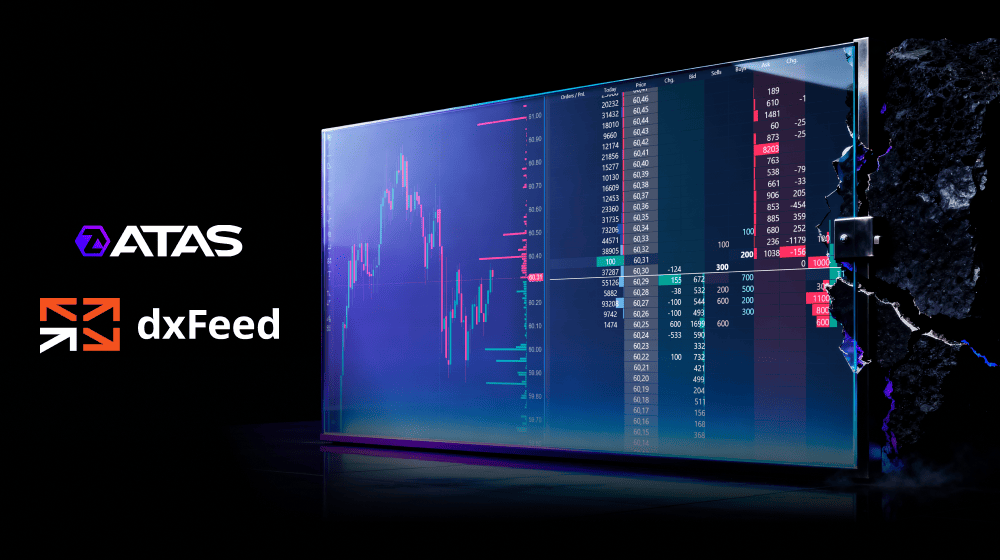
To ensure these market “journeys” proceed without unwelcome surprises, users choose reliable data sources — most often dxFeed and CQG.
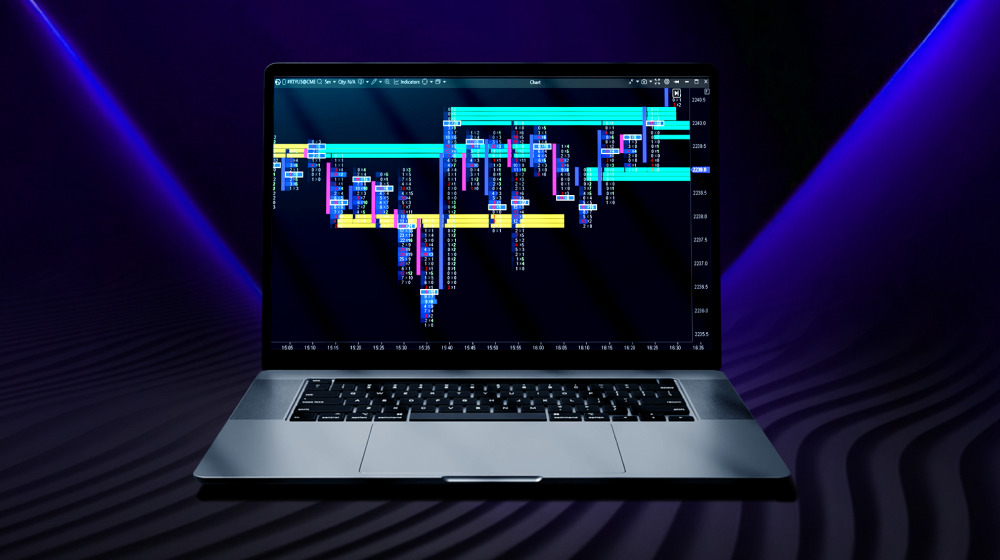
Charts — The Main Analysis Tool
Charts are the most popular ATAS module. Not surprising, since you can customize them like LEGO.
The foundation of this constructor is frames. You can choose a reference point for each candle: volume (Volume), ticks (Tick, Renko), price range (Range X, XV, Z, US), deviation (Reversal), or the difference between buys and sells (Delta). Plus familiar timeframes from seconds to weeks or any custom value.
Can you guess which timeframe is most popular in ATAS? You’ll find the answer just below.
ATAS’s signature feature is footprint charts
With over 400 ways to display clusters, you can see what’s happening inside each candle using Volume, Trades, Bid x Ask, and Delta data. You can customize candle outlines, colors, transparency, and indicator display — everything adapts to your unique analysis style!
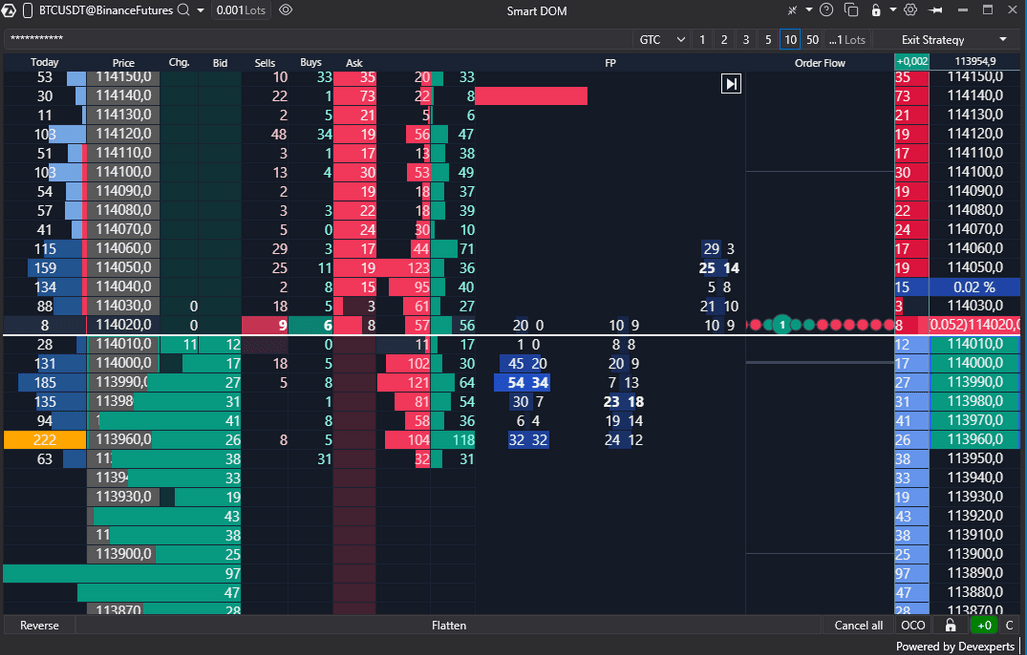
Smart DOM — ATAS’s Second Heart
This is the second most popular module. If charts are an IMAX theater, Smart DOM is a microscope. It displays liquidity and real volumes at each level, highlights support and resistance, and helps you spot manipulations by major players.
With recent updates (from Beta 7.0.10), Smart DOM has evolved into an even more powerful scalping tool that works independently from charts. We’ve added:
- DOM Trader panel for convenient independent order management;
- the ability to analyze footprint charts and cumulative footprint for a period directly in the order book;
- new DOM Changes modes;
- improved Order Flow version with trade flow displayed as dynamic circles or squares;
- more usability when working with columns.
ATAS Trader’s Workspace
On average, ATAS users analyze 3 assets across 9 windows: typically 7 charts supplemented with Smart DOM, Smart Tape, or All Prices. This setup creates a cozy control center with everything at your fingertips.
Then there are those who build true analytical metropolises: 335 assets, 726 charts, 218 Smart Tape windows — an approach that seemingly requires a wall-sized monitor! These examples show how ATAS adapts to anyone — from minimalists to those who want to see the market in all its complexity.
As for indicators, while every trader has their favorites, certain tools consistently make the TOP:
- Depth of Market — a concise histogram displaying current supply and demand levels and their real-time volumes.
- Delta — shows the difference between market buys and sells for each candle.
- Cluster Statistics — provides comprehensive information about each candle’s structure: Bid/Ask volumes, delta interpretations, trade counts, session differences, start times, duration, height in currency, and more.
- Bar Timer — a small but useful counter showing the remaining time until candle closure.
- VWAP/TWAP — volume-weighted average price that shows how current price relates to daily, weekly, monthly or yearly price trends. It displays the same line regardless of timeframe: whether you’re viewing a minute chart, hourly, Range Bar, or Renko — VWAP remains consistent!
Recognize your set?
Now for the answer to our timeframe riddle. Most users choose 5 minutes. Why? This interval captures all important market impulses while keeping the chart readable and free from unnecessary price noise. This perfect balance of speed and clarity appeals to most traders.
Marketplace
The Marketplace is another vital hub in the ATAS ecosystem. It offers courses, webinars, and masterclasses from trading professionals, books on volume analysis, ready-made templates, custom indicators, and options to order custom development from partners. Everything you need to study the market, try new approaches, and trade with greater confidence.
Stronger Together
ATAS is more than just charts and trades. Over 14 years, an international community has flourished around volume analysis: traders from dozens of countries share lifehacks, discuss charts, and often communicate more closely with each other than with their neighbors next door.
- We have Discord and a Telegram chat where you can always ask questions and receive honest answers.
- Regular webinars and online marathons with experts help you enhance your skills — from basic volume analysis fundamentals to advanced techniques that provide deeper market insights.
- There are also challenges with valuable prizes where you can refine your strategy before taking real prop firm evaluations.
Each new format evolves with your input: we listen to the community and implement ideas that truly resonate with users.
Celebrate with us, share your experience, and inspire others — and we’ll continue doing everything to ensure ATAS remains your favorite market analysis tool.
ATAS is created for you and together with you!
Information in this article cannot be perceived as a call for investing or buying/selling of any asset on the exchange. All situations, discussed in the article, are provided with the purpose of getting acquainted with the functionality and advantages of the ATAS platform.