May 26, 2022

How volume analysis indicators help to find the end of a correction

Contents

    Share

    How to identify the end of a correction using the volume analysis indicators
    The end of a correction is very important because at this moment traders have an opportunity to enter a position with a potentially high reward (in case of a trend resumption) and reduce risks at the same time. Read in this article:

    What is a correction

    This term appeared in the stock markets of the 20th century, it was used to describe a short-term decline in the price of an overheated stock. Over time, the term spread to other markets. It is also used by technical analysts for intermediate upward corrections during an active downtrend. Correction is a rather eloquent term, if you think about it. The market itself seems to recognize that a news release caused a stir and prices rose to extreme values, and therefore they need to get back to normal. In other words, adjust.
    A schematic diagram of a correction
    The schematic diagram above shows a correction:
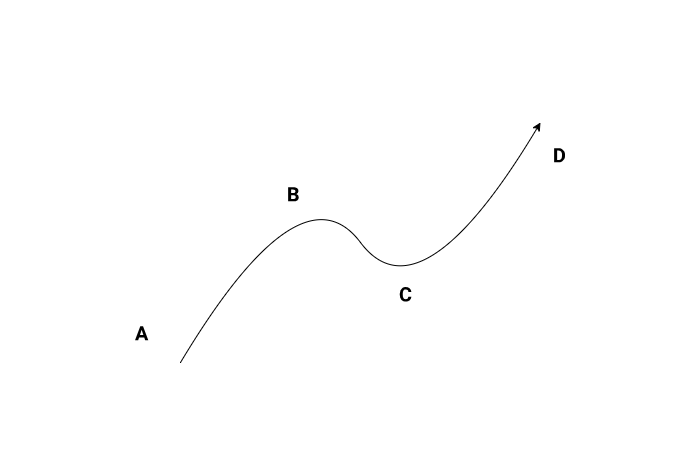
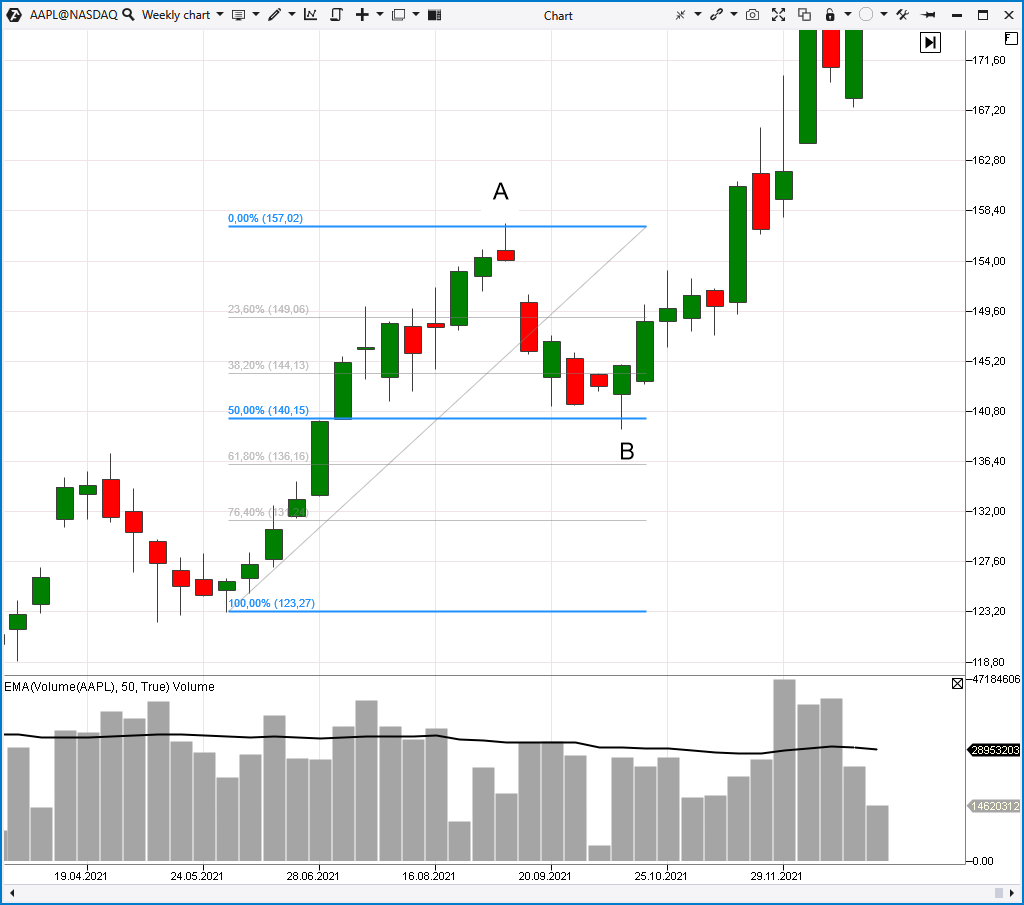
    • А→В: an impulse movement that initiates a trend;
    • В→С: a correction;
    • С→D: a trend resumption.

    When to enter a position

    The diagram below shows completely different types of entering a long position considering the end of a correction and the resumption of an uptrend.
    The A → B movement is a correction within the uptrend of the price of a hot stock. The volume indicator shows that volumes were slightly above average on the rise to top A. And they were slightly below average during the correction to top B. The Fibonacci levels show that the correction low occurred almost exactly on the 50% line. The peculiar thing about Fibonacci is that a correction hardly ever ends precisely at the 50% level. If the initial impulse was strong, then the correction tends to be insignificant – much less than 50%. Therefore, if the impulse was weak, then the correction can be deep. To get more information about traditional tools for identifying the end of a correction, follow these links to relevant articles: 

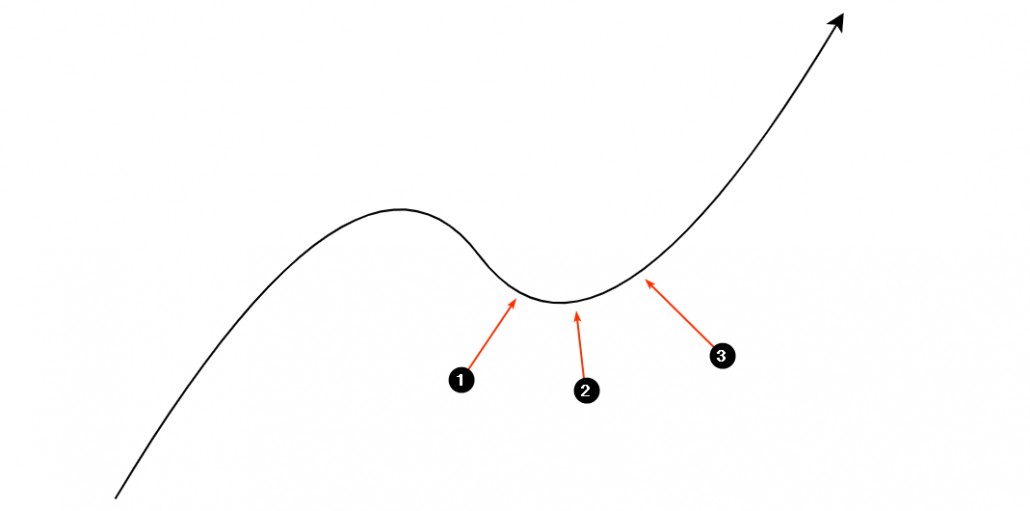
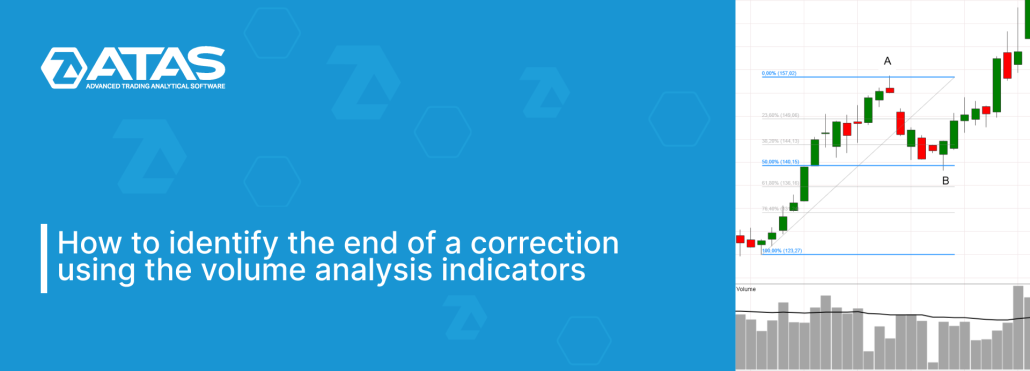
    Modern ways of identifying the end of a correction

    To identify/confirm the end of a correction more accurately, use professional volume analysis indicators provided by the ATAS trading and analytical platform (download the platform for free). In the following part of the article, we will show some examples to give an understanding of how to use these indicators. Settings may be different depending on the market/timeframe.

    Example 1. DAX Index futures

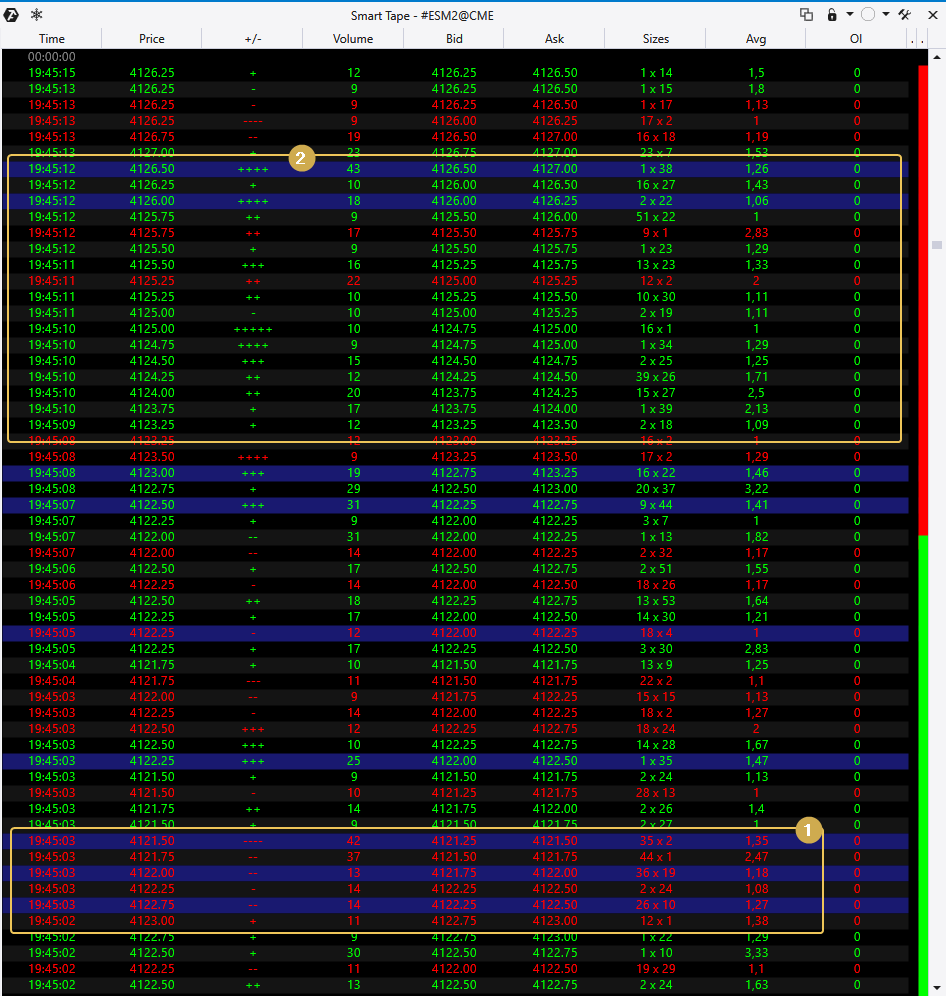
    The Big Trades indicator has been added to the 30-minute chart that displays high volume trades.
    DAX Index futures
    Number 1 indicates big sales that took place just below the 13,500 level. However, the price refused to decline any further even though large sell orders had been executed. It was likely to happen because large market sells were actually stop-losses set above the 13,500 level. They are not capable of moving the price lower. We believe that they are used by professionals to accumulate a large long position at the lowest prices.  The zone marked with number 1 served as a basis for the impulse price growth (2). Note that the growth towards point A was accompanied by volume spikes. This is natural since the price was overcoming local resistance levels. А→В decrease is a correction itself. Small volumes can be explained by the fact that the correction took place during an additional trading session. But even so, the activity was still low. The Fibonacci levels worked out close to the gold standard in this example, the correction low is just below the 50% level. Let’s switch to a faster time frame to see the end of the correction better.
    DAX Index futures
    Numbers indicate:
    The delta indicator shows that market buys significantly exceeded market sells during the intraday impulsive upward movement. However, they gradually weakened (1). Then the market sellers showed up (2) and the price entered the stage of a short-term correction. According to the Delta indicator, it can be seen that the pressure of the sellers gradually decreased (3). Let’s consider in detail how the upward reversal occurred at the correction low. The Smart Tape module in the Historical mode will be used for that. Here is what was happening on the Tape ↓ at the moment circled in red in the chart above. We have filtered out all trades with less than 9 contracts from the feed.
    The Tape
    We can assume that during the first seconds after 19:45 there was a local selling climax (1). Buyers appeared 5-10 seconds later (2) and the price reacted with an increase, which can be seen by looking at the pluses.

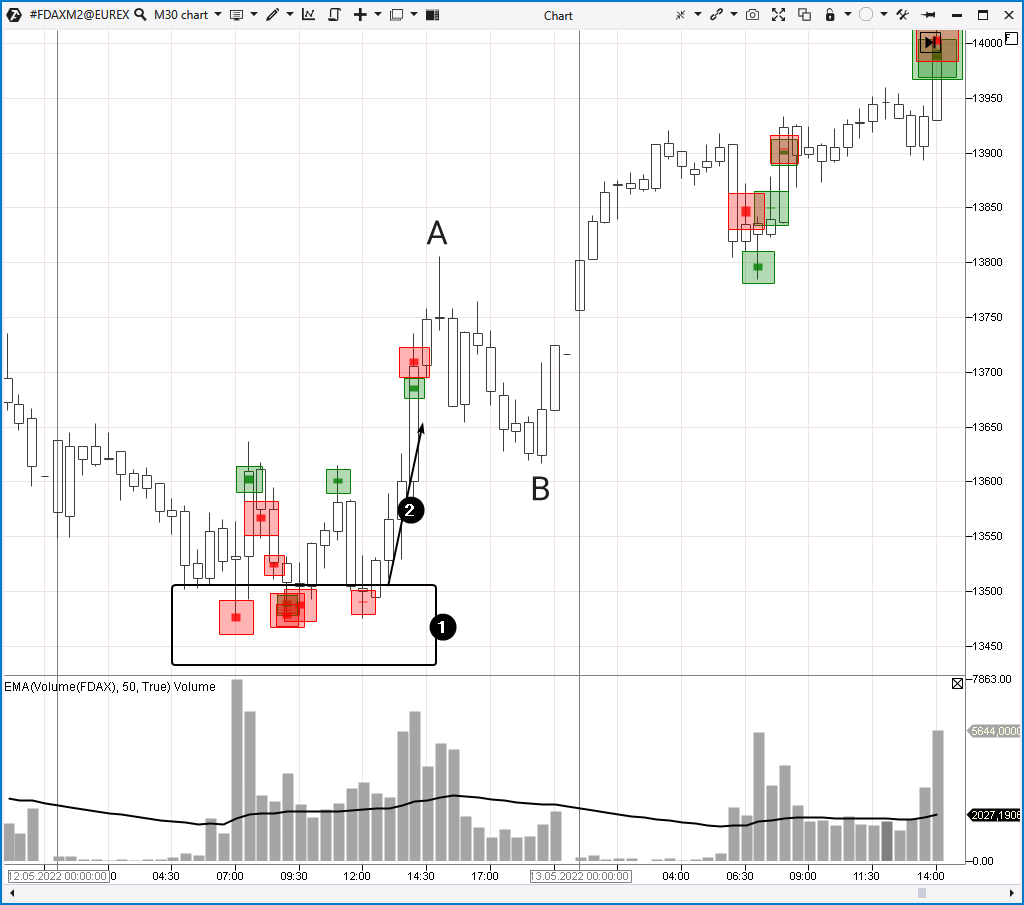
    Example 3. Bitcoin futures on a cryptocurrency exchange

    The last example is on the Range XV chart. This is a non-standard type of chart that can be used as a signal to enter a position considering that the correction is over.
    Bitcoin futures on a cryptocurrency exchange
    The chart above shows that after a period of consolidation, noticeable by the bulge on the market profile (1), the price of bitcoin rose to 39,450. It can be interpreted as an impulsive movement that caused the market to fall out of balance. Now you can build the 50% Fibo level to wait for an entry signal which comes from a reversal candle on the Range XV (2) chart. It is possible to open a long position both with a market order after the signal candle closes and with a limit order placed in the middle of the signal candle’s body. You can also customize the Range XV to show more detail whose analysis will allow you to get additional confirmations and find a more accurate entry point.
    Bitcoin futures on a cryptocurrency exchange
    Numbers indicate:
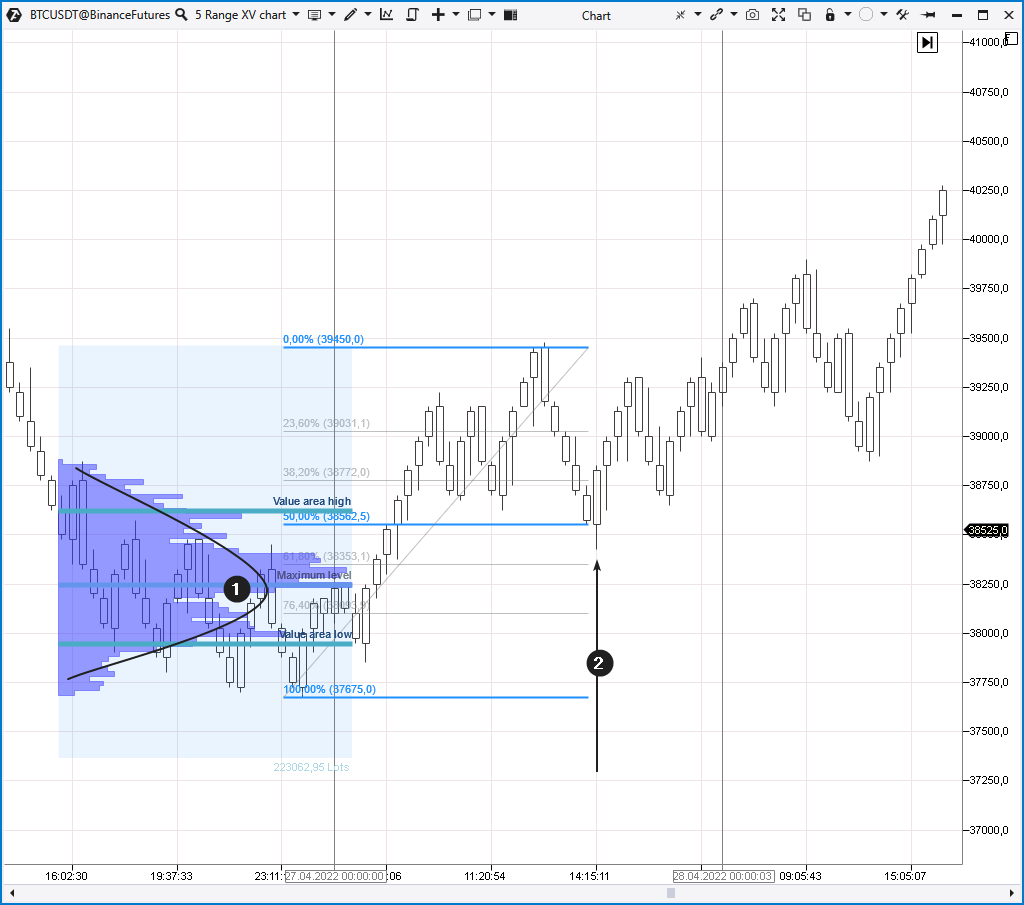
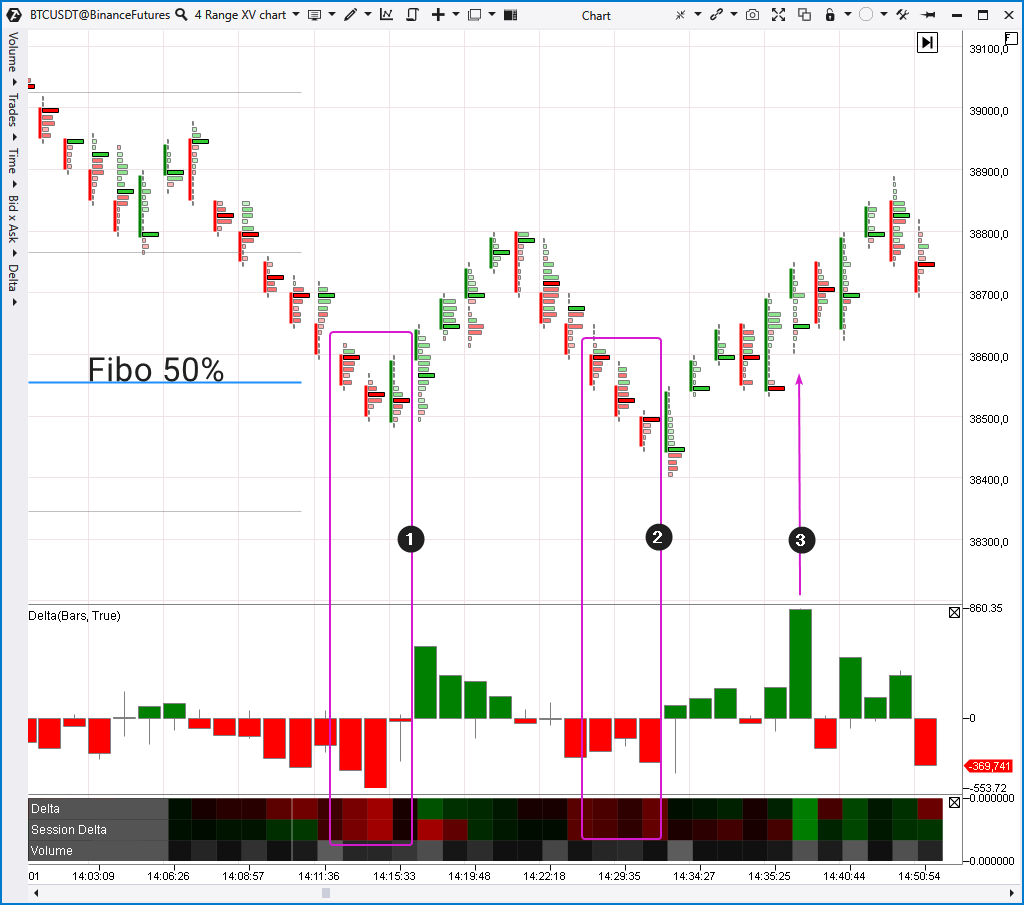
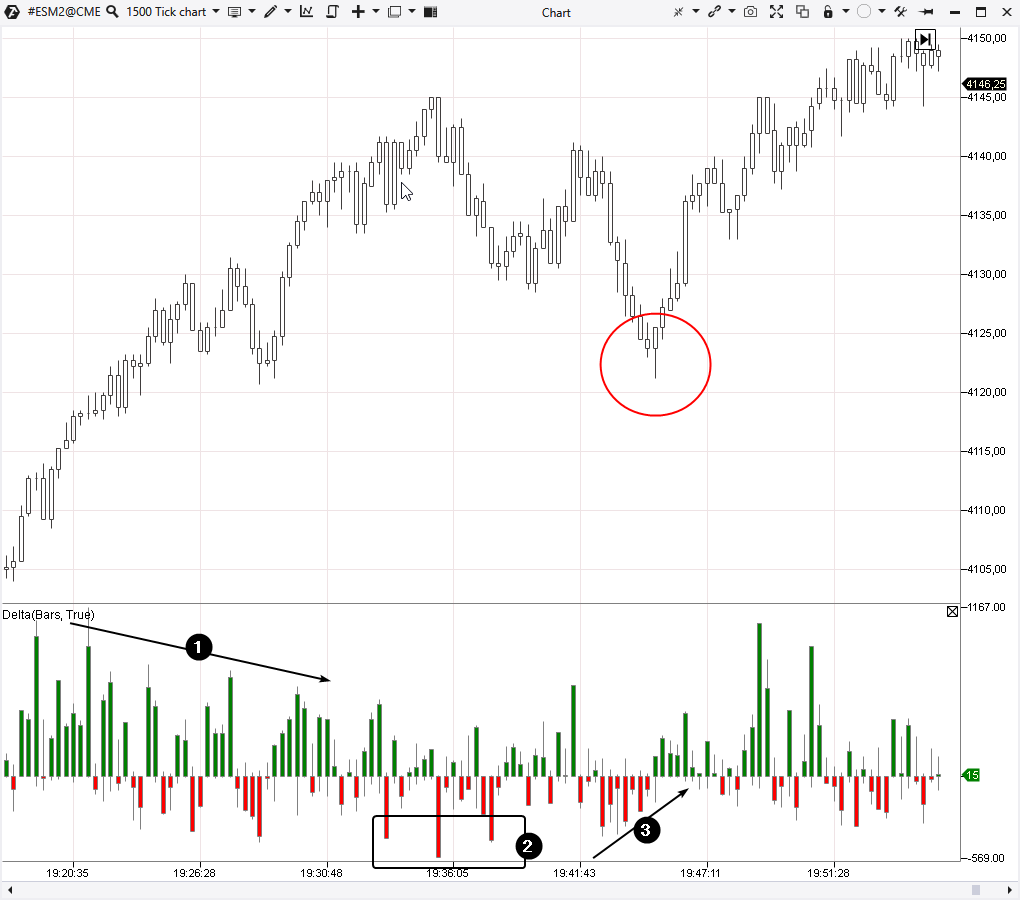
    1. A selling climax of a local scale. The Delta indicator shows large spikes in market selling volumes followed by a price rise (a sign of a reversal).
    2. The selling pressure is decreasing, it is easy to notice because the red bars on the Delta indicator have become smaller.
    You can enter a long position when a bullish candle appears after a descending wave (2) or when a large buying volume appears (3). In this way, your actions will be coordinated with the buys of large traders.

    When to exit a position

    Although the article is devoted to finding the end of a correction, which is directly related to opening a position, it is impossible not to mention when to close the position. In fact, this is a question that does not have the only correct answer. There are some recommendations:
    • use a trailing stop technique. It can be easily implemented with the help of protective strategies in the ATAS platform;
    • close the position completely or partially when important support and resistance levels are reached;
    • use a mathematical take profit. For example, if your stop = 100, then your take = 250.

    How to start trading

    We hope that the information presented in the article was useful for you. As we have already mentioned in the article about Trend Trading Strategy, it is important for traders to trade in the direction of a trend. But since the price does not change in a straight line (otherwise it would be too easy to make money), entering a position with the trend often comes down to identifying the signals that indicate the end of a correction. The methods, which were briefly described above, are designed to help you identify the end of a correction more accurately and enter the position with greater confidence. Try out volume analysis tools to see how useful they are for identifying the end of a correction on your charts. Find out what setup is the best for you. Download the free version of ATAS right now! Try a powerful cluster chart analysis tool for stock, futures and crypto markets.

    Conclusions

    Trend trading increases the chances of success in the long run. If you want to join the current market trend, look for signs that indicate the end of a correction. It can be a daunting task, but professional volume indicators make it easier. Download ATAS. There are four good reasons for that:
    1. It’s free and you can continue using the program even after the 14-day trial period.
    2. You will be able to analyze the end of a correction in the stock, futures and crypto markets.
    3. There is a demo account built into the ATAS platform, so you can practice trading without risking your real capital.
    4. The platform offers many benefits for traders who want to trade with easy-to-use cluster charts and useful indicators.
     Read our blog and subscribe to our YouTube channel.

    Information in this article cannot be perceived as a call for investing or buying/selling of any asset on the exchange. All situations, discussed in the article, are provided with the purpose of getting acquainted with the functionality and advantages of the ATAS platform.

    Examine the causes of price fluctuations in the market

    Start using ATAS right now and capitalize.

    Get started for free

    This site is registered on wpml.org as a development site. Switch to a production site key to remove this banner.