Professional traders often use this module in their work. Some of them work with the tape only and do not use charts.
Unprofessional traders do not know about, forget or just do not use the tape. Maybe they consider it too complex because it moves very quickly, especially in active markets? On the other hand, it is also difficult to work with the tape due to low liquidity.
Beginner traders often perceive the tape as a set of multi-coloured numbers, which change all the time. It causes a headache and they refuse to use this instrument, which is wrong.
You will learn from this article what the Time & Sales is and why you shouldn’t ignore it.
Essence of the information in Time & Sales
Trades are executed on the exchange when a market order meets a limit order. As a rule, everybody understands that any trade requires a buyer and seller. However, it is a bit more complex on the exchange – both should enter with different orders.For example, John wants to buy Tesla stock at USD 200 and posts a limit buy order and Michael wants to sell Tesla stock at USD 800 and posts limit sell order. In this case, a trade will not be executed since the interests of John and Michael do not cross and none of them is ready to give way.
However, if there is an aggressive participant, for whom it is important to enter the trade quickly at any current price, then he posts a market order. A trade is executed when a limit and market orders ‘meet each other’. It will be reflected in Time & Sales.
Note that market orders are executed immediately, while execution of a limit order may take time until a counteragent, who agrees with the offered price, appears.
Useful information:
How to open the Smart Tape module
There are several methods to do it in ATAS:
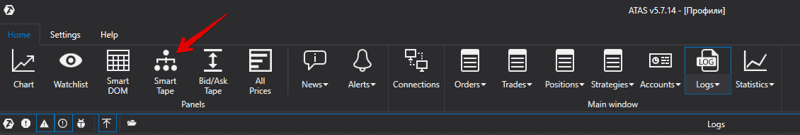
Method 1. Press the Smart Tape button in the main window upper panel and select an instrument, after which the tape will be opened. See Picture 1.
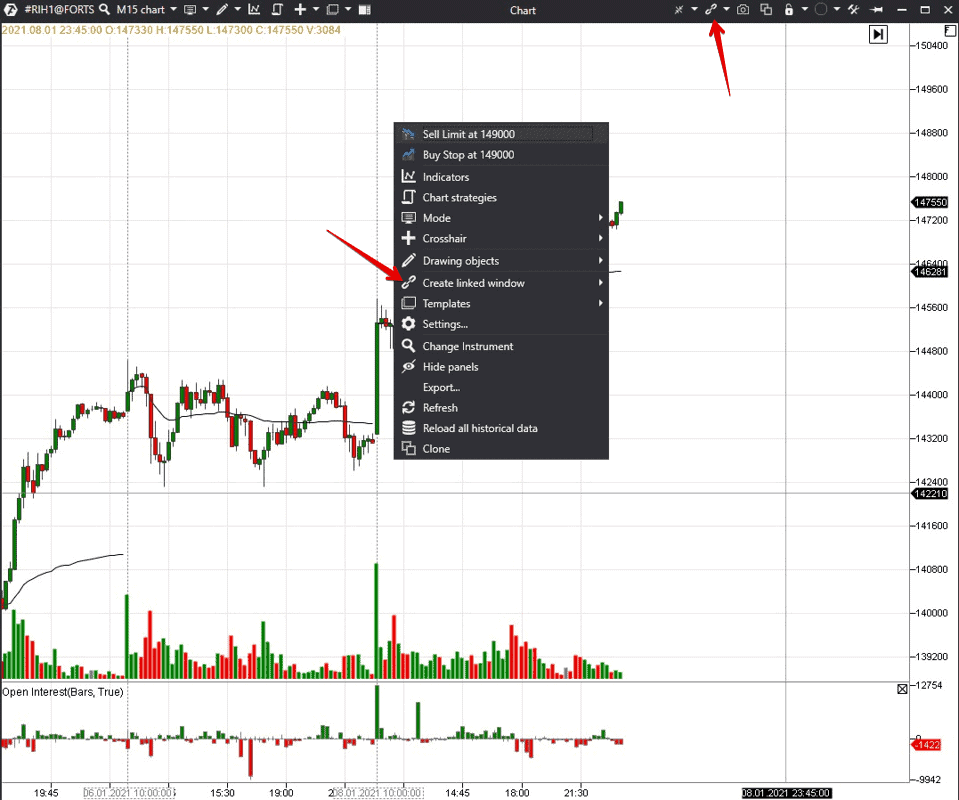
Method 3. Press ‘Create linked window’ in the upper menu of the chart. The tape of the instrument, which is loaded to the chart, will also be opened here. See Picture 2.
You can group separate trades in the ATAS Smart Tape in order to see real sizes of executed market orders. Then, a trader will see one trade on the tape, which consists of 50 contracts. You can also filter out trades in the Smart Tape and set up display of, say, big trades only. The tape speed slows down when only trades with a certain volume are shown on it and it is easier for a trader to perceive information.
You can find a detailed description of all tape settings in the Knowledge Base and you can also watch an educational video on our YouTube channel. We will not consider the purpose of all columns in detail in this article. We will just mention the main ones.
How to understand the Smart Tape
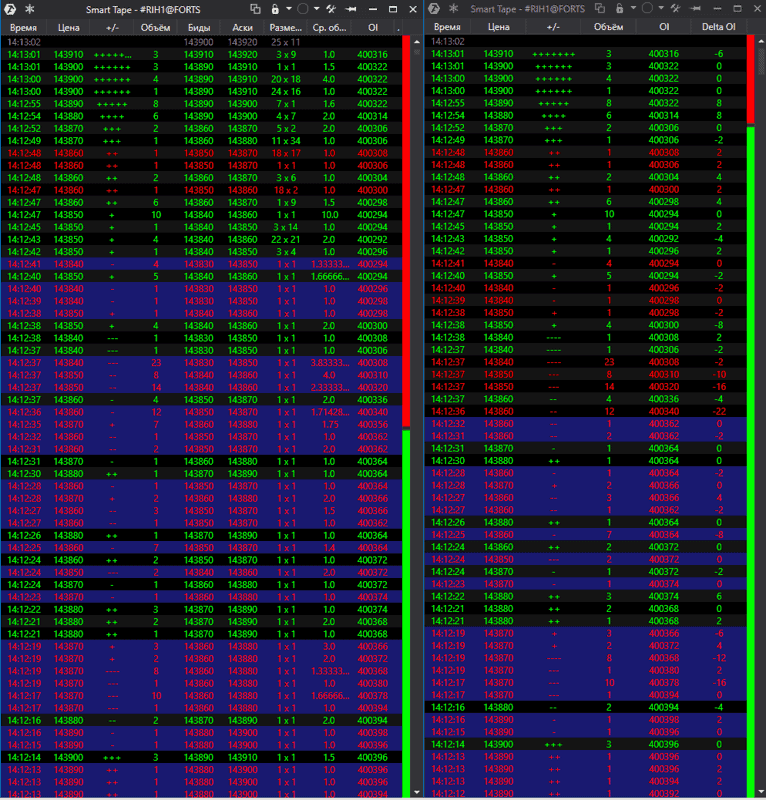
The picture below shows the standard Smart Tape to the left and the abridged user variant to the right.The standard tape includes:
- the time of execution;
- the price, at which a trade was executed;
- direction and number of ticks compared to the previous trade (positive ticks mean the price increase and negative ones mean decrease);
- the trade volume;
- the Bid price;
- the Ask price;
- the Bid and Ask sizes after the trade (this information is not shown in real time for the Russian market);
- the average trade volume on the tape;
- the Open Interest (these data are shown only for the Russian futures contracts).
Flexible settings allow reducing the column number and changing their order.
For example, the Open Interest Delta could be added for the Moscow Exchange futures – in such a case, you will see when new orders appear and old orders are closed at any moment of time. If the OI Delta grows, it means that traders open new trades, if it falls – old trades are closed. See Picture 3.
After a trader sets up a convenient Smart Tape variant, it could be saved as a template and then quickly applied to various charts. There could be any number of templates.
You can also set up alerts, so that the system would send you an audio signal or inform you in any other way when certain parameters are reached.
How to work with the Smart Tape
Professional traders sometimes work with the tape only and do not use charts, but you need to have skills and very liquid trading instruments for such trading. It is easy to lose sight of the global fundamental picture and general market direction when you work with the tape, which may result in losses.The tape could be used in a combination with the technical and cluster analysis for the search of the best entry and exit levels and also the levels at which you can increase your position. If a trader applies this approach, he marks the significant support/resistance levels in the chart beforehand and analyses what takes place on the tape when the price approaches the marked levels. This approach allows working with the tape in a more quiet mode without trying to capture all movements.
It is rather difficult to explain what you should look for on the tape and how to notice it. But we will try:
-
- Tape acceleration when breaking significant levels, as a rule, confirms the current trend. Significant levels are extreme points of the previous day, maximum volume levels, historical highs and lows and other levels, which are important for a trader. Even a beginner trader will see the tape acceleration and slowing-down. In order to understand better what it is about, compare the tape speed during the first minutes of the session, when very many trades are executed, and at lunch time, when activity slows down.
- Consecutive increase/decrease of Bids and Asks also confirms the current trend.
- The tape slowing-down during rollbacks gives a warning that the previous movement would most probably continue because it might be the profit registration and not real opposite trades.
- Big trades are often executed at significant resistance or support levels. Big trades may remain at the same price or, vice versa, they may break the level. For example, if the price decreases and the Bids cannot hold it, most probably, the down movement would continue.
- If the trend is growing and big trades appear on the tape, this could be a signal of a potential reversal or rollback. However, the context will be important in this example – if the price increased for a long time and reached a significant resistance level, big sells could be the profit registration. Not all sells result in a reversal. This is the difficult part of trading and decision making.
Unfortunately, it is not possible to specify unambiguous tape patterns, which would always work on all instruments. The tape requires attention and time for the study.
How to study the tape
ATAS allows you to view the tape in the historical mode at key levels in order to analyse your trades or learn how to work with the tape. Then, if the same setup emerges in the future, a trader would be able to trade it more confidently and with a bigger position size. Thus, you will be able to improve your skills and make a bigger profit in your trades. See Picture 4.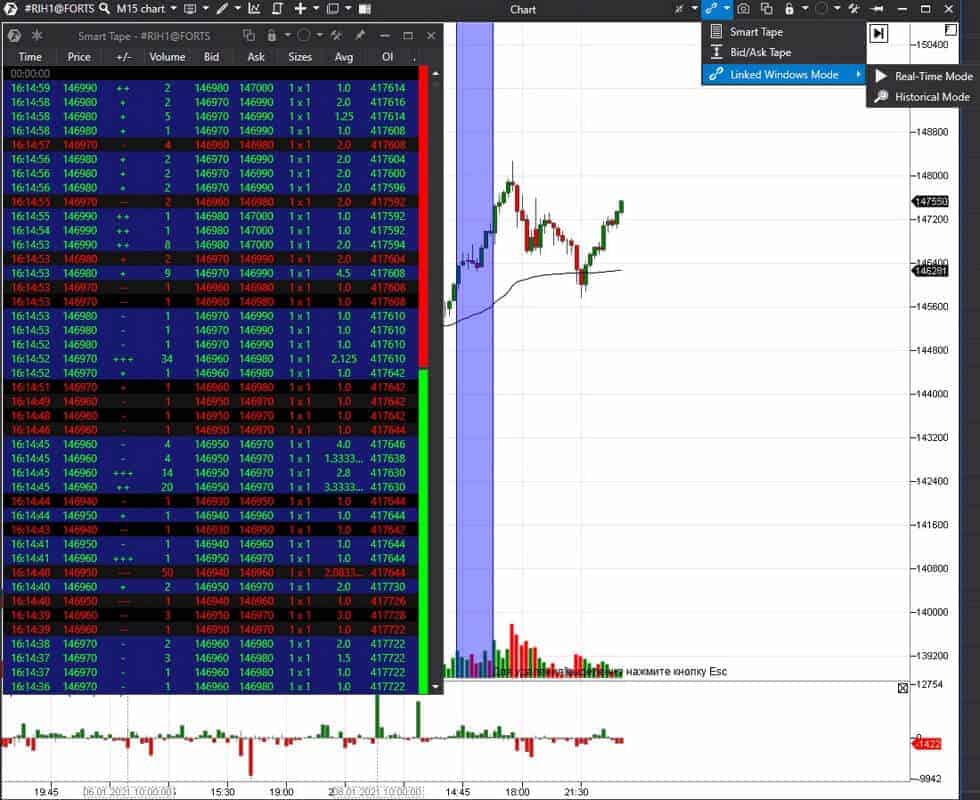
Any trader can learn how to use Time & Sales. To achieve that, you need desire, time and proper software. Download the ATAS test version and try the Smart Tape module free of charge.
Information in this article cannot be perceived as a call for investing or buying/selling of any asset on the exchange. All situations, discussed in the article, are provided with the purpose of getting acquainted with the functionality and advantages of the ATAS platform.