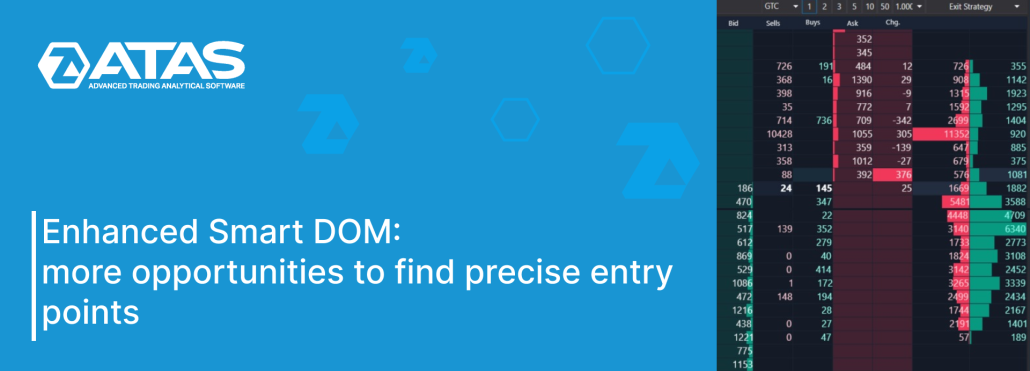
What Is Smart DOM? A Brief Introduction
Smart DOM is a standalone module within the ATAS trading and analytical platform. Its primary purpose is to analyze liquidity in the order book, i.e., to analyze limit orders or Level II data provided by the exchange in real time. The module features a built-in profile that enables you to assess activity based on recently executed trades and other information. Furthermore, Smart DOM serves another crucial purpose – trading. A wide range of functions and flexibility of settings fully justify the name of this module – Smart. As of spring 2024, following a series of updates, the Smart DOM module appears as depicted in the screenshot below. Numbers indicate: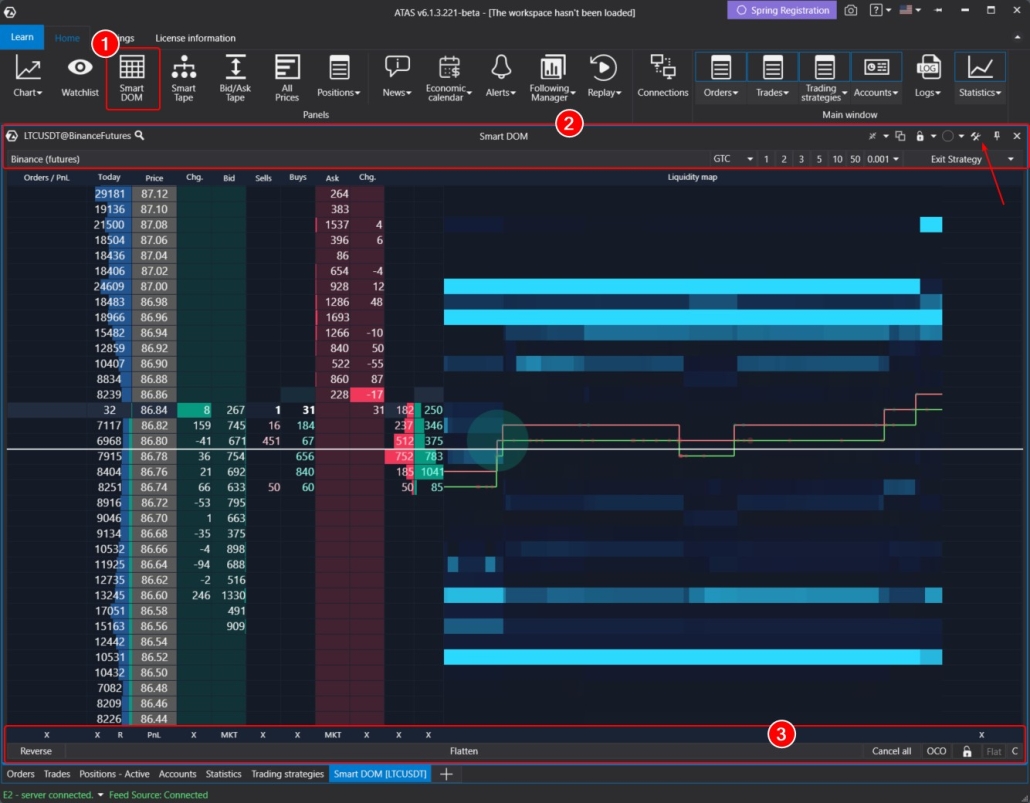
- Orders / PnL. Information about your own trading activity.
- Today. Today’s profile.
- Price. A price scale.
- Change Bid. Changes in the bid column.
- Bid. Bids, or buy orders.
- Sells. Market sells.
- Buys. Market buys.
- Ask. Asks, or sell orders.
- Change Ask. Changes in the ask column.
- Liquidity Map. Short-term heat map. More details about the Heat Map can be found in this article.
- On the right – a column for quick one-click notes.
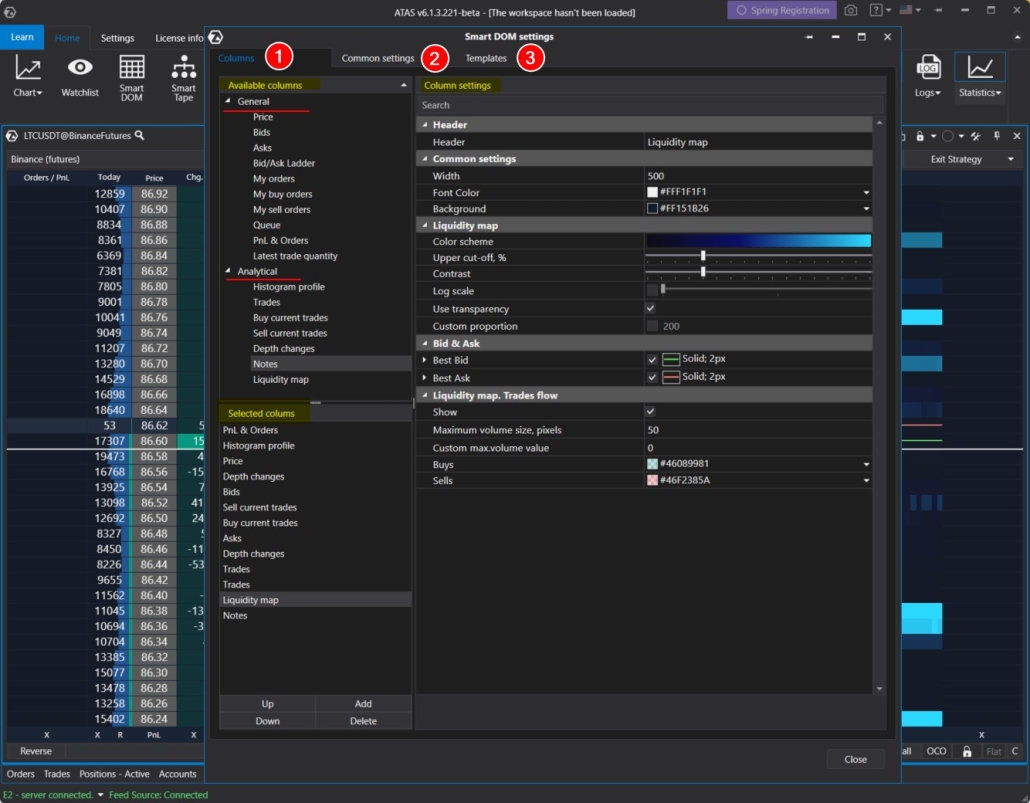
- Columns. Here, you can add, remove, and customize columns, similar to the indicator manager. In the Available Columns field, select the desired column (two sections are available – General and Analytical columns); click Add to add it, then configure the selected column on the right.
- Common settings. Here you can adjust parameters for the module as a whole.
- Templates. Saved templates.
Overview of Module Enhancements in 2024
Let’s explore the numerous enhancements that have been integrated into the module with the latest updates in early 2024.
Heat Map Has Been Added
You might have noticed the new liquidity map feature in the first screenshot of this article. It is a helpful and visually appealing tool that shows information about limit orders and recent trades in a dynamic way. To add the liquidity map, go to the settings of the Smart DOM module, select the Liquidity Map column, click Add, and make any additional adjustments as needed.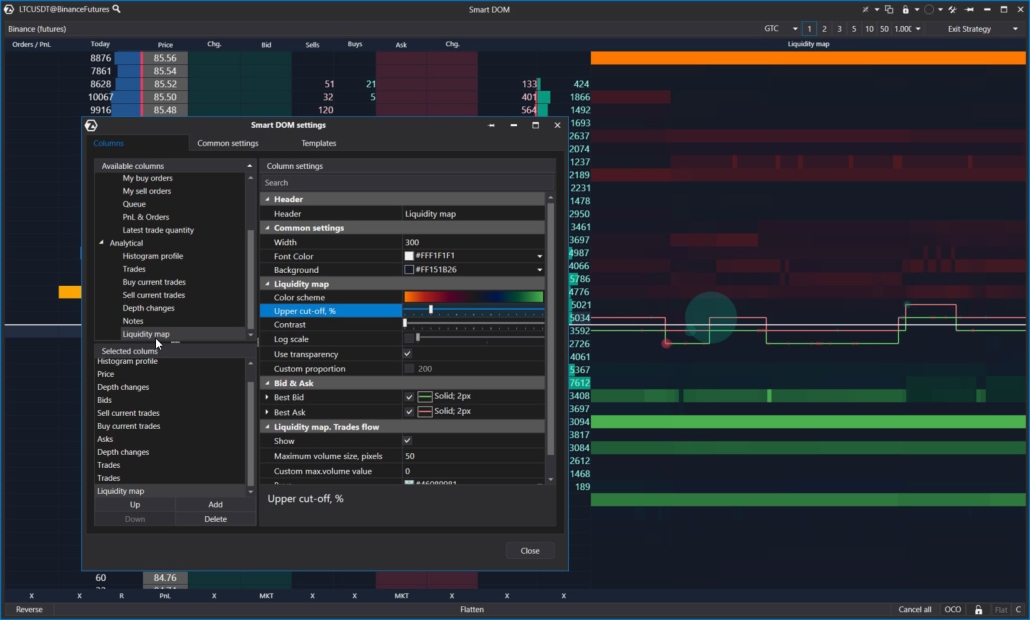
Global Font Settings
Previously, font settings were managed separately for each column. This was quite confusing but it offered great flexibility when adjusting fonts for each column. Now, font management is available on the Common Settings tab: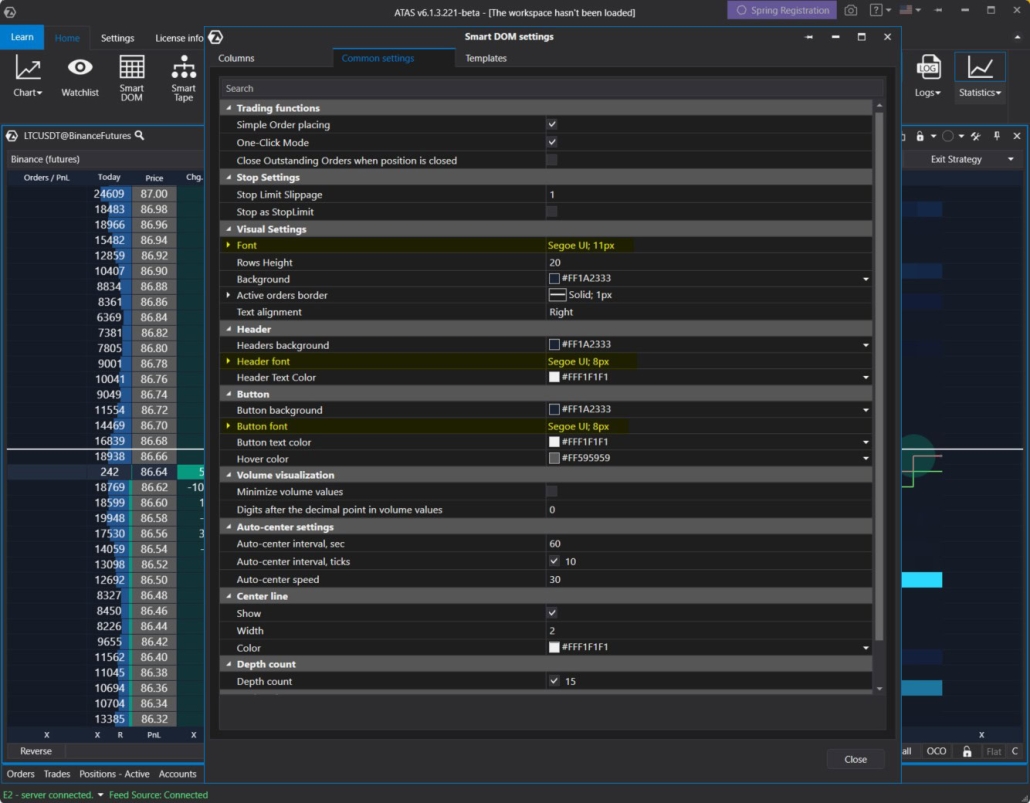
- Visual Settings: customize fonts for the content within columns.
- Header: customize fonts for column headers.
- Button: customize fonts for buttons located at the bottom (Footer).
Vertical Data Alignment
A new feature has been added to the Common Settings tab enabling users to adjust the vertical alignment of column content (left, center, right).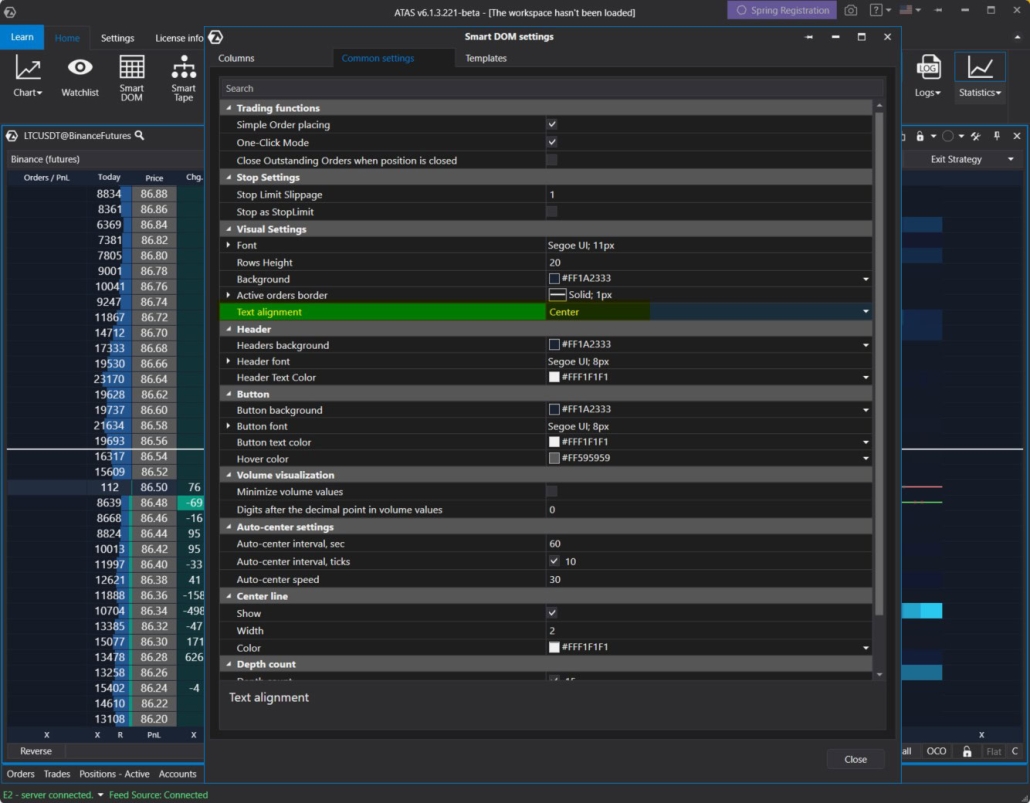
Price Rounding
A new parameter, Price Digits, has been added to the Price column settings. This enables you to truncate the content in the column by specifying how many digits to display from the right side of the price.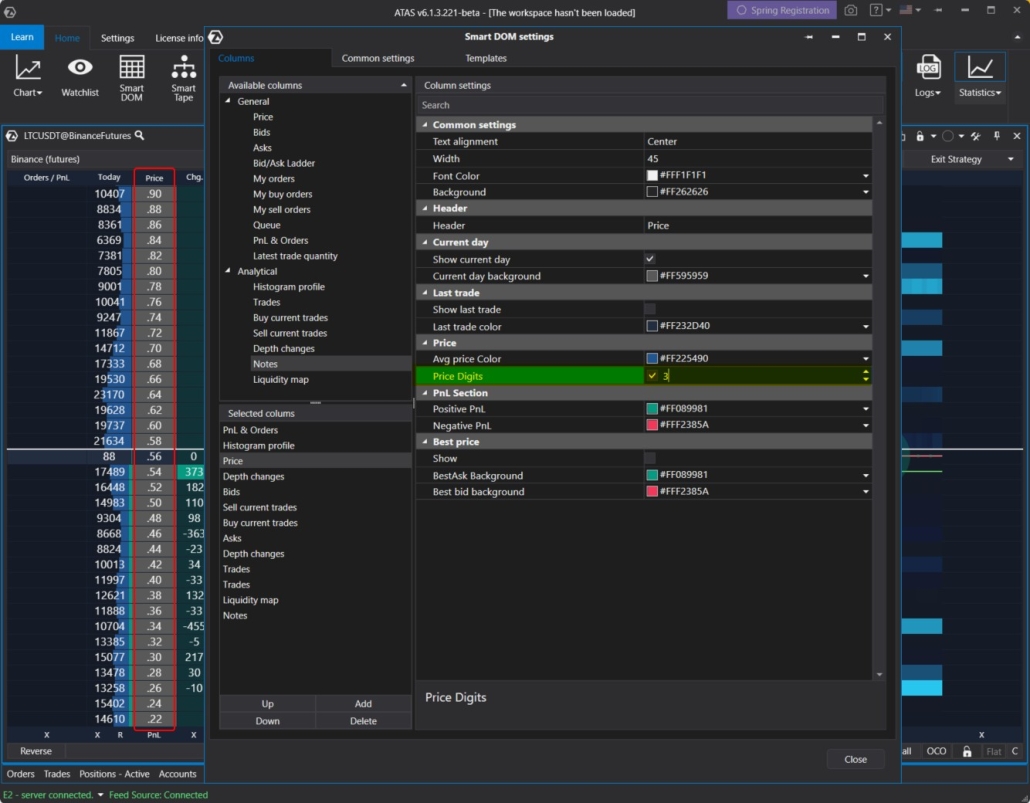
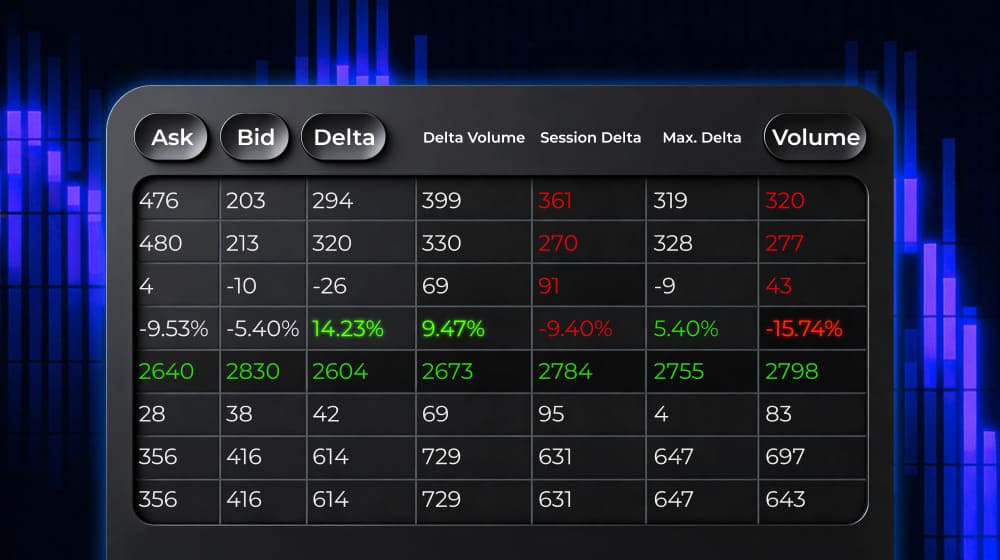
More Informative Orders / PnL Column
Previously, this column displayed information on open positions and potential profit or loss (PnL).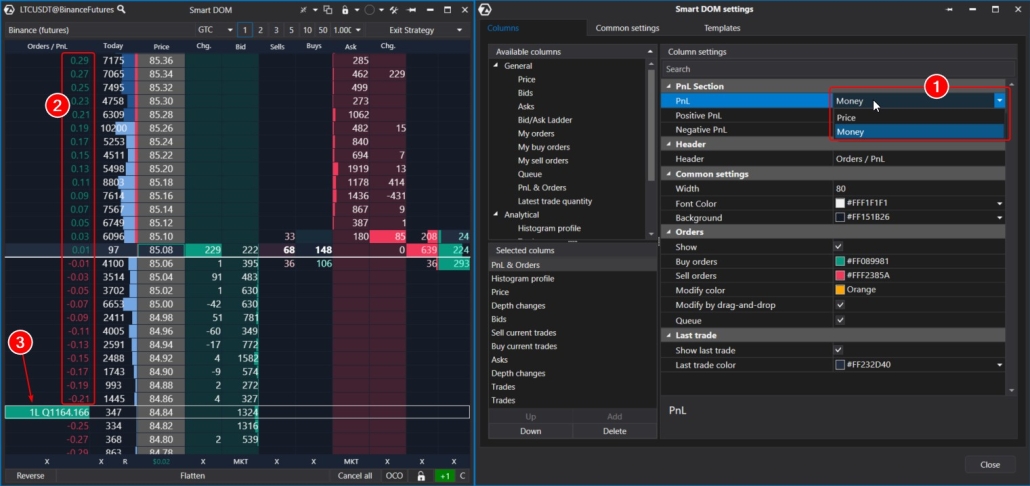
- Now, it displays the potential outcome (2) of an open position when closed at different price levels.
- Additionally, there is a marker (3) that displays the volume of an existing limit order and the queue before its execution. Using this marker, you can drag/cancel orders with the mouse.
Profile Clearing Undo
In the footer, there is an X button (1) for undoing profile clearing within Smart DOM. Clicking it enables users to revert the profile (shown as a blue histogram in the screenshot) to its original state and observe how it develops from scratch. This feature can be handy, especially for monitoring price movements after news releases.

Visual Enhancements
Smart DOM now includes several subtle enhancements that boost its visual appeal and aid users in quickly navigating through data.
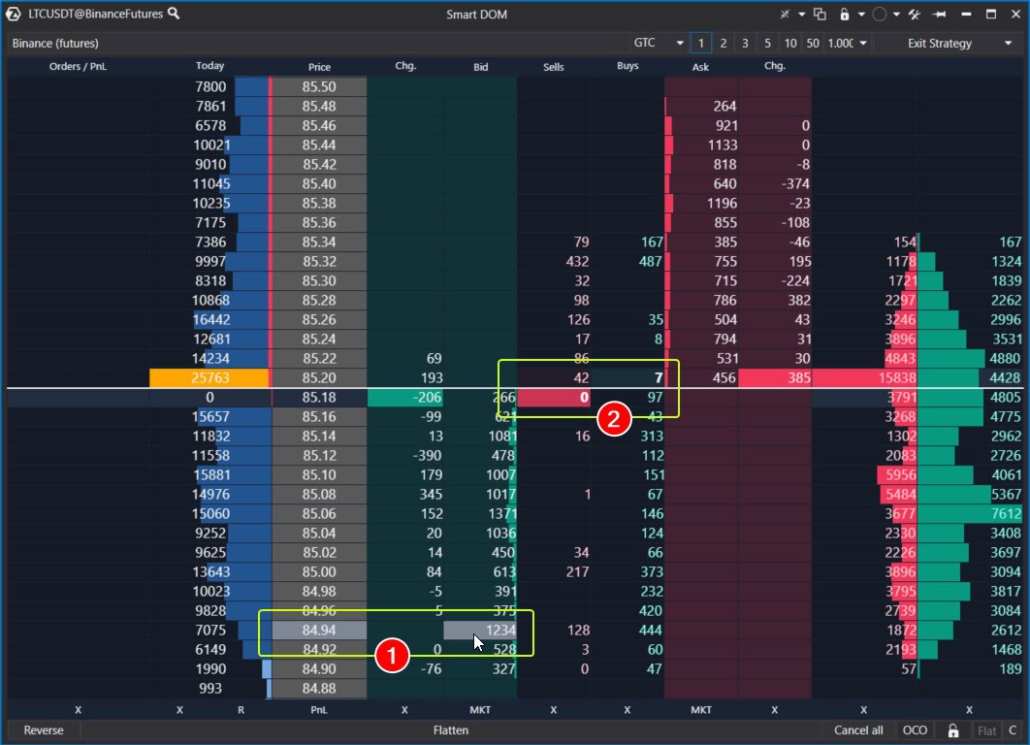
- levels now light up when hovered over with the mouse;
- the latest trades are now highlighted with color and displayed in bold font. Users can customize the color in the Sell/Buy current trades column settings using the Last Trade Settings parameter.
Enhanced Centering
Centering is the action (up-down shift) that Smart DOM automatically performs to ensure that current prices are centered on the screen. Previously, automatic centering occurred every 60 seconds.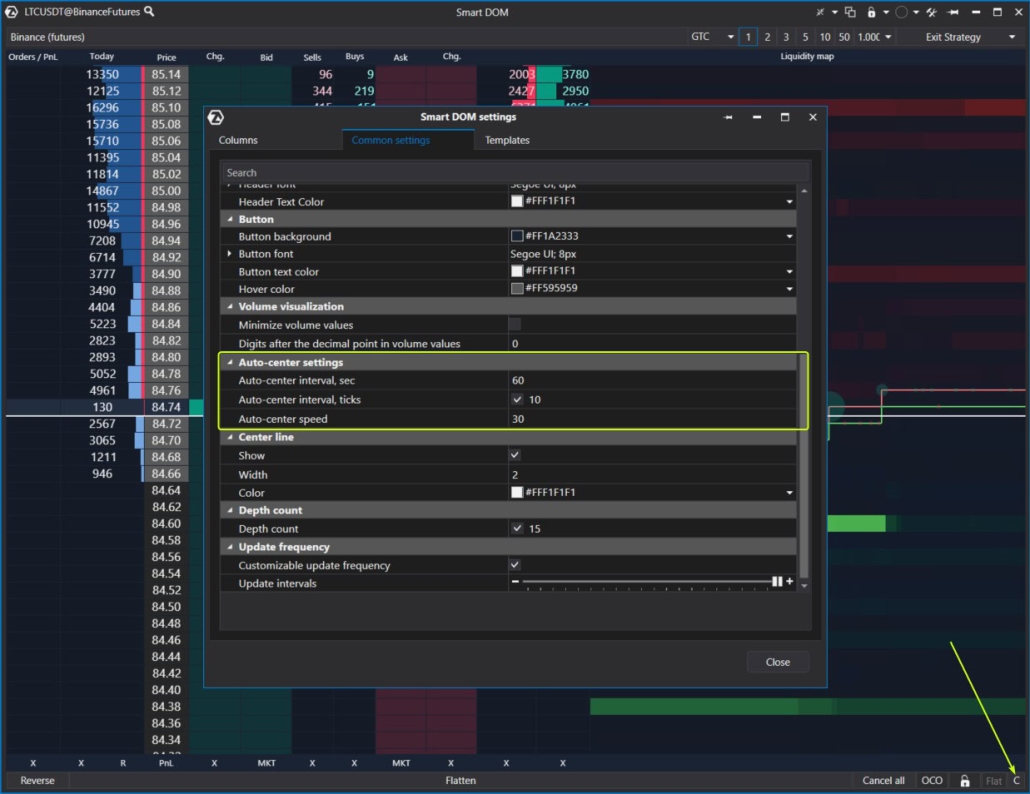
Enhancements to the Depth Changes Column
The algorithm for displaying information in this column has been improved, taking into account various technical nuances related to value accuracy. Now, the column more accurately reflects significant changes at specific price levels.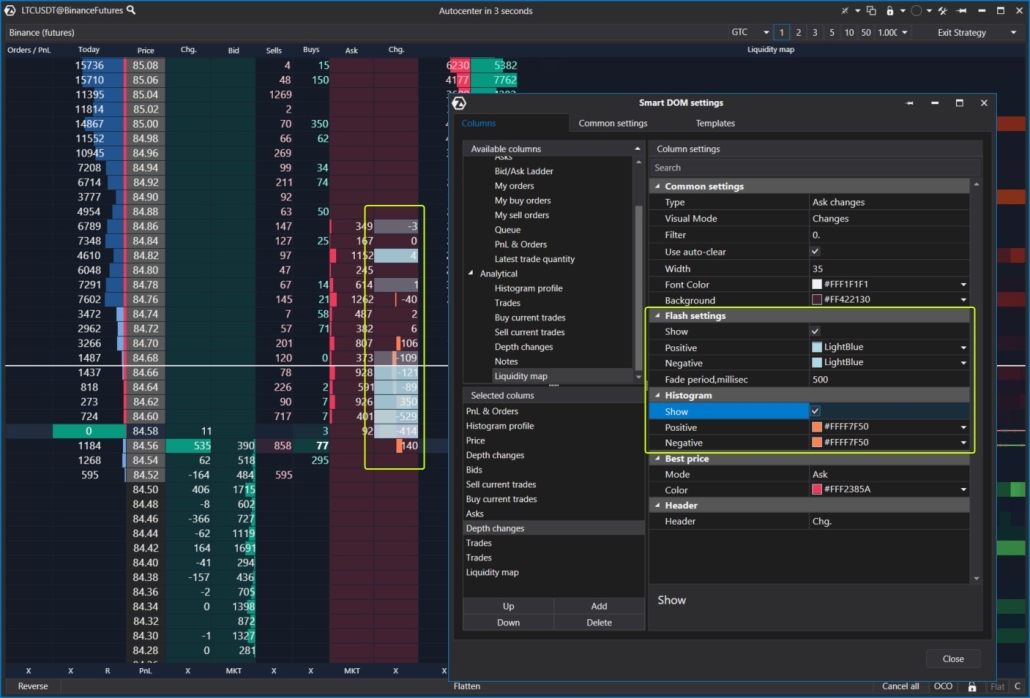
- Flash Settings parameters. These are visual “flashes” that can have different colors for positive and negative changes;
- Histogram parameters. This displays changes in a histogram format for easier comprehension.
Other Enhancements
Show Unavailable Rows parameter has been added to the Bid Ask Ladder column settings. You can use it to enable / disable the display of information for levels that were previously relevant. Depth Count parameter has been added to the Smart DOM module settings tab. It controls the number of levels in the DOM. The template library in the settings manager window has been updated. The default template opened for new users has been updated.How to Use Smart DOM in Trading
Smart DOM is a continuously updated tool designed for implementing various active trading strategies, such as scalping, when traders capitalize on small price movements by executing trades within seconds or minutes. Practical experience is the best way to assess how beneficial Smart DOM can be for you:- Download and install the ATAS platform.
- Launch Smart DOM in Market Replay mode (ensure Level II data is chosen the simulator settings).
- Assess your ability to trade profitably, pay close attention to price action around significant volume levels.
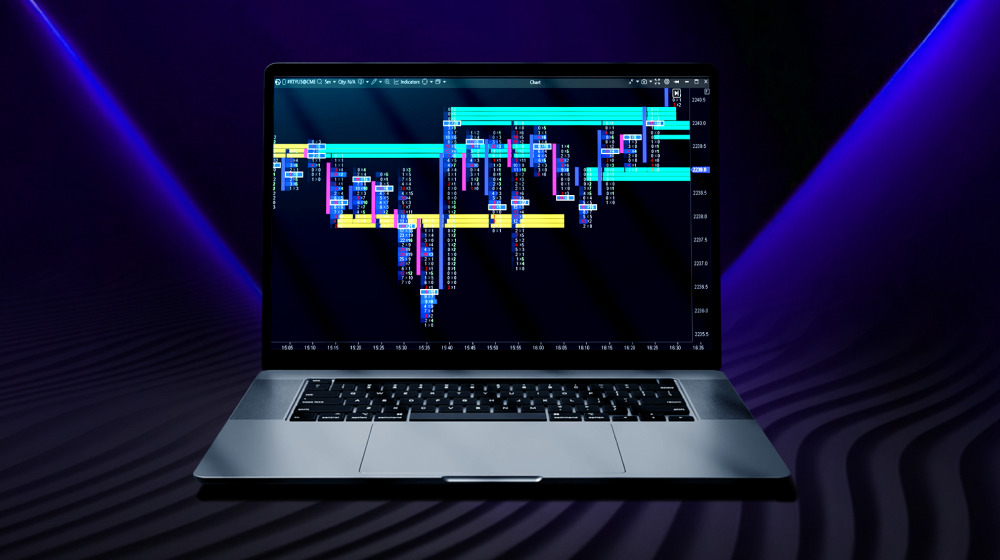
- Footprint Charts. Cluster charts offer filtering options and delta display, providing hundreds of variations. They help keep track of the overall market picture, while Smart DOM allows you to focus on the details.
- Trading features integrated into Smart DOM, enabling flexible trade volume management and customization of automatic exit strategies.
- Advanced indicators: Big Trades, DOM levels, Market Profiles, Cluster Search, Speed of Tape, and others.
Conclusions
With each update, Smart DOM becomes even smarter. It is designed to provide maximum convenience and functionality for analyzing liquidity in the order book, assisting professional traders in making informed decisions based on order flow and market dynamics. Download ATAS. It is free. During the trial period, you will get full access to the platform’s tools to experiment with copying trades, strategy development, and more. Moreover, you can continue using the program for free even after the 14-day trial period is over, whether it is for cryptocurrency trading or volume analysis. Do not miss the next article on our blog. Subscribe to our YouTube channel, follow us on Facebook, Instagram, Telegram or X, where we publish the latest ATAS news. Share life hacks and seek advice from other traders in the Telegram group @ATAS_Discussions.Information in this article cannot be perceived as a call for investing or buying/selling of any asset on the exchange. All situations, discussed in the article, are provided with the purpose of getting acquainted with the functionality and advantages of the ATAS platform.