
- History.
- Technical analysis basics.
- Technical analysis advantages.
- Methods of technical analysis of the market:
- Method 1, based on the price chart.
- Method 2, based on chart patterns.
- Method 3, based on indicators.
- TA of the financial markets:
- Stocks and securities.
- Futures.
- Cryptocurrencies.
- Books on technical analysis.
History of technical analysis of the market
What is technical analysis? Technical analysis is a complex of market analysis methods and provision of market information for making trading decisions.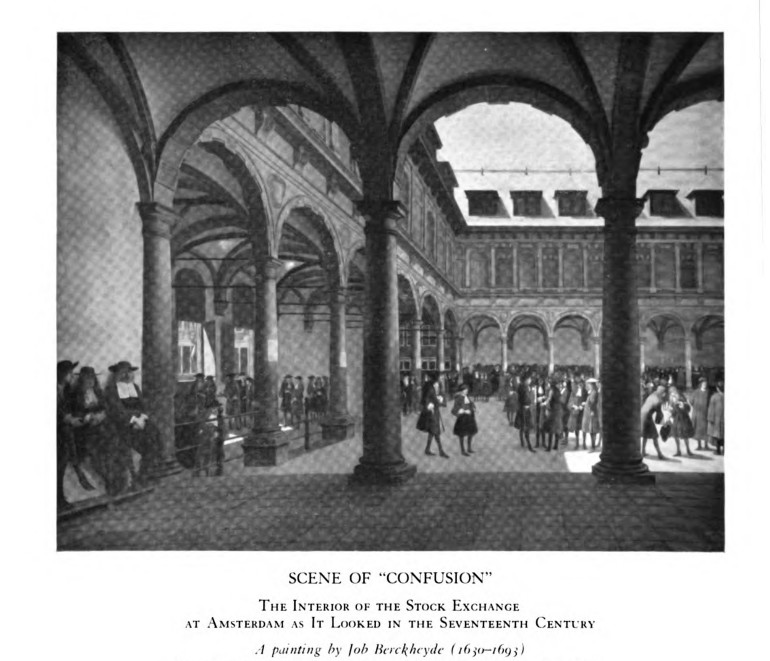
Basics of technical analysis in trading
Generally speaking, technical analysis of financial markets lies in the study of markets on the basis of historical price movements. TA works on the basis of the theory that markets have a tendency to move in sequential and repetitive patterns. That is why these patterns can be identified, and their repetition can be used, if you analyse the previous price action (under similar conditions). Let’s highlight 3 benchmark technical analysis principles. Principle 1. Markets take into account everything. This assumption tells us that all known and unknown information has been already reflected in the most recent price. For example, an insider can buy the company stock in big volumes in expectation of good quarterly reports. While he is doing it ‘under the table’, the price reacts to his actions, showing a technical analyst through the chart that the idea to buy is a good one. The ‘markets take into account everything’ principle accords with the market efficiency theory. However, this theory doesn’t help traders to make money, since markets do not give them chances. In our view, it is not quite so, because the price also takes into account erroneous opinions, for example, trades that were executed on the basis of emotions, rumors or lagging indicators. Principle 2. Price moves along a trend. All main market movements are the result of a trend. The trend concept is the foundation of technical analysis. Wyckoff called a trend the line of the smallest resistance for the price movement. The Dow theory specifies three trend types: primary (or long-term), secondary (or intermediate-term) and small (or short-term). Principle 3. History tends to repeat itself. This happens because market participants react to the price movement pretty much similarly due to their psychology. For example, market participants become greedy in the markets with an uptrend and want to buy, regardless of how high the prices are. In the same way, market participants start to panic when they see a downtrend and want to sell, despite the fact that the prices are extremely low. Here, we should also mention behavioural finance as an individual discipline in the economy and Paul Azzopardi, who combined TA with behavioural finance and introduced the ‘behavioural technical analysis’ term.Technical analysis advantages
Technical analysis of the market is very subjective, and this is a big disadvantage. However, alongside with disadvantages, TA has obvious advantages:- It is clear and easy to understand. However, note that this doesn’t mean that trading can be easy in making money. Any person will need a lot of time, patience and certain training, in order to understand the market.
- One and the same strategy can be used in several markets. Regardless of whether you analyze futures, forex, primary commodities or stocks, you can apply one and the same strategy under condition that the historical data and liquidity are available in the studied market.
- You can use technical analysis in any time-frame, so that it corresponds with your trading style preferences better. Scalpers, intraday traders, swing traders and long-term investors can get big benefits from technical analysis of the markets.
- Technical analysis is sequential. It can be studied through historical data testing, in order to train yourself and improve your results.
Technical analysis methods
We will highlight, with a certain degree of subjectivity, 3 methods / types of technical analysis of the market based on:
Method 2. Based on technical analysis lines and patterns
When traders and analysts add horizontal / inclined lines to the chart and plot various patterns, they apply the second group of technical analysis methods. We will include the following ones in this group:- Analysis of support and resistance levels.
- Fibonacci retracement levels.
- Analysis of graphic patterns.
- Mirror levels of support and resistance.
- Identification of true and false levels.
- Support and resistance areas.
- Magic of round numbers.
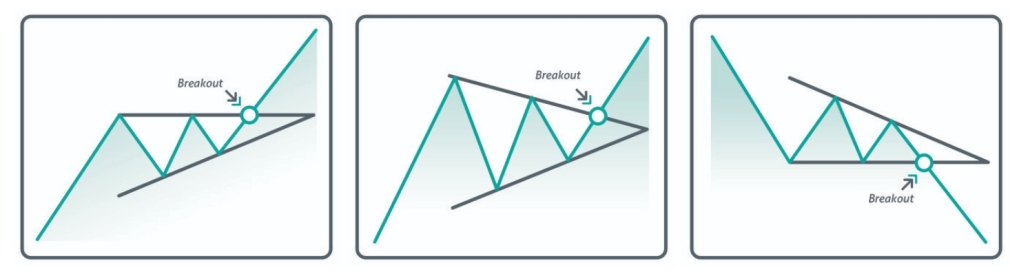
- Ascending triangle. The point of entry into buys along a trend is marked with an arrow.
- Symmetrical triangle. The point of entry into buys along a trend is marked with an arrow.
- Descending triangle. The point of entry into sells along a trend is marked with an arrow.
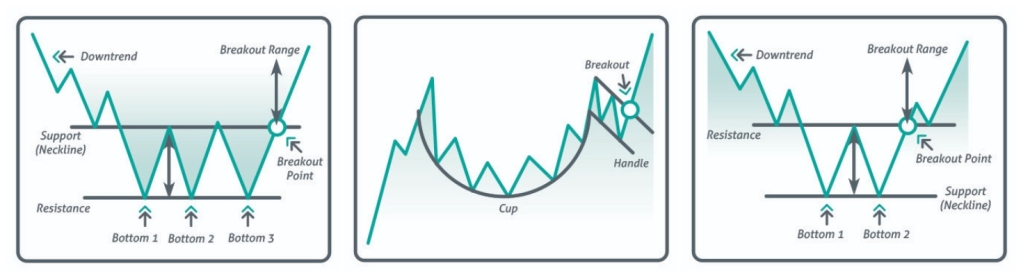
- Triple bottom. The point of entry into buys at the trend beginning is marked with an arrow.
- Cup and handle. In technical analysis, it is used for entry along a trend (the entry point is marked with an arrow).
- Double bottom. The point of entry into buys after a reversal is marked with an arrow.
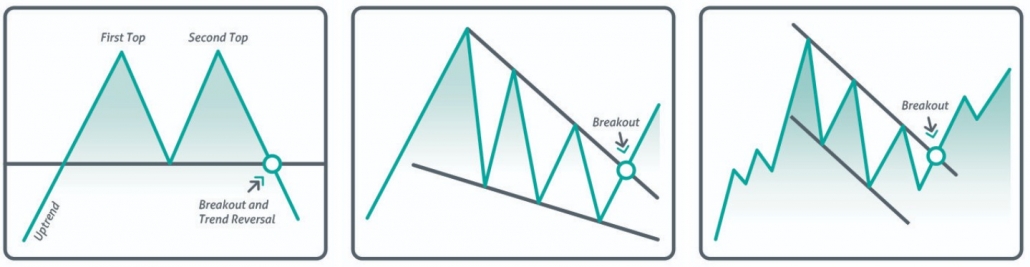
- Double top. The point of entry into sells after a reversal is marked with an arrow. The second top is rarely equal to the first one. Usually, it is a bit higher or lower.
- Falling wedge. The point of entry into buys is marked with an arrow.
- Flag. The point of entry into buys is marked with an arrow.
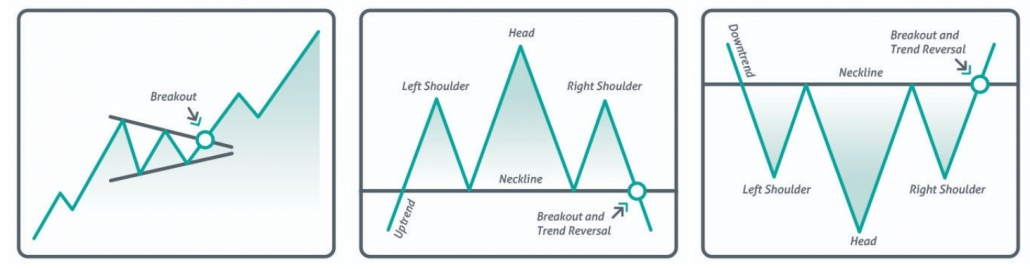
- Pennant. The point of entry into buys along a trend is marked with an arrow.
- Head and shoulders. This is a very popular and strong pattern which means a top-to-bottom reversal. The point of entry into sells at the ‘neck’ breakout line is marked with an arrow.
- Reverse head and shoulders. It can be found at bottom-to-top reversals. The point of entry into buys at the ‘neck’ breakout line is marked with an arrow.
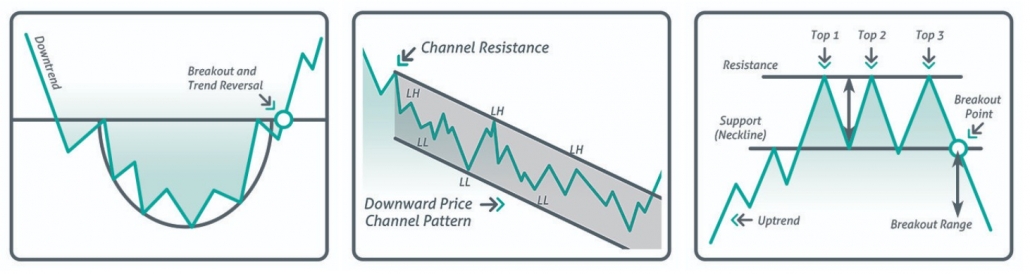
- Round bottom. The point of entry into buys along a trend is marked with an arrow.
- Price channel. A channel is built through extreme points and is applied for trading along a trend.
- Triple top. The point of entry into sells at a breakout of the support line is marked with an arrow.
Method 3. Technical analysis based on indicators
Technical analysis indicators are products of formulas which calculate exchange data. The indicator goal is to help traders and analysts to assess the market state and make decisions. It is their pro. However, sometimes, trying to simplify information by smoothing it down and cleaning it up, indicators can overlook important details. Or they can provide non-topical information for analysis. It is their con. There is one more important fact (which can be considered a con, if you believe in fairy tales): they say that there are no indicators which guarantee profit. All of them can be erroneous.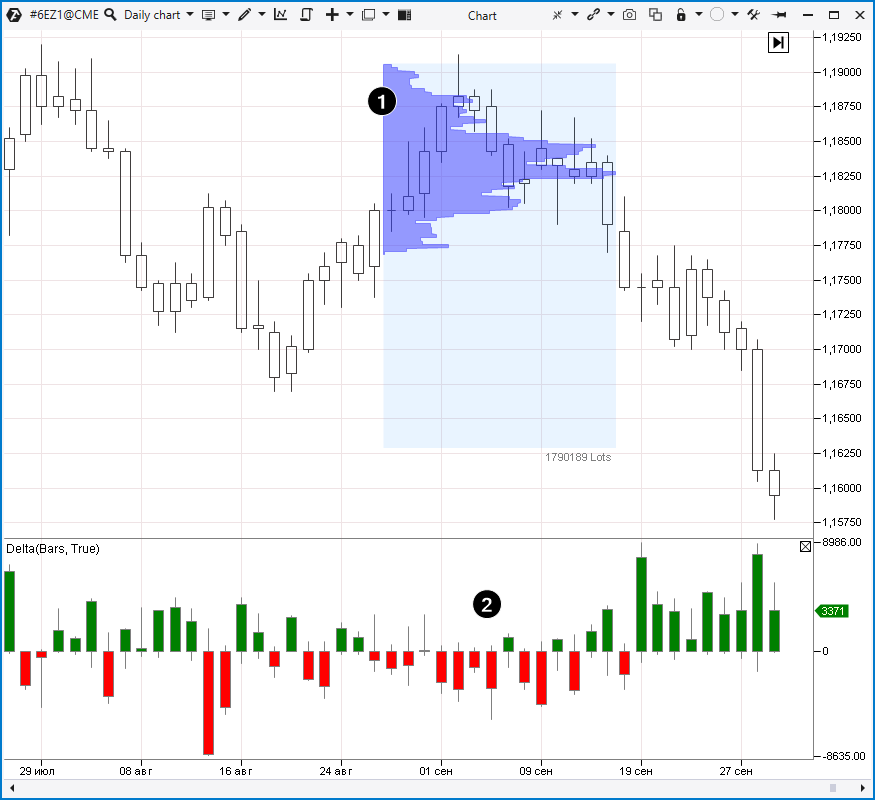
- Classical ones, which were created in the 20th century. For example, the Coppock, RSI, MACD and Bollinger Bands indicators.
- Modern ones. The most useful and sought-after indicators are added to the ATAS platform practically with every update.
- Technical analysis trend indicators. For example, Moving Average or Super Trend.
- For trading in a flat.
- Historical price data. For example, CCI.
- Order flow data. For example, Big Trades.
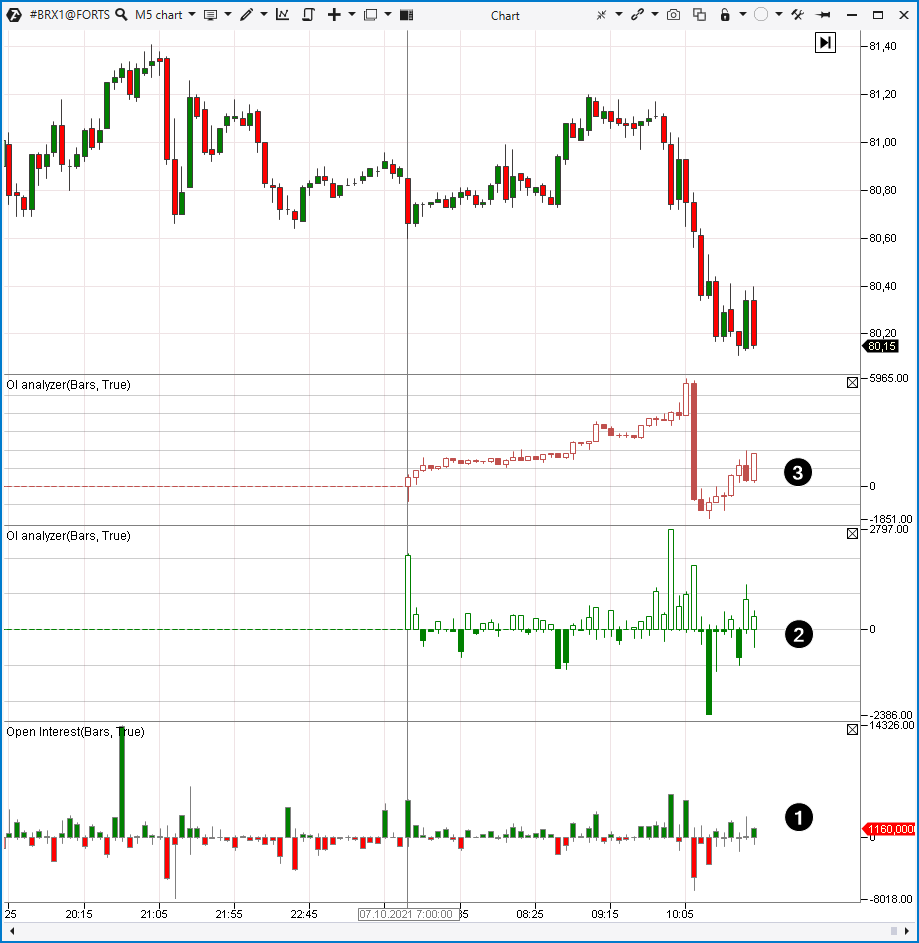
- Additional data. For example, COT report indicator or Open Interest indicator.
Technical analysis of various financial markets
Generally speaking, technical analysis is many-sided and can be applied in any financial market. In the end, ‘head and shoulders’ will have similar shapes both in the stock and cryptocurrency markets. Nevertheless, we will consider some specific features of every market, which can be useful for novice technical analysts.Technical analysis of securities
When speaking about stock market technical analysis, we should note that securities (for example, AAPL stock) are traded only from 09:30 until 16:00 New York time. That is why there can be price gaps between the session opening and closing, while the first and last minutes of trading are very active. This can make it hard to trade technical analysis patterns during the day. That is why it is preferable to use the daily period for more adequate stock market technical analysis. Or you can use a life hack. The ATAS platform has several chart types. It means that you can use non-standard periods in order to pay more attention to active areas and ‘expand’ them. As regards less active areas, they will take less place in a chart.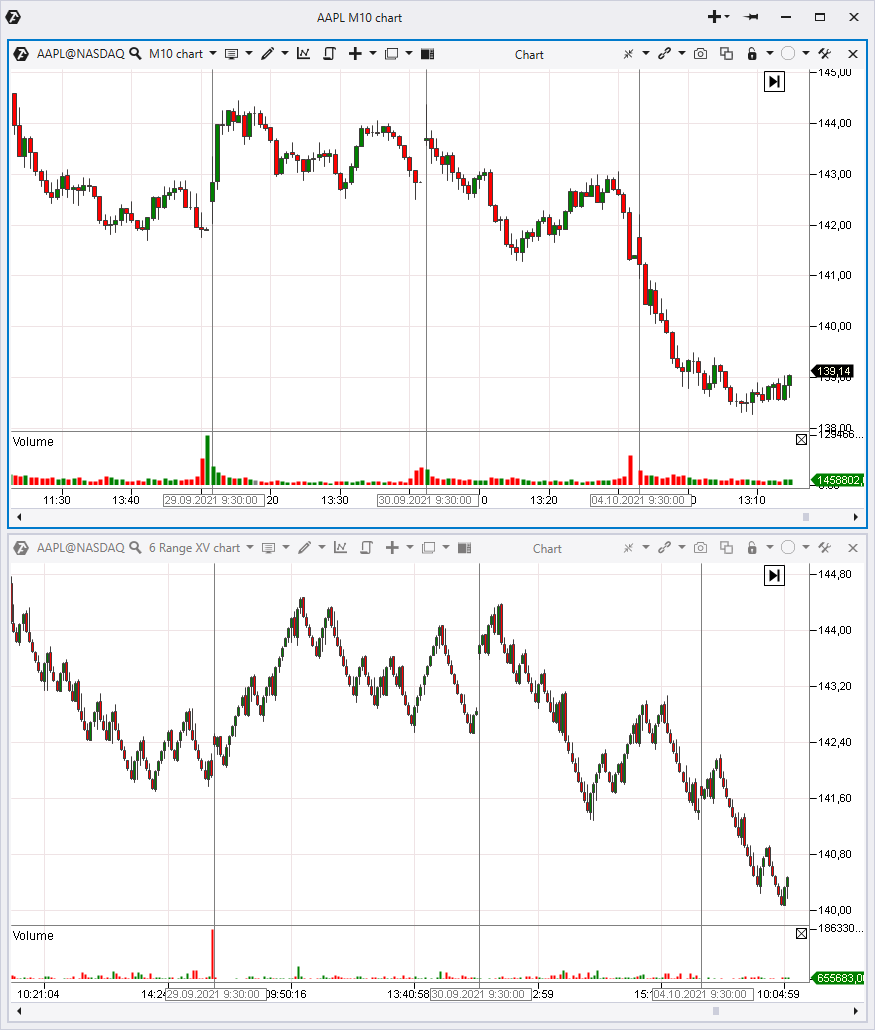
Technical analysis of the futures market
The futures market is a derivative market (what futures are) and it has a lot of advantages for traders.- A wide selection of underlying assets. Traders that use technical analysis can trade futures in the currency, stock, raw material and other markets.
- Relative affordability for novices to open a minimum deposit.
- Relatively low commission fees.
- High leverage can be an advantage for professionals.
- Possibility to trade in both directions.
- High liquidity in popular markets.
- Futures markets are open nearly 24 hours on working days.
Technical analysis of the cryptocurrency market
High volatility is typical for cryptocurrencies. The picture below shows a comparison of Bitcoin, gold and stock index price changes.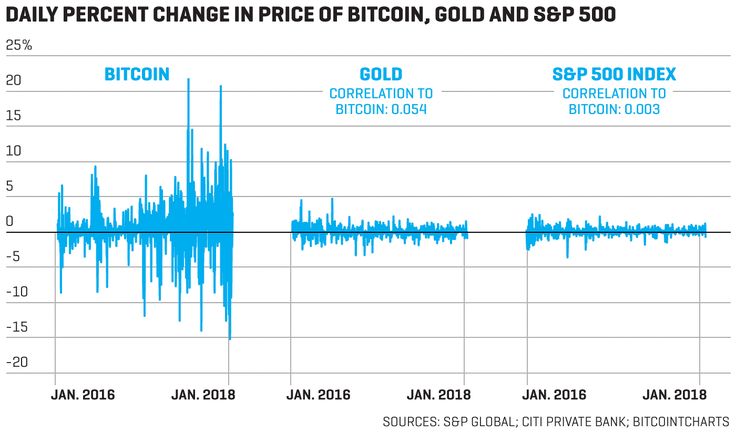
Books for those who study technical analysis
As a conclusion to this article, we provide a list of books to those who are looking for the best technical analysis books. We can hardly specify any of them as the best one, since all of them are decent.- John Murphy. Technical Analysis of the Futures Markets.
- Jack Schwager. Technical Analysis. Study guide.
- Thomas DeMark. The New Science of Technical Analysis.
- Cornelius Luca. Technical Analysis Applications in the Global Currency Markets.
- Eric Nyman. Small Trader’s Encyclopedia.
- David Weis. Modern Adaptation of the Wyckoff Method.
Information in this article cannot be perceived as a call for investing or buying/selling of any asset on the exchange. All situations, discussed in the article, are provided with the purpose of getting acquainted with the functionality and advantages of the ATAS platform.


