Bitcoin dominance (BTC.D) represents the ratio of Bitcoin’s market capitalization to the total capitalization of all cryptocurrencies. Measured as a percentage, it serves as a critical indicator for traders and investors to gauge market sentiment, identify the current phase of the market cycle, and plan their strategies effectively.
Read more:
Bitcoin Dominance Meaning
Bitcoin dominance represents the share of the total cryptocurrency market that Bitcoin occupies.
How to calculate BTC dominance?
The formula for calculating Bitcoin dominance is simple:
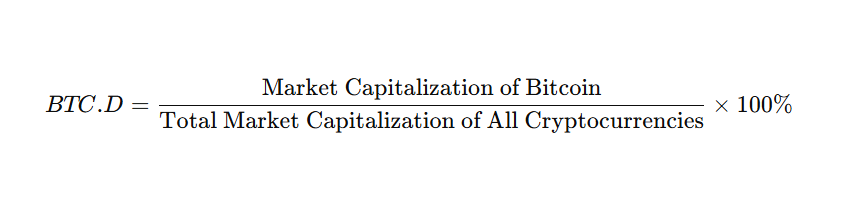
The higher the percentage, the greater Bitcoin dominance in the market.
For example, if the total market capitalization is $1 trillion and Bitcoin’s market capitalization is $500 billion, its dominance would be 50%.
What is the current Bitcoin dominance percentage?
Over the past five years, Bitcoin dominance has fluctuated between 40% and 70%.
Understanding Bitcoin Dominance
The dominance of Bitcoin might seem like a simple ratio, but it is much more than just a number. It reflects real market dynamics — how capital flows shift, how investors’ risk preferences change, and how technological developments shape the industry.
Bitcoin dominance acts as a compass for investors and traders, offering guidance on the current phase of the cryptocurrency market’s evolution. It often indicates how the market balances between stability and risk.
What affects Bitcoin dominance?
Bitcoin dominance rises and falls depending on where investors are putting their money — into Bitcoin or alternative cryptocurrencies (altcoins).
Understanding why investors make these choices is a more complex matter that requires deeper analysis. The conclusions drawn can vary depending on the current market stage and the underlying fundamental factors at play.
Historical Background on the Bitcoin Dominance Index
Bitcoin is considered the first cryptocurrency — when it launched in early 2009, BTC accounted for 100% of the market.
However, its share began to decrease as new coins emerged:
- 2011: Litecoin (LTC) was introduced. Designed as “digital silver” to complement Bitcoin, the “digital gold,” Litecoin features faster block processing and an enhanced mining algorithm (Scrypt).
- 2012: Ripple (XRP) was launched, targeting the banking sector and payment systems. It stands out for its centralized management approach.
- 2013: Dogecoin (DOGE), the first meme coin, was created.
The chart below shows the growth of cryptocurrency market capitalization in trillions of dollars over the past decade:
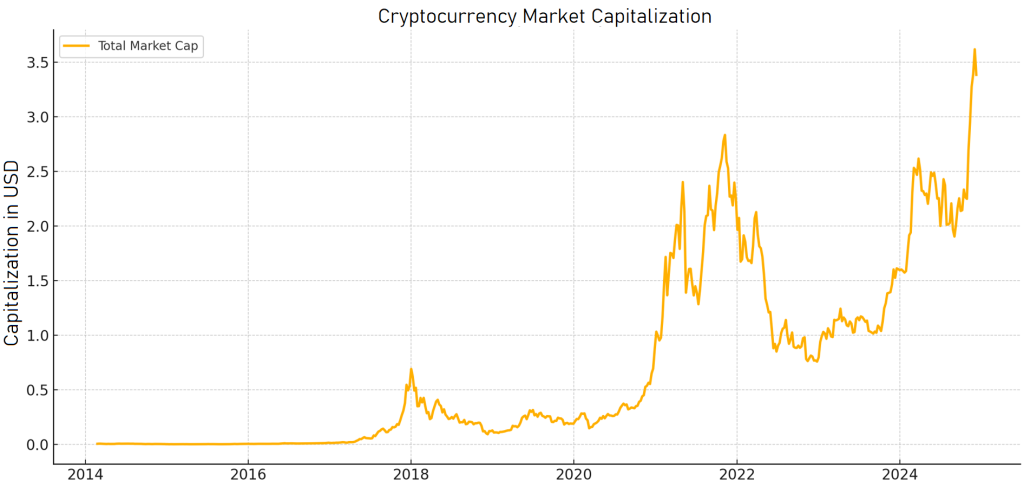
The rising market capitalization is a clear indicator of a bull market and increasing cryptocurrency prices.
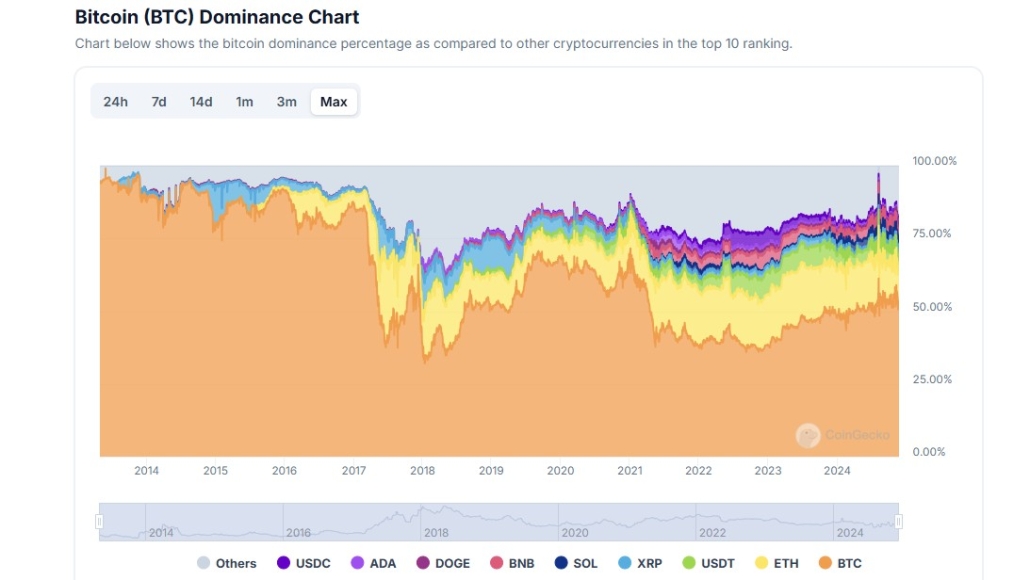
The chart below illustrates how Bitcoin’s share (dominance) in the total cryptocurrency market capitalization has evolved over the last 10+ years.
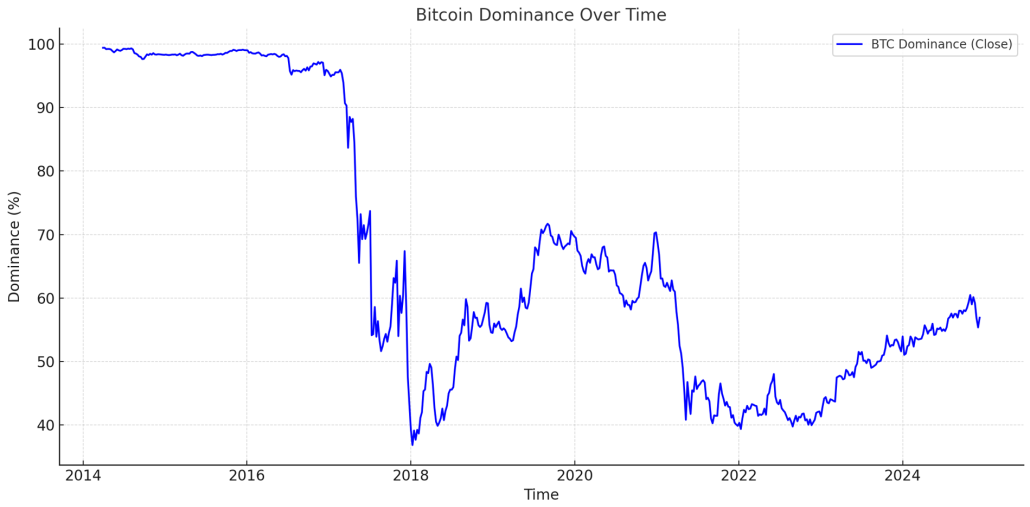
By analyzing these charts, we can identify five key periods in the market’s development since the advent of altcoins — Bitcoin’s alternatives. Interestingly, the correlation between these charts changes over time, which we will explore further.
2016–2017: Bitcoin Dominance Declines Below 40%
The drop in interest in Bitcoin, even as the total cryptocurrency market capitalization grew to $0.7 trillion, was fueled by the market’s rapid growth.
- The influence of Ethereum. Vitalik Buterin’s platform became the foundation for smart contracts, fueling the mass launch of DeFi projects and the creation of new tokens.
- The ICO boom. A wave of new tokens attracted massive investments, boosting the share of altcoins and reducing Bitcoin dominance.
- Speculative interest. The high returns from altcoins captured the attention of traders and investors, gaining significant media coverage.
- Network challenges for Bitcoin. Growing global interest in cryptocurrencies led to network congestion, high fees, and slower transaction speeds on the Bitcoin blockchain.
2018–2019: Bitcoin Dominance Rises to 70%
At the start of 2018, following the launch of Bitcoin futures on the CME exchange, the market entered a bearish phase. This period can be seen as a “cooling-off” stage after BTC/USD soared to $20,000.
The bear market affected many altcoins created during the ICO boom, causing them to lose much of their value or disappear entirely. Meanwhile, Bitcoin demonstrated its resilience as a stable asset.
- Growing trust. Bitcoin strengthened its role as the primary reserve asset in the cryptocurrency market, while investors increasingly avoided high-risk altcoins.
- Institutional interest. From 2018 to 2019, institutional investors began to see Bitcoin as a key entry point into the cryptocurrency market and a tool for diversifying their portfolios.
- Technological advancements. In 2018, the Lightning Network was launched on Bitcoin’s mainnet, improving its performance and scalability.
2020–2021: Bitcoin Dominance Falls Below 40%
In the spring of 2020, the spread of COVID-19 led to lockdowns, quarantines, and disruptions in supply chains. In response, the governments of the United States and other countries implemented economic stimulus measures through quantitative easing.
After the initial panic, financial markets began to recover. Increased interest in riskier assets led to a rise in cryptocurrency prices and overall market capitalization. However, Bitcoin dominance decreased for several reasons:
- Increase in new tokens. The mass launch of tokens within the DeFi, NFT, and GameFi ecosystems diluted Bitcoin’s market share, despite its high price.
- Altcoin season. During the bull market of 2021, altcoins experienced significant growth, with many outperforming Bitcoin in terms of returns and attracting more capital. For example, ADA outperformed BTC by approximately 10 times.
- Rise of meme coins. Meme coins, such as Dogecoin and Shiba Inu, gained strong support on social media and from influential figures like Elon Musk, boosting their market share.
- Emergence of stablecoins. The growing popularity of USDT and other dollar-pegged assets as a means of capital preservation led to an increase in the share of stablecoins within the overall market capitalization, reducing Bitcoin dominance.
- Declining attractiveness of BTC. Investor interest in Bitcoin waned due to high transaction fees, environmental concerns surrounding mining, and competition from more technologically advanced altcoins.
2022: Bitcoin Dominance Under Pressure
Since late autumn 2021, cryptocurrency prices began to decline, and 2022 became one of the toughest periods for the crypto market, often referred to as the “Crypto Winter.”
In response to rising inflation, central banks, including the U.S. Federal Reserve, sharply increased interest rates, raising concerns about a potential recession. As borrowing costs climbed, investors pulled their funds from riskier assets, including cryptocurrencies.
The massive use of leverage in cryptocurrency markets during the 2021 rally led to a wave of investor position liquidations in 2022, contributing to the collapse of major players:
- In May 2022, Terra Luna and its algorithmic stablecoin, UST, crashed after UST lost its peg to the dollar. This triggered the collapse of the entire Terra ecosystem, wiping out over $40 billion in market capitalization.
- FTX collapse. In November 2022, leading cryptocurrency exchange FTX filed for bankruptcy due to a severe liquidity crisis and poor asset management. Investigations revealed significant mismanagement of customer funds.
- Celsius, Voyager, Three Arrows Capital, and other major players also faced serious difficulties.
What is particularly noteworthy is that, while Bitcoin dominance surged from 40% to 70% during the bear market of 2018–2019, during the “Crypto Winter” (marked by black vertical lines below), Bitcoin dominance never exceeded 50% (highlighted by the blue background).
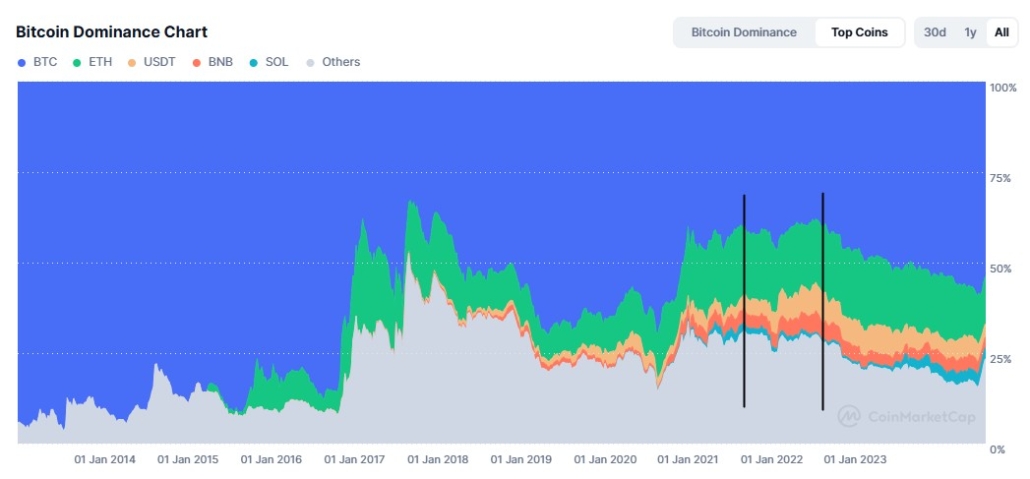
This can be explained by the fact that the cryptocurrency industry has stabilized and entered a more mature phase compared to its early volatile years.
2023-2025: Bitcoin Dominance Rises to 60%
Since the start of 2023, the cryptocurrency market has entered a bullish trend, driven by several key factors:
- Federal Reserve policy. In 2023, the U.S. Federal Reserve slowed the pace of interest rate hikes and began cutting rates in 2024, making cryptocurrencies more attractive to investors.
- Bitcoin ETF approval expectations. In 2023, major institutional players, including BlackRock, applied for spot Bitcoin ETFs. In early 2024, the SEC approved these applications, offering individuals an easier and more legal way to invest in Bitcoin.
- AI boom. Blockchain projects started integrating AI, sparking greater interest from investors.
- Regulatory improvements. New regulations in the U.S. and the EU (including MiCA) have improved transparency and trust in the industry. Ripple Labs’ victory in its lawsuit against the SEC also positively impacted the legal standing of the cryptocurrency sector.
An interesting fact: during the bullish cryptocurrency market from spring 2020 (the lowest point of the COVID-19 panic) to fall 2021, Bitcoin dominance fell to about 40%. However, during the 2023-2024 growth period, Bitcoin dominance rose. It is possible that in 2024, investors shifted their focus from altcoins to Bitcoin, partly due to the influx of funds into Bitcoin ETFs.
How to Use Bitcoin Dominance in Investing?
The analysis of Bitcoin dominance and BTC/USD price charts provides the basis for the assumptions you can see below. These insights can help make more informed trading decisions, considering that the correlation between Bitcoin’s price and its dominance may change over time.
| When Bitcoin’s price is rising | When Bitcoin’s price is falling | |
| Meaning | A bullish trend for Bitcoin is observed, attracting the primary market capital. Investors tend to move towards a more reliable asset | In times of growing bearish sentiment, investors typically move funds from altcoins to Bitcoin, viewing it as a safer asset |
| What traders should do | It is advisable to increase Bitcoin’s share in your portfolio. Be cautious when purchasing altcoins, as their performance may remain weak | Consider reducing or closing positions in altcoins. To preserve capital, it is better to hold assets in Bitcoin or stablecoins |
| Example | Bullish trend in 2023-2024 | Bearish altcoin market in 2018 |
| When Bitcoin’s price is rising | When Bitcoin’s price is falling | |
| Meaning | Investors are actively seeking higher returns in altcoins, which could signal the start of the “altcoin season” | The market is entering a phase of sharp decline, with investors moving their funds from cryptocurrencies to stablecoins or fiat |
| What traders should do | It might be a good idea to consider buying promising altcoins | Stay calm and think about shifting to stablecoins or reallocating capital into other financial assets |
| Example | In the first four months of 2021, DOGE surged by about 4,000%, while BTC increased by just 65% | In the summer of 2022, during the “Crypto Winter,” Bitcoin dominance dropped from 49% to 39%, and its price fell below $20,000 |
How to Use Bitcoin Dominance in Trading?
The information above highlights key trends in Bitcoin dominance across various phases of the cryptocurrency market, ranging from weeks to months.
However, this does not imply that Bitcoin dominance is a tool exclusively for medium- or long-term trading. Intraday traders can also leverage futures contracts to actively speculate on frequent fluctuations in Bitcoin’s share of the overall cryptocurrency market capitalization.
How to Trade Bitcoin Dominance Futures
Start by downloading, installing, and launching the ATAS platform for free. Configure ATAS to connect to Binance.
Next, open a new chart (marked as 1 in the screenshot below) and select BTCDOMUSDT (marked as 2 in the screenshot).
While dominance itself is measured as a percentage, BTCDOM is a tradable asset priced in USDT.
Although intraday changes in Bitcoin’s market share may appear small, historical data shows that price fluctuations of the BTCDOMUSDT contract typically:
- vary between 1–2% per day during periods of low volatility;
- reach 5–10% per day during periods of high volatility.
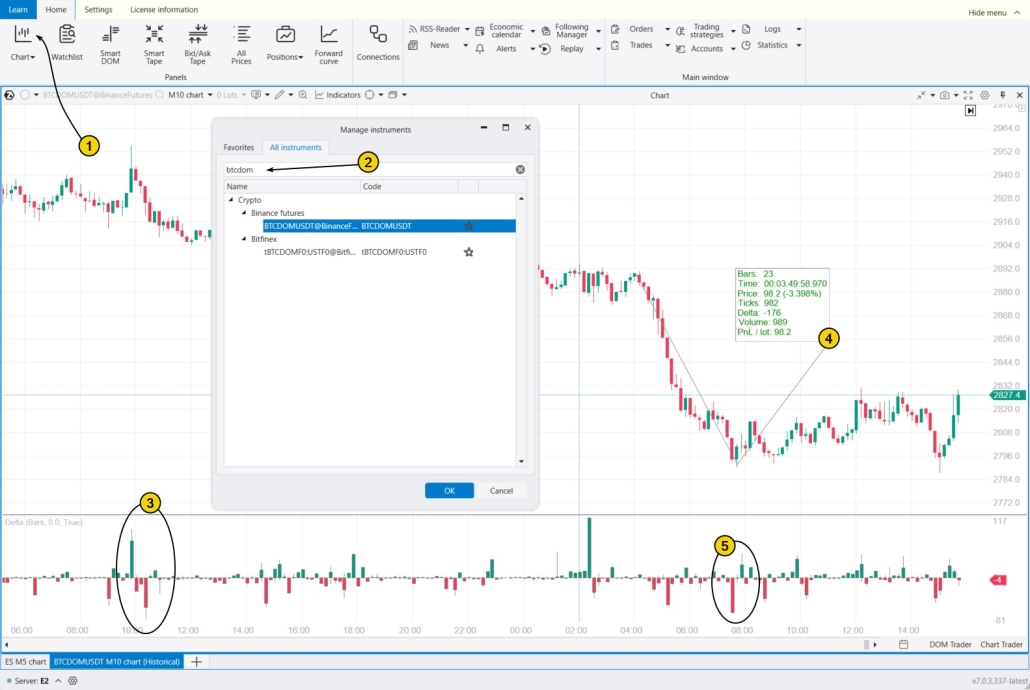
Example. The Delta indicator added to the chart highlights the following developments:
3 – a sharp increase in positive Delta suggests that buyers are entering a bull trap. A subsequent surge in negative Delta “springs” the trap, triggering a downtrend.
4 – during the active phase of the downtrend, the price dropped by over 3% within a few hours.
5 – a possible selling climax is observed. A spike in negative Delta suggests the liquidation of long positions at market prices. Following this, the downtrend weakens, potentially temporarily.
How to Master Trading Bitcoin Dominance Futures?
Trading Bitcoin dominance futures is much like trading any other financial asset:
- It is a serious, competitive business, not a gamble or a shortcut to instant wealth.
- Success comes to disciplined traders who follow strategies with a clear competitive edge, such as analyzing footprint patterns or using professional indicators to assess market volumes.
- For beginners, it is wise to start cautiously and avoid risking real money too soon. To enhance your chances of success, consider using the ATAS Market Replay trading simulator — a platform module that replicates real trading conditions based on historical data.
In the Market Replay simulator, you can:
- adjust the playback speed, and pause;
- analyze footprint charts;
- use over 200 indicators;
- use Chart Trader and other features to trade on the Replay built-in demo account, and then analyze your performance;
- use exit strategies.
To start working with the simulator, download the ATAS platform for free, install, launch it, and then:
- Open a chart of a financial instrument.
- Click on the Market Replay button in the main ATAS menu.
- Activate the Replay mode (the icon should turn green).
- Select the necessary settings (date, data type).
Start the playback and identify entry points using volume analysis tools.
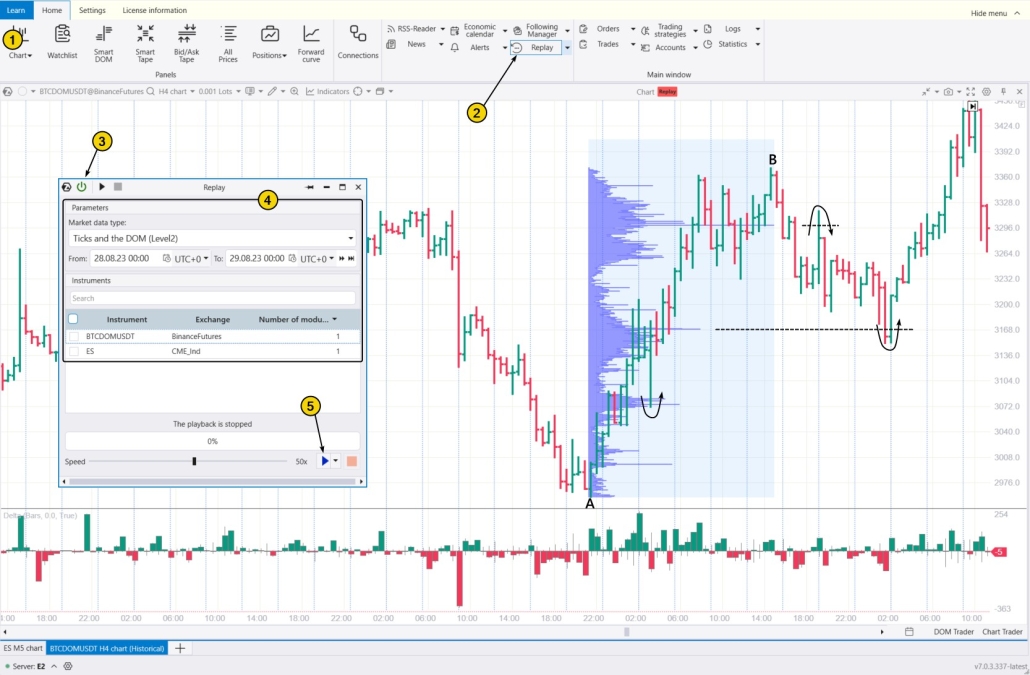
Example. The screenshot above shows a chart with a market profile created for the bullish impulse A→B. Notice how the bulges on the profile (levels with significant trading volumes) acted as key reversal points three times. This can be a valuable tool to integrate into your trading strategies.
FAQ
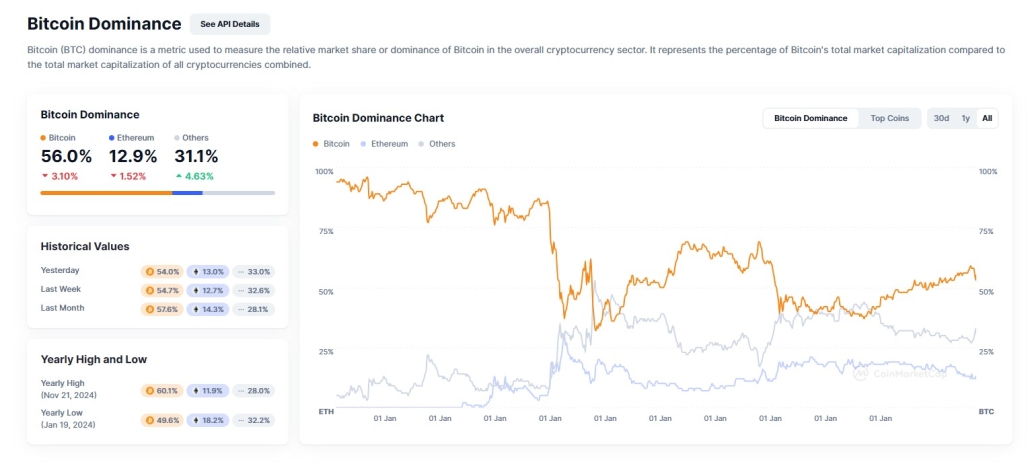
How To Check BTC Dominance Chart?
For a long-term historical analysis, it is advisable to use specialized resources that track changes in Bitcoin dominance and the share of other crypto assets in the overall market.
Example: coinmarketcap.com
Alternatively, CoinGecko can be used.
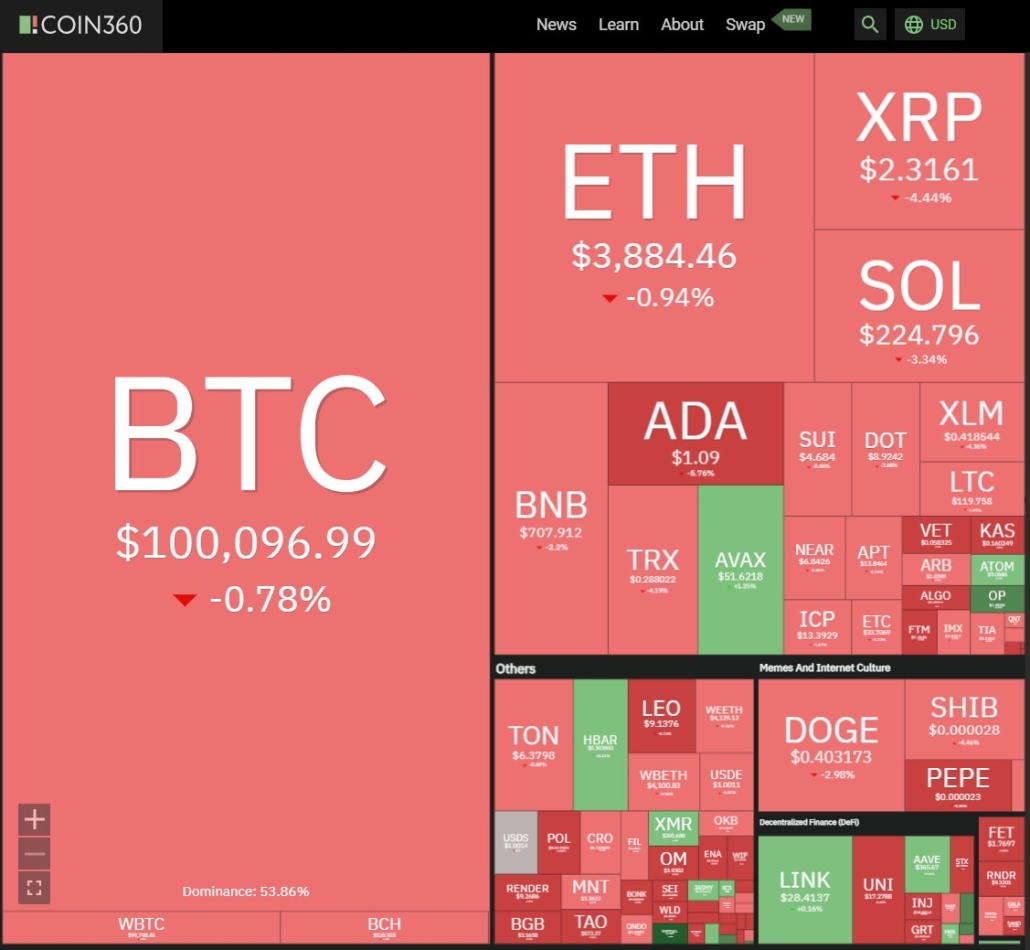
On the Coin360 platform, major cryptocurrencies are displayed as dynamic blocks, with their size proportional to their market share.
What Does the Bitcoin Dominance Chart Indicate?
The Bitcoin dominance chart shows the share of the cryptocurrency market held by BTC, usually ranging from 30% to 60% (though this could change in the future).
It reflects the investment attractiveness of Bitcoin in the current market conditions. To fully understand the situation, a deeper analysis of fundamental factors is necessary. It is important to remember that the Bitcoin dominance chart does NOT offer “magic” signals with a 100% profit guarantee.
Conclusion
Bitcoin’s market share typically fluctuates between 40% and 60%.
Pros of Analyzing Bitcoin Dominance:
✔ Market sentiment indicator. It reflects investor preferences in choosing between Bitcoin and altcoins.
✔ Simplicity and clarity. It provides a clear visual representation of Bitcoin’s market share.
✔ Trend identification. It helps identify altcoin activity cycles and signals a shift in the market’s phase.
✔ Versatility. It enables you to analyze the dominance of other assets like ETH, USDT, DOGE, and more.
Cons of Analyzing Bitcoin Dominance:
✘ Interpretation Challenges. To form a well-grounded opinion on Bitcoin dominance changes, one must deeply understand the fundamental factors and their impact on market sentiment.
✘ Limited predictive value. Bitcoin’s market share is a more reliable indicator of the current market state than its future direction.
Before risking real capital, ensure that analyzing Bitcoin dominance truly increases your chances of success. Use the ATAS platform to trade Bitcoin dominance futures — here you will find professional volume analysis tools, such as cluster charts, Delta indicator, market profiles, and more, giving you an edge over other traders.
Download ATAS. Once you install the platform, you will automatically get the free START plan, which includes cryptocurrency trading and basic features. You can use this plan for as long as you like before deciding to upgrade to a more advanced plan for additional ATAS tools. You can also activate the Free Trial at any time, giving you 14 days of full access to all the platform’s features. This trial allows you to explore the benefits of higher-tier plans and make a well-informed purchasing decision.
Do not miss the next article on our blog. Subscribe to our YouTube channel, follow us on Facebook, Instagram, Telegram or X, where we publish the latest ATAS news. Share life hacks and seek advice from other traders in the Telegram group @ATAS_Discussions or on Discord.
Information in this article cannot be perceived as a call for investing or buying/selling of any asset on the exchange. All situations, discussed in the article, are provided with the purpose of getting acquainted with the functionality and advantages of the ATAS platform.