
Smart money in trading. What is it?
The term smart money comes from gambling – casinos, horse racing, and sports. This name was given to people who won money so consistently that it could not be explained simply by luck. Later on, the concept of smart money started being used in the startup community, venture capital investing, and trading. In the trading community, smart money refers to large institutional investors and funds that possess significant resources and professional analytical capabilities. These players can access valuable information, analytical reports, and instruments that provide an advantage in making investment decisions. Smart money includes significant pension funds, investment companies, central and commercial banks, hedge funds, and other stock market professionals. In trading, the term smart money usually refers not to a specific professional market participant but rather to the collective strength they possess. It is assumed that each professional acts independently of others – sometimes, their actions synchronize, and occasionally prominent players compete, trying to outsmart each other. In trading, smart money often uses advanced technologies and algorithms for data analysis, market modeling, and automation, including high-frequency trading and/or arbitrage.Due to large volumes of trades, smart money can influence the market. Their actions have a significant impact on asset prices and market trends.
How to spot traces of smart money on the stock chart?
The ideas below are based on years of market observation. They are applicable for trading stocks, futures, and cryptocurrencies. Warning! No method can guarantee a 100% profit. You should make investment decisions based on your ability to interpret charts; only you are responsible for your assets.Tip 1. Stay informed about the news
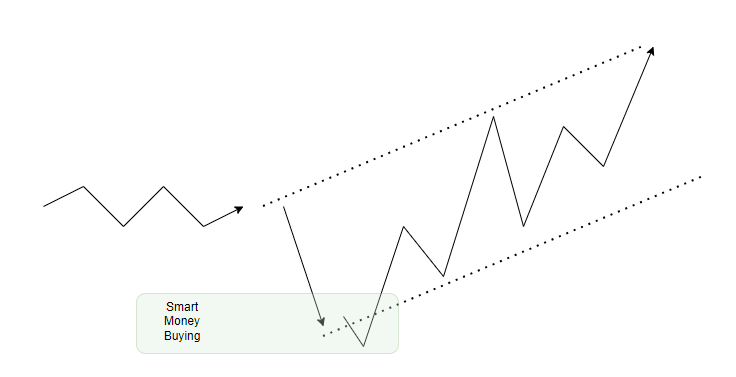
The smart money has an emotional edge over retail traders, who are subject to fear and greed. Warren Buffett expressed this idea concisely:“Buy when everyone around is fearful. Sell when everyone is greedy!”If smart money wants to buy on the eve of an uptrend, it will be interested in buying at a lower price. Therefore, before that, you usually see a downward movement on the chart (often accompanied by negative news), indicating the width of the subsequent upward channel. Perhaps smart money deliberately fuels panic to accumulate a more significant amount of exchange assets before a period of rising prices. Below is a schematic representation of this concept.
Example. Chart from the bitcoin market, 2021
In the autumn of 2021, the price of Bitcoin surpassed the psychological level of $60,000 per coin amid news of Coinbase’s stock listing on the Nasdaq exchange. Analysts were discussing the potential timing of Bitcoin reaching the $100,000 mark, while smart money seemed to be strategically selling off their positions (closing longs and opening shorts), taking advantage of the hype surrounding Bitcoin’s price breaking the significant milestone.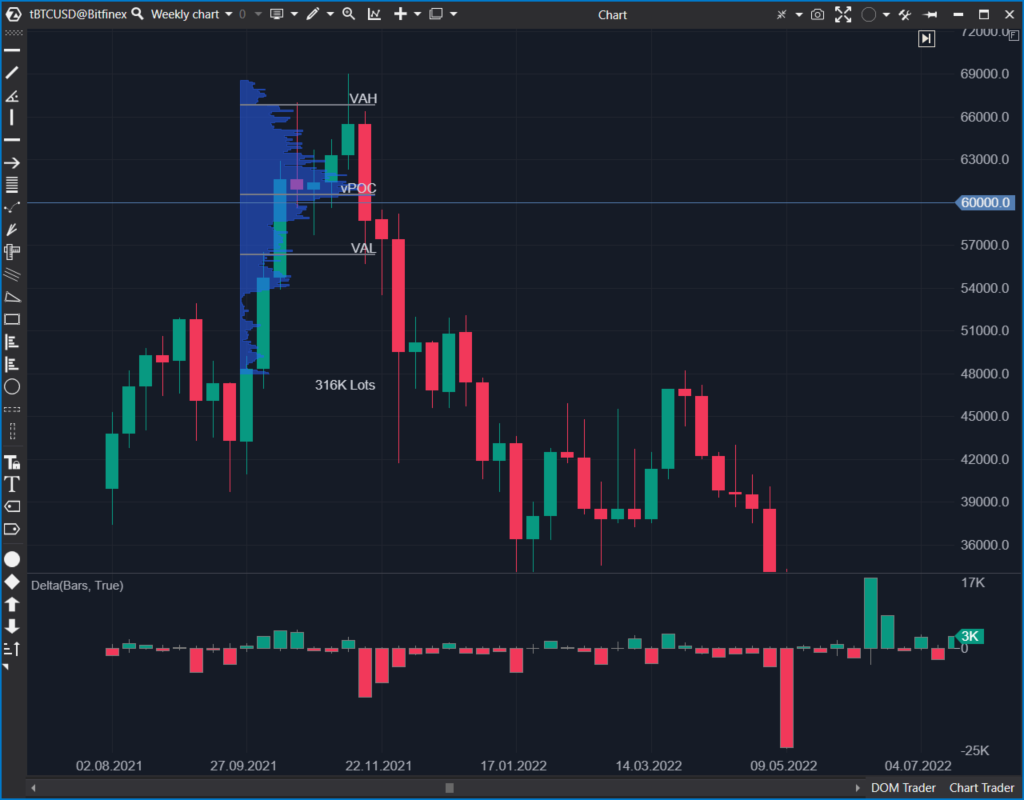
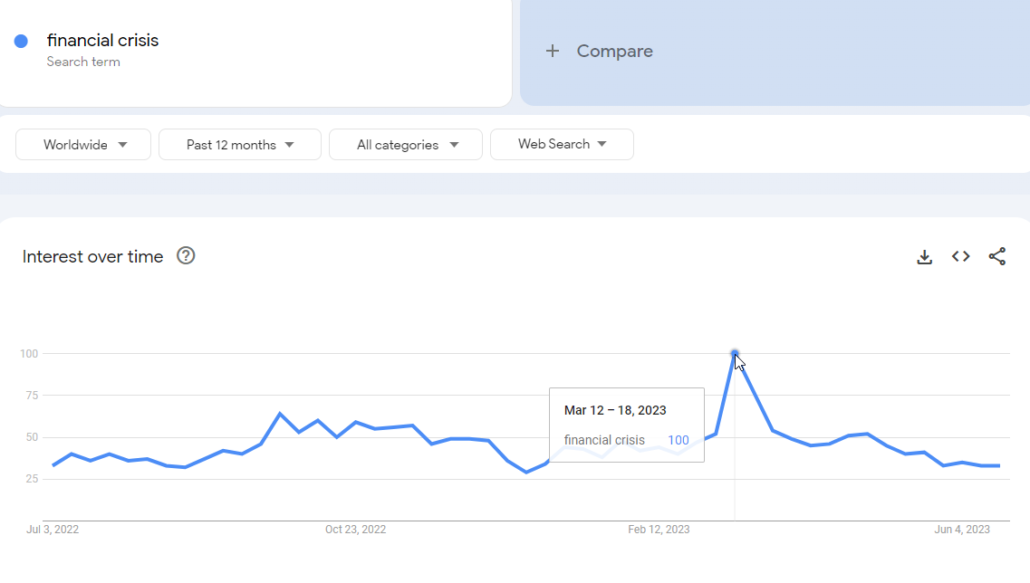
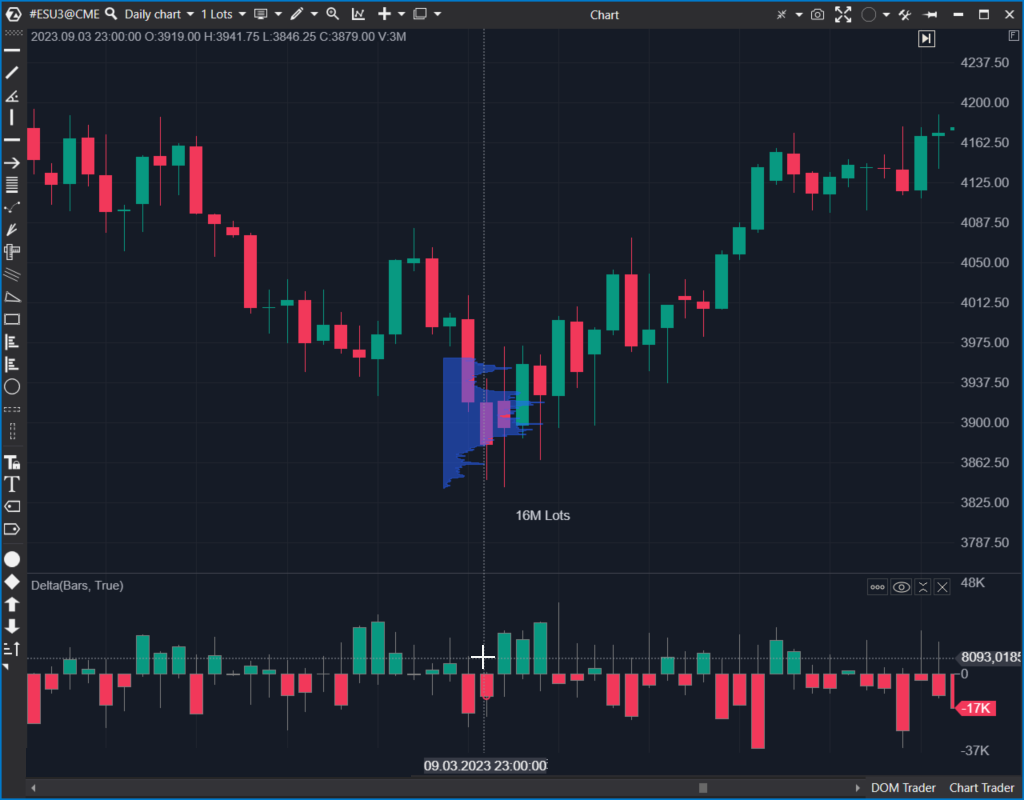
Example. The E-mini S&P-500 market and the banking crisis
In March 2023, financial market participants were greatly concerned about the bankruptcy of Silicon Valley Bank, SilverGate, and others. This is displayed on the Google Trends chart.
Let’s turn to the E-mini S&P-500 chart. It can be assumed that this period coincided with a significant market low.
Example. The situation on the British pound market
Liz Truss was the shortest-serving Prime Minister in the history of the United Kingdom. Her tax reform created a lot of controversy, and as a result, Truss resigned, which helped stabilize the markets. The chart clearly shows a two-day panic when the price dropped to the lower border of the parallel channel and then bounced off it.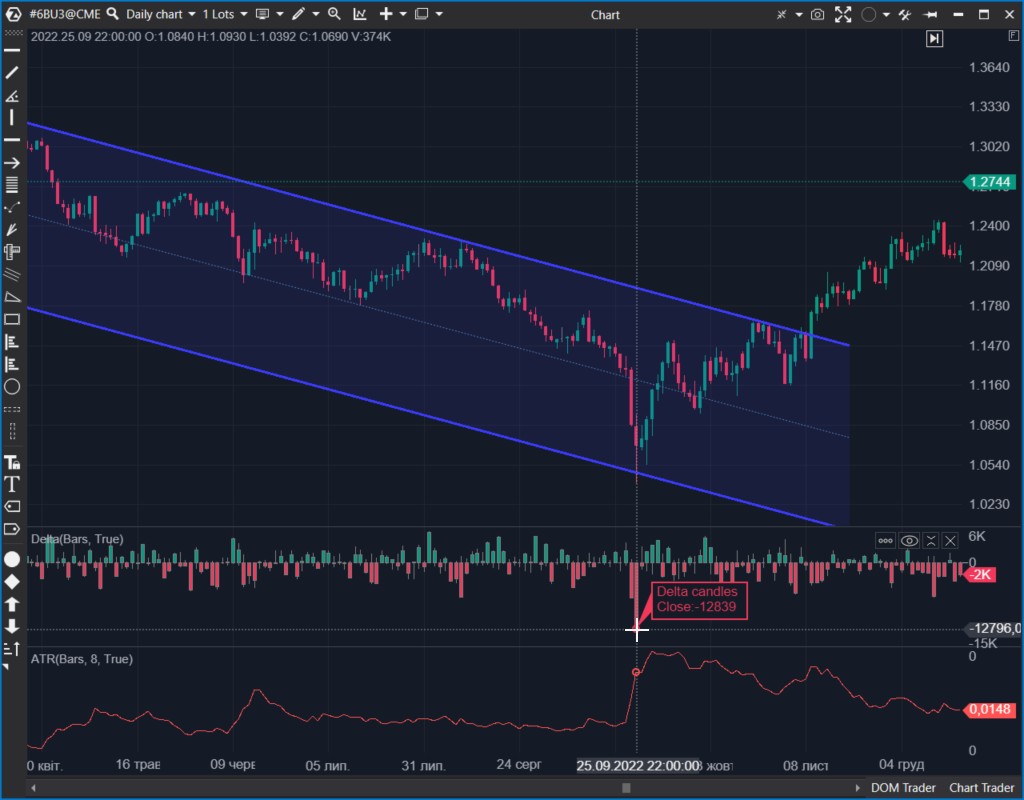
Once again, the change in delta readings suggests that smart money initially encountered panic market selling through limit buy orders. When the panic subsided, they started buying at market price.
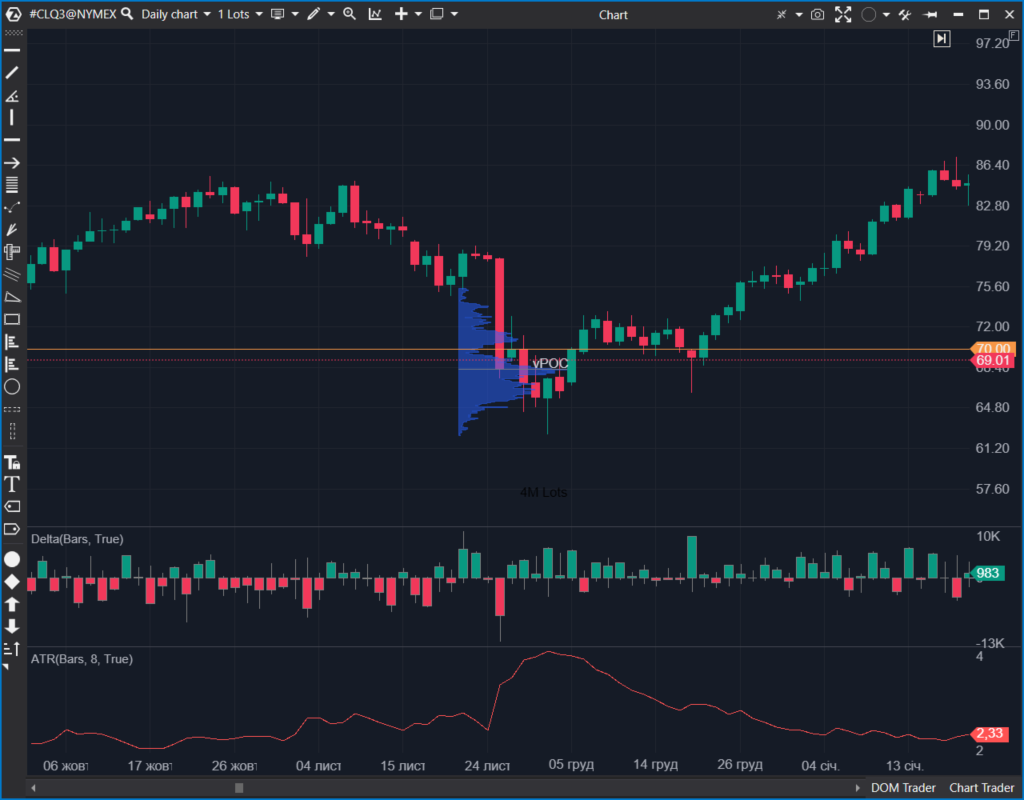
Tip 3. Track COT reports
COT reports are publications that disclose the positions of prominent market participants. These reports help reduce the risks of market crashes and provide valuable insights into the long-term perspectives of prominent players (smart money). The data is displayed in a user-friendly format in the ATAS platform through the COT report indicator.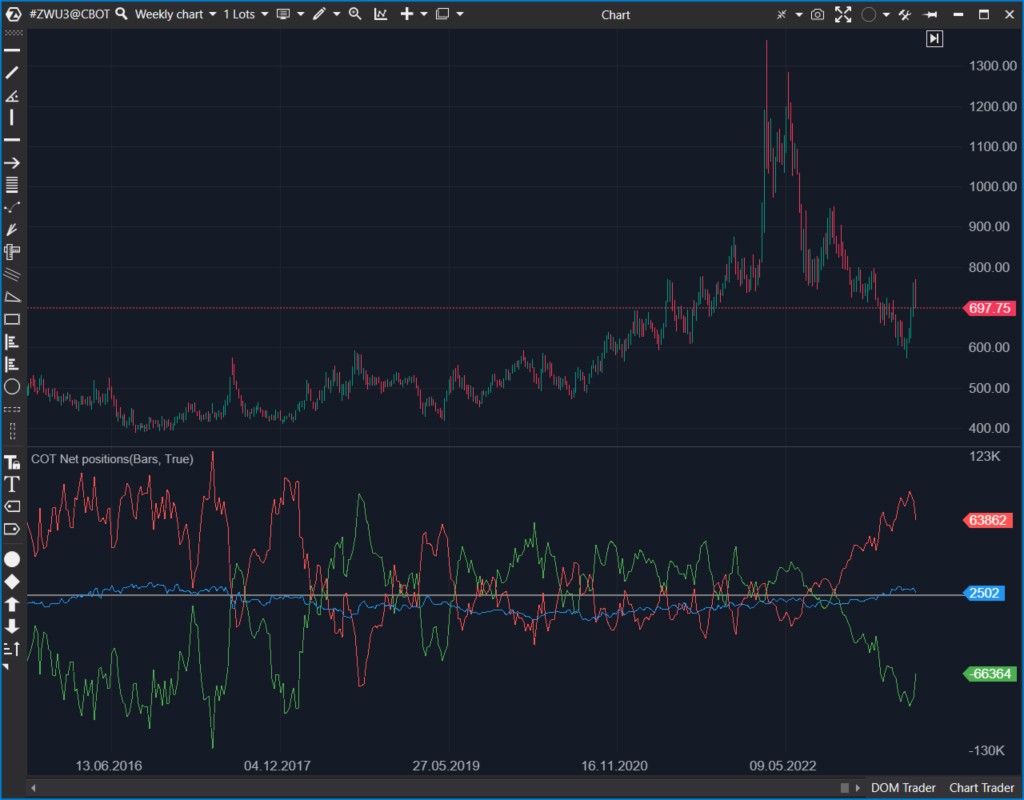
Tip 4. Track the volume indicators
Volume indicators are the most obvious instruments for tracking the activity of large players. COT reports and other mentioned sources of information can be delayed, while indicators such as Big Trades and Heat Map in the ATAS platform allow tracking smart players intraday in real-time (requires connection to the exchange data feed).Example. LTCUSD market
The 5-minute chart below shows the intraday situation. The Big Trades indicator has been added to the chart and the DOM Trader module, which includes a heat map.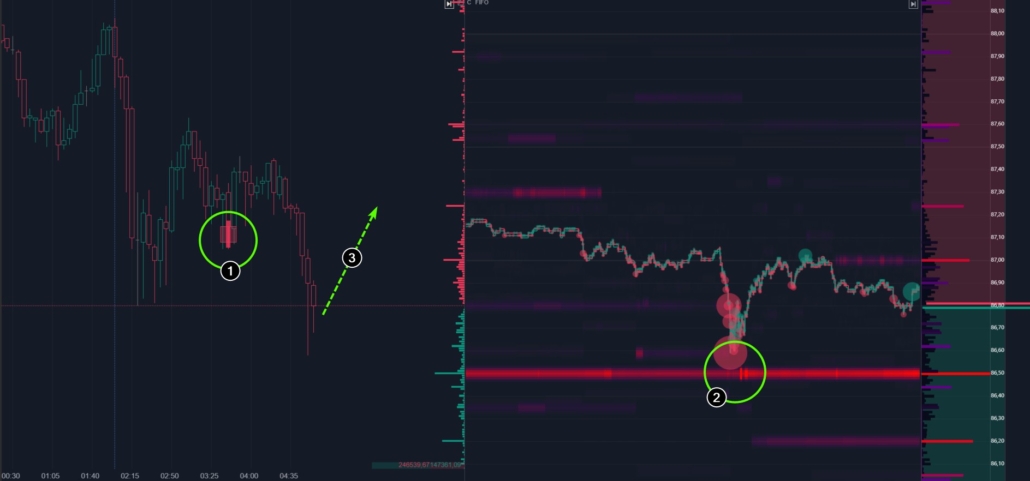
Example. The gold market prior to the speeches of central bank governors
The chart below is similar to the previous one, but from the gold market.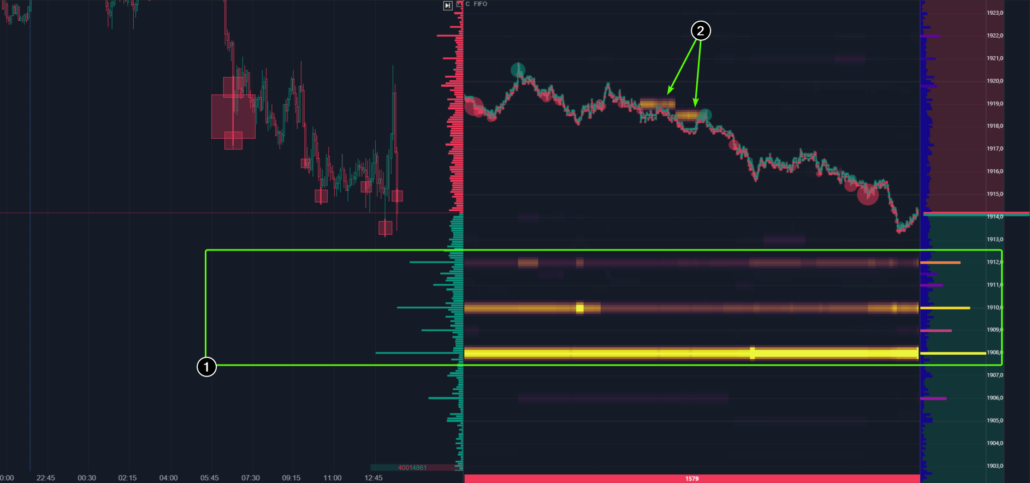
- Instruments for searching for smart money in the ATAS platform
- Useful features of the Big Trades indicator
- What is the difference between Big Trades and Cluster Search?
Conclusions
The term smart money refers to professional market participants who possess substantial resources, have access to information, utilize advanced technologies, and employ sophisticated strategies for trading in the market. They are smart since they convert their advantages into market success, which includes capitalizing on the funds traded by the mass of retail traders. Meanwhile, smart money consistently addresses handling large volumes by seeking counterparty liquidity to establish their positions. To enhance your trading skills, we recommend paying proper attention to studying the behavior of smart money. ATAS provides powerful and user-friendly instruments for tracking large volumes to make the task easier. The goal is to understand the behavior of smart money and trade in alignment with their intentions. You can practice interpreting the actions of large players using the Market Replay simulator in the ATAS platform. Download Free Trial ATAS. It is free. During the trial period, you will have full access to the platform’s instruments to evaluate them thoroughly and make a decision about further purchases. Moreover, you can continue using the program for free even after the 14-day trial period, but only for cryptocurrency trading. The ATAS platform:- enables you to download tick history from the futures, stocks, and crypto markets so that you can get a detailed picture of the market;
- provides many benefits for traders who combine bounce trading with easy cluster charts and valuable indicators.
Information in this article cannot be perceived as a call for investing or buying/selling of any asset on the exchange. All situations, discussed in the article, are provided with the purpose of getting acquainted with the functionality and advantages of the ATAS platform.


