Every profession speaks its own language — and trading is no exception. Behind every chart, order, and market headline lies a layer of trading terminology that can feel like a foreign language to anyone new to the markets. That’s exactly why we built this glossary: a clear, practical breakdown of the trading terms and trading vocabulary you’ll come across as a stock market trader — from the fundamentals to the exchange slang seasoned traders use without a second thought.
Whether you’re just getting started or brushing up on trading terms for beginners, think of this glossary as your reference point for speaking the market’s language with confidence.
A
Absorption
A scenario in which there is disproportionately high trading volume near the high or low of a bar with no or little price movement beyond that level. Selling absorption occurs when market “aggressive” selling collides with limit “passive” buying, which absorbs the selling side’s supply. A buying absorption occurs when market “aggressive” buying collides with limit “passive” selling, which absorbs the buying side’s demand.
Account Statement (Account Statistics)
A list of information about the trader’s transactions for a certain period of time and the current state of the account.
Accumulation
A market phase in which a large participant gradually builds a long position, usually without allowing price to rise too quickly. Traders look for accumulation through increased volume, absorption, and repeated defence of a support area.
Acquisition
A corporate transaction in which one company purchases a controlling or full ownership stake in another. Acquisitions are major market events that typically move the share prices of both the acquirer and the target, and can reshape entire industry sectors.
Active Managers
Investment professionals who actively select and trade securities within a fund with the explicit objective of outperforming a market benchmark. Their performance is measured against an index, and their fees are typically higher than those of passive funds.
ADR (American Depositary Receipt)
A certificate issued by a US bank that represents shares in a foreign company and trades on American exchanges in US dollars. ADRs give US investors convenient access to non-US stocks without dealing with foreign exchanges, currencies, or settlement systems directly.
Aggregate Demand
The total demand for all goods and services in an economy at a given price level and time. It is the sum of consumer spending, business investment, government expenditure, and net exports. Rising aggregate demand generally supports corporate earnings and asset prices.
Aggregate Supply
The total output of goods and services that producers in an economy are willing and able to provide at various price levels. Together with aggregate demand, it determines an economy’s equilibrium output and price level.
Alerts
Directions for executing a trade on the exchange. There could be paid-for and free signals. They are designed for beginner traders or those who have no time to monitor and analyze the market. A signal example is to buy EURUSD now with YY stop and ZZ goal.
Algo-trader
A market participant who makes (or tries to make) money using algorithms and automatic (semi-automatic) robots.
All or None (AON)
An order instruction requiring that the full quantity be executed in a single transaction or not at all, with no partial fills permitted. Unlike fill-or-kill, an AON order can remain open across the session until it can be filled completely.
Alligator Indicator
A trend-identifying tool developed by Bill Williams using three smoothed moving averages (the ‘jaw’, ‘teeth’, and ‘lips’) to show whether a market is trending or ranging. When the lines intertwine the market is sleeping (ranging); when they separate, a trend is underway.
Alpha
A measure of an investment’s return above or below what would be expected given its level of market risk (beta). Positive alpha means the investment outperformed its benchmark on a risk-adjusted basis; negative alpha signals underperformance. Alpha is the key metric for evaluating active manager skill.
Analytics
A list of analytical information that can be used as a reference when playing on the stock exchange. This block includes world macroeconomic news and expert forecasts.
Annual General Meeting (AGM)
A compulsory yearly meeting between a company’s management and its shareholders. At the AGM, directors present financial results, shareholders vote on resolutions such as dividend approvals and board elections, and major strategic decisions may be discussed.
Annual Report
A yearly document that public companies provide to shareholders summarising operations, strategy, and financial condition over the past year. More narrative and presentational than the regulatory 10-K, it is aimed at communicating with investors.
Annualised Return
An investment’s gain or loss expressed as an equivalent yearly rate, regardless of the actual holding period. Annualising returns allows direct performance comparisons across investments held for different lengths of time.
Appreciation
A situation in which an increase in the value of one currency is expressed in another currency.
Arbitrage
A trading strategy for profiting from the price difference in similar markets. A classic example is when arbitrage traders on the Chicago Exchange immediately post buy orders after they learn that gold has started moving up on the New York Exchange.
Ask (Offer / Ask Price)
The lowest price a seller is currently willing to accept for a security, and the sell order placed at that level — also called the offer. A trader can post at the ask and wait for a buyer, or buy immediately by lifting the ask. The ask is always higher than the bid; the gap between them is the spread.
Asset Allocation
An investment strategy of dividing a portfolio among asset classes such as stocks, bonds, and cash according to goals, risk tolerance, and time horizon. Allocation is a primary driver of long-term portfolio risk and return.
Asset Classes
Broad categories of financial instruments that share similar characteristics, exhibit comparable behaviour in the marketplace, and are governed by similar regulations. The main asset classes are equities, fixed income, commodities, real estate, currencies, and cash equivalents.
Assets
Resources owned or controlled by an individual or organisation that have economic value and are expected to generate future benefits. Financial assets include cash, stocks, bonds, and derivatives; physical assets include property and equipment.
Assignment (Options)
The process by which an option seller (writer) is obligated to fulfil the contract because the buyer has exercised their right. For every exercised option there is a corresponding writer who must deliver or take delivery of the underlying.
At the Money (ATM)
An options term for a situation in which the option’s strike price is equal — or very close — to the current market price of the underlying asset. ATM options have no intrinsic value and consist entirely of time value.
Auction Market
A trading mechanism in which buyers and sellers submit competing bids and offers simultaneously, with transactions executed when matching prices are found. Stock exchanges such as the NYSE operate as continuous auction markets during regular trading hours.
Auction Market Theory
A framework viewing markets as a continuous two-way auction in which price moves to facilitate trade between buyers and sellers. It underpins market-profile analysis and the interpretation of value areas.
Auditor
An independent professional legally required to examine and attest that a company’s financial statements are true, fair, and prepared in accordance with applicable accounting standards. Auditor sign-off lends credibility to the figures investors rely on.
Automated Trading System (ATS)
An algorithm for trading on the exchange without applying subjective decisions. It is usually a clear-cut automated trading strategy developed for robots.
Average True Range (ATR)
A volatility indicator that measures the average size of a security’s price range over a set number of periods, including any gaps. ATR quantifies how much an asset typically moves, helping traders calibrate stop-loss distances and position sizing to current volatility.
Averaging
Adding funds to an already open position. As a rule, these are actions according to the Martingale method: for example, if you have an unprofitable purchase for 1 lot, and the price went lower – to average out, you need to buy 2 lots even cheaper and get back at the subsequent growth. And if the price goes even lower – buy 4. This strategy often leads to a deposit drain.
B
Balance Sheet
A core financial statement presenting a company’s assets, liabilities, and shareholders’ equity at a single point in time. It offers a snapshot of what a company owns and owes, and is one of the three primary statements in fundamental analysis.
Bar Chart
A method of displaying the price dynamics for a certain period of time. Every bar is displayed as a vertical line segment with two marks. The marks mean the opening and closing prices and the low and high of an exchange asset for a selected period of time (time frame).

Base Currency
The main currency that is in the first place in a currency pair. Its value relative to the second currency needs to be predicted. In the popular EUR/USD pair, the base currency will be the euro—you need to predict how its value will change relative to the dollar. However, in many currency pairs, the USD is the base currency.
Base Rate
The benchmark interest rate set by a country’s central bank, which forms the floor for borrowing and lending rates across the entire financial system. Changes to the base rate ripple through mortgage rates, corporate loans, savings accounts, and foreign exchange markets.
Basis Point (BPS)
A unit equal to one-hundredth of one percent (0.01%), used to express precise changes in interest rates, yields, and fees. A move from 3.50% to 3.75% is a 25-basis-point increase.
Bear
A market participant (in the wide sense—any seller) who sets his mind on the price decrease. He either has a short position (already sold) or intends to open it, planning to profit from a possible price decrease.
Bear Trap
A false bearish breakdown that lures sellers below a support level before price sharply reverses upward, trapping short sellers. Recognising bear traps helps avoid premature short entries.
Bearish Engulfing
A bearish reversal candlestick pattern in which a strong down candle engulfs the body of the previous up candle. It often appears after an advance and suggests that sellers have taken control from buyers.
Bearish Market
One in which sellers dominate. Its characteristic feature is the down tendency when supply exceeds demand.
Beta
A measure of a security’s volatility relative to the overall market. A beta of 1 moves in line with the market; above 1 indicates greater volatility and risk; below 1 indicates lower volatility. Beta is a key input in risk assessment and the alpha calculation.
Bid (Bid Price)
The highest price a buyer is currently willing to pay for a security, and the buy order placed at that level. A trader can join the bid and wait for a seller to fill them, or sell immediately by hitting an existing bid. The bid is always lower than the ask.
Binary Options
A speculative instrument in which a trader bets on whether an asset’s price will be above or below a set level at a specific time, with a fixed payout or total loss. Highly unregulated and banned in many jurisdictions, binary options resemble wagering more than conventional trading.
Bitcoin Dominance
The percentage of the total cryptocurrency market capitalisation held by Bitcoin. Traders track it to gauge whether capital is rotating between Bitcoin and altcoins.
Blue Chips
Stocks of famous companies with excellent reputations. Usually, they have a long history and regularly pay dividends. The ‘blue chip’ exchange term came from the poker card game, where the blue chip has the highest value.
Bollinger Bands
A volatility indicator consisting of a central simple moving average flanked by two bands set at a configurable number of standard deviations above and below it. When price touches the upper band, the asset may be overbought; a touch of the lower band may signal oversold conditions. Contracting bands suggest low volatility; expanding bands signal increasing volatility.
Bond
A debt security that is traded on the exchange. Its owner has the right to get its face value from the issuer in cash or in the form of another asset. Bonds have maturity and interest.
Bond Premium
The amount by which a bond trades or is issued above its par value, typically because its coupon rate exceeds prevailing market interest rates. A bond bought at a premium yields less than its coupon when held to maturity.
Book Value
The net worth of a company as recorded on its balance sheet, equal to total assets minus total liabilities. Book value per share is calculated by dividing that figure by shares outstanding and is compared with the market price to assess whether a stock trades at a premium or discount to its accounting value.
Bookrunner
The lead underwriter or principal coordinator managing a securities issuance such as an IPO or bond offering. The bookrunner builds the order book, allocates shares to investors, and steers the overall deal.
Bottom Line
The net profit or net income figure at the foot of a company’s income statement, arrived at after all revenues, costs, interest, and taxes have been accounted for. Consistent growth in the bottom line signals improving profitability.
Bounce
A price rebound that usually occurs after the market touches a support level or an oversold area. It can be a temporary reaction inside a downtrend or the start of a larger recovery.
Breakeven
The price level at which the available profit on an open position will equal zero. The breakeven level prevents a trade from going into negative territory.
Break of Structure (BOS)
A market-structure event in which price breaks a previous significant swing high or swing low in the direction of the prevailing trend. In Smart Money Concept analysis, BOS is used to confirm trend continuation and identify where liquidity has been taken.
Breakout
A sharp change in the rate of a quote when the “bottom” (the lowest value of an asset) or “top” (the highest value) is broken.
Brent Crude
The leading international benchmark price for crude oil, sourced from North Sea oilfields. Brent Crude underpins the pricing of roughly two-thirds of the world’s traded oil and is a critical reference for energy sector analysis, inflation expectations, and commodity trading.
Broker (Brokerage Office)
An intermediary between the exchange and the customer. This intermediary is authorized to execute the orders received from customers on the exchange and take a commission for the services rendered.
Broker-Dealer
A firm that both executes securities trades on behalf of clients (the broker role) and trades for its own account (the dealer role). US regulators classify most brokerage firms as broker-dealers because they perform both functions.
Brokerage Account
A taxable investment account opened with a brokerage firm that allows the holder to buy and sell stocks, bonds, ETFs, mutual funds, and other securities. It is the primary gateway through which most investors access the markets.
Bull
A market participant who expects prices to rise and acts from the buying side. Bulls open long positions or hold existing assets in anticipation of further growth.
Bull Trap
A false bullish breakout that lures buyers above a resistance level before price sharply reverses downward, trapping them in losing long positions. It is a common shakeout used to capture liquidity.
Bullish Engulfing
A bullish reversal candlestick pattern in which a strong up candle engulfs the body of the previous down candle. It often appears after a decline and suggests that buyers have taken control from sellers.
Bullish Market
A market environment in which buyers dominate and prices tend to move upward. It is usually marked by higher highs, higher lows, and positive investor sentiment.
Buy
A transaction in which a trader purchases an exchange-traded asset. Buying opens a long position or closes an existing short position.
Buying Power
The total capital available to a trader for opening positions, equal to the cash balance plus any margin extended by the broker. Under 4x leverage, a $100,000 cash balance provides $400,000 of buying power; each open position consumes from this total.
C
Cable
Forex trading slang for the GBP/USD currency pair. The nickname dates to the mid-19th century, when the sterling–dollar exchange rate was transmitted between London and New York via a transatlantic telegraph cable.
Calls (Call Options)
Options contracts giving the holder the right, but not the obligation, to buy an underlying asset at a fixed strike price before expiry. Traders buy calls to profit from a rising price or to hedge, and sell (write) them to earn premium income.
Candlestick Chart (Japanese Candles)
A chart type — originating centuries ago with Japanese rice traders — in which each candle displays the open, high, low, and close for a period. The shape of the body and wicks conveys market sentiment at a glance, making it the most widely used chart format among active traders.
Capital Expenditure (CapEx)
Money spent by a company to acquire, build, or improve long-term physical or intangible assets, such as machinery, buildings, or software. CapEx is a key driver of free cash flow and signals whether a company is investing in future growth.
Capital Gain
The profit realised when an asset is sold for more than its purchase price. Gains are ‘realised’ upon sale and may trigger tax; before sale they are ‘unrealised’, reflecting a paper increase in value that has not yet been crystallised.
Capital Gains Tax (CGT)
A tax on the profit realised when a capital asset — such as shares, bonds, or property — is sold for more than its original purchase price. The applicable rate and rules vary by country and holding period, and must be factored into net return calculations.
Capital Loss
The loss realised when an investment is sold for less than its purchase price. Capital losses can offset capital gains and, within limits, ordinary income for tax purposes, with unused losses often carried forward.
Capitalization
The joint-stock company value calculated by the price of its stock. The company capitalization is the number of stocks multiplied by the current stock value.
Cash
The money in hand. Usually, it means free capital available for exchange operations.
Cash Account
A brokerage account in which trades must be funded entirely by settled cash, with no borrowing. Proceeds from a sale are subject to a settlement delay (currently T+1) before they can be reused, limiting trade frequency but avoiding margin risk.
Cash Flow Statement
A financial statement detailing all cash moving into and out of a business over a period, broken into operating, investing, and financing activities. It reveals a company’s true liquidity and cash-generating ability, which can differ markedly from reported profit.
Catching The Loss
Closing a losing position after the stop-loss level has been reached or the trade idea has failed. In practice, it means accepting the loss instead of waiting for the market to return.
Certificate of Deposit (CD)
A time deposit issued by a bank that pays a fixed rate of interest over a set term and returns the principal on a stated maturity date. CDs are low-risk, typically insured, and trade liquidity for a guaranteed return.
Change of Character (ChoCh)
A shift in market structure signalling that the prevailing trend may be reversing, identified when price breaks a key swing point against the trend. ChoCh is a core signal in smart-money and ICT analysis.
Channel
A range (or area in the chart), which is limited to two parallel lines within which the price movement (trend) takes place. They also say ‘a trend channel’. Channels could be ascending (bullish trend) and descending (bearish trend).
Chart Patterns
Shapes (for example, ‘triangle’, ‘wedge’, ‘flag’, etc.) formed in the price chart. They are formed with lines. Such patterns make it easier to understand the market situation and allow the building of a further action plan in different scenarios.
Chart Time Frame
The duration each candle, bar, or data point on a chart represents — such as 1-minute, 5-minute, hourly, or daily. Traders combine multiple time frames: shorter ones for precise entries and longer ones to gauge the broader trend.
Chartist
A trader or analyst who relies primarily on historical price chart patterns and formations — rather than company fundamentals — to make trading decisions, operating on the belief that price action encodes all relevant market information.
Circuit Breaker Halt
An exchange-imposed trading pause triggered when a security or index moves too sharply within a short window, designed to curb panic and restore orderly trading. Halts can last from minutes to days, during which no trading in the affected security is permitted.
Close the position / close the trade / close
An action when the previously bought stocks are sold (long) or previously sold stocks are bought (short). When the position is closed, securities are exchanged into money (‘exit into cash’).
Closing Price
The last price at which a security trades during a regular exchange session. Closing prices serve as the daily reference point for performance measurement, technical analysis calculations, and identifying overnight price gaps at the next open.
Cluster
A set of cells with important information. Each price level has its own cell at a certain time period. A trader can see in a cluster what took place inside a bar. It means that each cluster has data about the volume for each price level apart from 4 standard points – High, Low, Close, and Open. It is important to understand that traders see market orders executed by means of limit orders in the clusters.
Cluster Analysis
Studying clusters within candles to assess the course of exchange trading in the past and forecast the future. The numbers represent volumes in trades that were made at each price while the candle was forming. Two numbers form one cluster, where the first one indicates the volume of a sell trade and the second one of a buy trade. See Footprint.
Cognitive Bias
A systematic pattern of deviation from rational judgement, arising from mental shortcuts the brain uses to make quick decisions. In trading, biases such as overconfidence or loss aversion can lead to costly irrational decisions, making awareness of them important for discipline.
Commission
Remuneration which the broker takes from the trader for providing intermediary services.
Commodity
A standardised raw material or primary good — such as crude oil, gold, natural gas, wheat, or copper — that is interchangeable with other goods of the same grade and actively traded on specialised exchanges. Commodity prices are driven by global supply-and-demand dynamics.
Common Stock
The standard form of company ownership, granting holders voting rights on corporate matters and eligibility for dividends if declared. Common stockholders rank behind bondholders and preferred shareholders in a liquidation. Also called ordinary shares or equity securities.
Composite Man
A collective name for major market players. Wyckoff used the term “composite operator.” He attracts the public to buy assets in which he has already accumulated a significant number of shares, making many transactions, creating the appearance of a “broad market”.
Compound Interest
Interest calculated on both the initial principal and all previously accumulated interest. Unlike simple interest, compounding causes returns to grow exponentially over time and is the mechanism behind long-term wealth accumulation in savings and investment accounts.
Confirmation
An oral or written notification by the broker to the trader that his/her trade has been completed. If the broker is electronic, confirmation is usually made by means of a pop-up window at the exact time of closing the deal.
Consolidation (sideways motion)
A suspension of the trend price motion. The market ‘calms down,’ and the price forms fluctuations that stay within the range on the chart. Moreover, it is usually accompanied by a decrease in volatility and trading volume.
Consumer Price Index (CPI – detailed)
A US Labor Department measure of the average change over time in the prices of a basket of consumer goods and services, including food, energy, housing, and medical care. CPI is a primary inflation gauge influencing policy and markets.
Contango and Backwardation
Contango describes a market where the futures price of an asset is higher than its expected future spot price — typical in markets with storage costs or no near-term supply shortage. Backwardation is the opposite: futures prices sit below the current spot price, often reflecting tight near-term supply or high carry demand. Both conditions affect rolling costs for futures traders.
Contracts for Difference (CFD)
A derivative agreement between a trader and a broker to exchange the difference in the price of an asset from the moment the contract is opened to when it is closed. CFDs provide leveraged exposure to equities, indices, currencies, and commodities without requiring ownership of the underlying asset.
Convergence
The futures contract price movement to the underlying instrument spot price as the expiration date comes nearer. It means that the futures price and underlying asset price will be nearly equal on the futures contract expiration date. In case there is no convergence, a prospect for arbitrage emerges.
Convexity
A measure of the curvature in the relationship between a bond’s price and interest rates, supplementing duration analysis. Bonds with higher convexity experience smaller price declines when rates rise and larger price gains when rates fall, making convexity a valuable property in fixed income portfolio management.
Coppock Curve
A momentum indicator originally designed to identify long-term buying opportunities in equity indices, based on smoothed rate-of-change calculations. A turn upward from below zero is read as a bullish signal.
Correction (Rollback)
A price movement directed into the opposite side from the main or prevailing price movement. As a rule, rollbacks are accompanied by the volume (trading activity) reduction. Correction, as a rule, is a counter-trend of a smaller scale within the main trend of a larger scale.
Correlation
A statistical measure of how two assets move in relation to one another, ranging from +1 (perfectly aligned) through 0 (no relationship) to −1 (perfectly opposite). Traders use correlation to construct diversified portfolios and to identify hedging relationships.
Cost Average (Average Cost)
The mean price paid across all the shares accumulated in a position, calculated by dividing total cost by total shares held. When additional shares are bought at a different price, the cost average shifts accordingly and becomes the breakeven reference for the position.
Cost Basis
The original amount paid to acquire an investment, including commissions, used as the reference point for calculating capital gains or losses when the asset is sold. It differs from the asset’s current market value.
Cost of Carry
The total expense of holding a financial position over time, encompassing financing costs, storage fees for physical commodities, dividends, and opportunity cost. Cost of carry is embedded in futures pricing and significantly affects the economics of longer-term leveraged positions.
COT Report (Commitments of Traders)
A weekly US regulatory report breaking down the positioning of different trader groups in futures markets. Traders use it to gauge how commercials and large speculators are positioned.
Covered Call
An options strategy where the holder of a long position in a security simultaneously sells (writes) a call option on the same security. The strategy generates premium income and partially offsets downside risk, but caps the maximum gain if the asset price rises above the strike price at expiry.
Covering
The act of closing a short position by buying back the shares originally borrowed and sold. Covering can be done all at once or scaled out in increments, and is required to realise the profit or loss on a short trade.
CPI (Consumer Price Index)
A monthly statistical measure tracking price changes in a fixed basket of goods and services typically purchased by households. CPI is a primary inflation gauge and influences central bank interest rate decisions, bond yields, currency valuations, and inflation-linked instruments.
Credit Rating
An independent assessment of a borrower’s ability to repay debt obligations, issued by agencies such as S&P, Moody’s, or Fitch on a scale from top-grade (e.g. AAA) to default (D). Rating downgrades or upgrades can trigger significant price movements in bonds and equities.
Cross Rate
A currency quotation that does not include the US dollar, such as EUR/JPY or AUD/JPY. Cross rates help traders analyse relationships between two non-USD currencies directly.
Crowd
A term that generalizes a multitude of beginner and minor traders who are inclined to act emotionally.
Crypto Scam
Fraudulent schemes in the cryptocurrency space — such as rug pulls, fake exchanges, and Ponzi tokens — designed to steal investors’ funds. Awareness of common scam types is essential for crypto safety.
Cryptocurrency
A digital currency secured by cryptography and recorded on a decentralised blockchain ledger, operating without a central bank or government. Its value derives from scarcity and market perception as a store of value, medium of exchange, or inflation hedge.
Cumulative Delta
A running total of the difference between buying and selling volume (delta) over a period, showing the net pressure from aggressive market participants. Divergence between cumulative delta and price can foreshadow reversals.
Cup and Handle Pattern
A bullish continuation chart pattern resembling a rounded bottom (the cup) followed by a small downward consolidation (the handle). A breakout above the handle’s resistance typically signals continuation of the prior uptrend.
Currency Depreciation
A decline in the exchange value of one currency against another in a floating rate system, resulting from factors such as rising inflation, lower interest rates, trade deficits, or weakening investor confidence. Depreciation affects import costs, export competitiveness, and inflation.
Currency Peg
A monetary policy arrangement in which a country’s central bank ties its currency’s exchange rate to another currency or basket of currencies at a fixed rate. Pegs reduce exchange rate volatility but require large foreign reserves to defend and can create sudden sharp moves if the peg breaks.
Currency Risk
The potential for losses arising from fluctuations in exchange rates, particularly affecting companies and investors with cross-border operations or foreign-denominated assets. Unhedged currency exposure can turn an otherwise profitable position into a loss.
Current Ratio
A short-term liquidity measure calculated by dividing current assets by current liabilities. A ratio above 1 suggests the company can meet near-term obligations from available assets. Used by fundamental analysts to assess balance sheet health.
D
Dark Pool
A private trading venue where large institutional orders are matched away from public exchanges and order books, hiding size and intent until after execution. Dark pools let big players trade without moving the market, but reduce transparency and accessible liquidity for retail traders.
Day Trading (Intraday Trading)
A trading style in which all positions are opened and closed within a single session, never held overnight. Positions may last from minutes to hours, and traders following this approach are called day or intraday traders.
Days to Cover (Short Ratio)
An estimate of how many trading days it would take all short sellers to buy back their positions, calculated by dividing total short interest by average daily volume. A high days-to-cover figure signals greater short-squeeze risk because exiting would take longer.
Dead Cat Bounce
A temporary, short-lived recovery in the price of a declining asset before the downtrend resumes. The term warns traders not to mistake a brief bounce for a genuine reversal.
Dealing Center
A legal person and a non-bank office that provides services for executing trades in the international currency (Forex) and Contracts For Difference (CFD) markets. The customers of such offices are, as a rule, beginner speculators with a small trading capital. They work under conditions of margin trading and use leverage. Trades executed through a dealing center do not, as a rule, reach the official exchange.
Debentures
Unsecured long-term debt instruments issued on the basis of the issuer’s general creditworthiness rather than specific collateral. Debenture holders receive fixed periodic interest and the return of principal at maturity, but rank behind secured creditors in insolvency.
Defensive Stocks
Shares of companies whose earnings remain relatively stable across economic cycles — such as utilities, consumer staples, and healthcare. Investors rotate into defensive stocks when anticipating a slowdown, as they tend to hold value better than cyclical shares.
Deflation
A sustained decline in the general price level of goods and services across an economy. While it boosts consumer purchasing power, deflation can depress corporate revenues, discourage spending, and trigger damaging economic contraction — the opposite of inflation.
Delta (Volume Analysis)
The difference between market buy trades and market sell trades over a selected period. In volume analysis, delta helps show which side is more aggressive at a given price level.
Demo Account
A special training account for beginners who do not risk playing for real currency at once. Such a demo account helps to develop a strategy and get acquainted with the interface of the electronic broker used.
Depreciation
The accounting practice of spreading the cost of a tangible fixed asset across its useful life and deducting it from taxable income. Depreciation is a non-cash expense on the income statement that reflects an asset’s gradual wear and loss of value.
Derivatives
The underlying financial instruments. For example, Apple shares (AAPL) – basic instrument, Apple shares futures (AAPL) – derivative.
Deutsche Akzien Index (DAX)
One of the most important stock indices in Europe. It reflects the state of the German economy. The DAX includes shares of the 30 largest “blue chip” companies in Germany, which form the top list of the Frankfurt Stock Exchange. Among them are Adidas, BMW, Siemens, Deutsche Bank, and others.
Developed Markets
Countries with mature, highly liquid financial markets, robust regulatory frameworks, and transparent price discovery. Examples include the United States, United Kingdom, Germany, Japan, and Australia. Developed market investments are generally considered lower-risk than emerging market equivalents.
Distribution
A market stage when a major player closes a long position at market highs, selling out a previously bought asset to the crowd.
Divergence
A difference between the price and an oscillator (indicator). A divergence is formed if the price forms a new extremum, but the indicator does not show it. It means that the trend is weakening.

Diversification
A way of reducing risks. It means “putting eggs in different baskets”. The application of diversification implies the distribution of capital between different exchange instruments. The calculation is based on the fact that profit on one asset compensates for possible losses on another.
Dividend
A part of a company’s profit, distributed among stockholders in accordance with the number and types of stocks. A stockholder’s meeting identifies the amount and order of payment of dividends. As a rule, news about a company’s dividends is succeeded by a leap in the respective stock price.
Dividend Yield
A ratio showing the annual dividend income relative to a stock’s current price, calculated by dividing the expected dividend per share by the share price. It lets investors gauge the income return of a dividend-paying stock.
Doji Candle
A candlestick in which the open and close prices are nearly equal, producing a very small body with longer upper and/or lower wicks. A doji reflects indecision and a balance between buyers and sellers, and often precedes a reversal or consolidation.
Dollar Cost Averaging (DCA)
An investing strategy of contributing a fixed sum at regular intervals regardless of price, so that more shares are bought when prices are low and fewer when high. Over time this smooths out the average purchase price and reduces the impact of short-term volatility. More common among investors than day traders.
DOM / Depth of Market / Order Book
A queue of orders in the stock exchange terminal, where existing, placed orders from exchange traders are visible.

Double Top / Double Bottom
Reversal chart patterns formed by two consecutive peaks (double top) or two troughs (double bottom) at a similar price level. A double top signals a bearish reversal after an uptrend; a double bottom signals a bullish reversal after a downtrend.
Dow Jones Industrial Average (DJIA)
A price-weighted stock index of 30 prominent US companies and one of the oldest, most widely cited equity benchmarks. Despite tracking only 30 names, the Dow is a long-standing barometer of US market sentiment.
Down-bar
A bar, the closing of which is lower than the closing of the previous bar (or than its opening).
Downtrend
A sustained price decline in which each major swing is usually lower than the previous one. Traders describe it as a sequence of lower highs and lower lows.
Drawdown
A decline in account equity or in an open position from a previous peak. It may be unrealised while the trade is still open or realised after the position is closed.
E
Earnings Per Share (EPS)
A company’s net profit divided by its total number of outstanding shares. EPS is one of the most commonly cited profitability metrics and a key input for the price-to-earnings ratio and broader stock valuation models.
EBITDA
Earnings Before Interest, Taxes, Depreciation, and Amortisation — a measure of a company’s core operating profit that strips out the effects of financing, tax strategy, and accounting choices. EBITDA is widely used to compare profitability across companies and industries.
ECB (European Central Bank)
The central bank of the Eurozone, responsible for setting monetary policy, managing the euro money supply, and maintaining price stability for the 20+ member states that use the euro. ECB interest rate decisions and quantitative easing programmes are major drivers of European and global markets.
ECN (Electronic Communication Network)
An automated system that directly matches buy and sell orders for securities, bypassing traditional market-maker intermediaries. ECNs connect traders to the wider market — often charging access fees — and enable faster execution and after-hours trading.
Elliott Wave Theory
A technical framework proposing that market prices move in repeating fractal wave patterns driven by collective investor psychology — typically five waves in the direction of the trend followed by three corrective waves. Used to anticipate future price movements.
Emerging Markets
Economies transitioning from developing to developed status, characterised by stronger growth potential alongside elevated political risk, currency volatility, and lower liquidity compared to developed markets. Major emerging markets include China, India, Brazil, and South Africa.
Engulfing Pattern
A two-candle reversal pattern in which the second candle fully covers the body of the previous candle. It signals a sharp shift in control between buyers and sellers and is usually read together with trend context, volume, and support or resistance.
Entering The Market
Opening a position by executing a buy or sell order. The entry point defines the price from which risk, stop-loss, and potential profit are calculated.
Equity
Ownership interest in an asset or company. In company finance, equity is total assets minus total liabilities — what shareholders would theoretically receive if the company were liquidated. As an asset class, equity refers to stocks and shares representing proportional ownership in businesses.
Equity Manager
A professional financier, a legal or natural person whose job it is to manage a portfolio of stocks.
ETC (Exchange-Traded Commodity)
An exchange-listed product tracking the price of a single commodity or commodity index, such as gold, silver, or oil. ETCs trade like shares but provide commodity exposure without the need for physical ownership or futures rolling by the investor.
ETP (Exchange-Traded Product)
A broad umbrella term covering all instruments listed on an exchange that track underlying assets, indices, or strategies — including ETFs (equity/bond funds), ETCs (commodities), and ETNs (notes). All ETPs offer transparent, intraday-tradeable market exposure.
Eurobond
A bond that is issued in a foreign currency. In fact, it is a debt liability, which has maturity. Long-term eurobonds are issued for a period of 40 years or more. There are also middle-term eurobonds – more than 10 years, and short-term – from 1 to 5 years.
Exchange
An organised, regulated marketplace where financial instruments — including stocks, bonds, derivatives, and commodities — are bought and sold under standardised rules. Exchanges provide price transparency, liquidity, counterparty guarantee, and regulatory oversight.
Exchange-Traded Fund (ETF)
A pooled investment fund that trades on an exchange like an ordinary share, typically tracking an index, sector, commodity, or basket of assets. ETFs combine diversification with intraday tradability and generally low fees, and can hold stocks, bonds, or commodities.
Execution
The completion of a buy or sell order in the market. Execution quality encompasses speed, price achieved relative to the quoted price, and any slippage incurred. Fast, accurate execution at competitive prices is a priority for active traders.
Exhaustion
A stage where a strong trend loses momentum as buying or selling pressure dries up, often preceding a reversal or consolidation. Exhaustion is frequently accompanied by climactic volume.
Exit Strategies
A range of actions traders take to protect their capital from losses. Since losses are inherent to the profession, developing an exit strategy involves finding, achieving, and maintaining an optimal balance where losses are offset by profits.
Expert Adviser (EA) / Trading Robot
Software for automatic trading that works independently in accordance with the previously set algorithm. Other names: expert, bot, and automatic trading system.
Expiration
The contract maturity date. It usually concerns a futures contract. On that date, obligations, settlement payments, and/or asset delivery must be executed.
Exponential Moving Average (EMA)
A type of moving average that assigns greater weight to the most recent prices, making it react faster to new price action than a simple moving average. EMAs are widely used to generate trade signals from crossovers and to track short-term trend direction.
Exposure
The total value of capital at risk in a given position or portfolio, including any magnification from leverage. Exposure can be expressed in absolute currency terms, as a percentage of total portfolio value, or in terms of notional underlying value for derivatives.
F
Fair Price
The estimated value of a stock aimed at understanding its intrinsic real value. Various fundamental approaches and volume analyses are used to calculate the fair price.
Fair Value Gap (FVG)
A price imbalance left by a rapid one-directional move, visible as a gap between candle wicks where little trading occurred. Smart-money traders expect price to often return and ‘fill’ this gap.
Falling Knife
A slang term for a security whose price is dropping rapidly and steeply. ‘Catching a falling knife’ means buying during such a decline in the hope of a rebound — a high-risk attempt to time the bottom.
Falling Wedge
A bullish chart pattern formed by two downward-sloping converging trendlines. Despite the descending shape, it typically signals weakening selling pressure and an upward breakout.
False Breakout
A move that breaches a support or resistance level but fails to hold, quickly reversing back into the prior range and trapping breakout traders. Identifying false breakouts is key to avoiding losing entries.
FCA (Financial Conduct Authority)
The regulatory body that oversees financial services firms and markets in the United Kingdom. The FCA sets conduct standards, authorises firms, and protects consumers. Traders using UK-regulated brokers operate under FCA rules.
Federal Funds Rate
The interest rate at which US banks lend reserves to one another overnight, and a primary tool of Federal Reserve monetary policy. As a base for borrowing costs across the system, it ranks among the most influential interest rates in the world.
Federal Reserve (Fed)
The central banking system of the United States, composed of the Board of Governors and 12 regional Federal Reserve Banks. The Fed sets US monetary policy through interest rate decisions and open market operations, and its communications are among the most closely watched events in global markets.
Fiat Currency
Money that derives its value from government decree rather than being backed by a physical commodity such as gold or silver. All major world currencies — the US dollar, euro, yen, and others — are fiat currencies; their value depends on institutional trust and monetary policy.
Fibo / Fibonacci
A technical analysis tool based on Fibonacci ratios such as 38.2%, 50%, and 61.8%. Traders use Fibonacci levels to identify possible retracement zones, targets, and support or resistance areas.
Fill
The execution of a trading order at a specific price. A complete fill occurs when the entire order quantity is transacted; a partial fill occurs when only a portion is executed. Fill quality — price and speed — directly affects trading outcomes.
Fill or Kill (FOK) Order
An order instruction requiring that the entire quantity be executed immediately and in full, or else cancelled entirely. FOK prevents partial fills, which is useful when a trader needs a complete position or none at all.
Financial Instrument
Any contract that creates a financial asset for one party and a corresponding financial liability or equity interest for another. The category encompasses stocks, bonds, currencies, derivatives, commodities, and money market instruments.
Financial Market
Any venue or system enabling the buying and selling of financial assets. Financial markets encompass stock exchanges, bond markets, foreign exchange markets, and derivatives markets, collectively facilitating capital allocation, price discovery, and risk transfer.
Fixed Costs
Operating expenses that remain constant regardless of a company’s production or revenue level — such as rent, salaries, and insurance premiums. The ratio of fixed to variable costs determines a company’s operating leverage, affecting profit sensitivity to revenue changes.
Fixed Income
A class of investments in which the issuer makes scheduled payments of a defined amount or rate over time, returning the principal at maturity. The category spans government and corporate bonds, notes, bills, and certificates of deposit, and is valued for predictable income.
Flat
A price movement without a clearly expressed trend. The chart forms a so-called corridor. Also see Consolidation.
Float
The number of a company’s shares that are actually available for public trading, excluding restricted or insider-held shares. A low float means limited supply, which — combined with strong demand — can produce sharp, rapid price moves; high-float stocks tend to move more slowly.
Floating Exchange Rate
An exchange rate regime in which a currency’s value is determined by supply and demand in the open market rather than a government-fixed peg. Most major global currencies, including the US dollar, euro, and yen, operate under floating or managed-float systems.
Following Manager
Allows you to automate the work with accounts more efficiently and clearly. Trade on the main account, and all your actions will be automatically transferred to other accounts – just activate the order and position copying module. Following Manager ATAS works in 2 modes: Order copying and Position copying.
FOMC (Federal Open Market Committee)
The monetary policy-setting body within the US Federal Reserve, comprising the seven-member Board of Governors and five regional Federal Reserve Bank presidents. FOMC meetings — held eight times per year — determine the federal funds rate target and are among the highest-impact scheduled events in global financial markets.
FOMO (Fear of Missing Out)
The anxiety that drives traders to enter a position late for fear of missing a profitable move, often resulting in poor entries at exhausted prices. FOMO is a common and costly psychological pitfall.
Footprint
Cluster chart. A modern format of the exchange chart displays the most accurate information about the transactions made, including time, price, volume of purchases, and sales.
Force Open
A specific order type that opens a new position in the opposite direction to an existing one on the same instrument, rather than closing or reducing the open position. Used when a trader intends to simultaneously hold both a long and a short position on the same market.
Forecast
A judgment about the probable future price movement. It is based on technical analysis and fundamental factors.
Forex
An over-the-counter foreign exchange market where currencies are bought and sold in pairs. Traders use forex to speculate on exchange-rate movements or to hedge currency exposure.
Forward Contract
A private, customised agreement between two parties to buy or sell a specific asset at an agreed price on a specified future date. Unlike exchange-traded futures, forward contracts are negotiated OTC, offering flexibility in terms and size but introducing counterparty risk.
Forward Market
The market of derivative financial instruments. It trades futures, options, and swaps.
Forward P/E (Expected P/E)
A variant of the price-to-earnings ratio that divides the current share price by projected future earnings per share rather than past results. It reflects analyst or company expectations of future profitability.
Fractional Shares
The ability to buy a fraction of a single share of a company’s stock, allowing investors to access high-priced securities with modest amounts of capital. Fractional share dealing is now available on many retail investment platforms.
Free Cash Flow (FCF)
The cash a company generates from operations after subtracting capital expenditures needed to maintain or grow its asset base. Strong free cash flow signals financial health and the capacity to fund dividends, buybacks, or debt reduction.
FTSE (Financial Times Stock Exchange Index)
A family of stock market indices maintained by FTSE Russell, representing companies listed on the London Stock Exchange. The FTSE 100, covering the 100 largest companies by market capitalisation, is the primary benchmark for UK equities and a major global index.
Fundamental Analysis
An approach to assess the market, industry, and economy. It includes a set of methods of analytical research of macro and microeconomic data, their comparison with each other, as well as financial analysis.
Funding Charges
The daily cost — or credit — applied to leveraged positions that are kept open overnight, reflecting the cost of financing the borrowed portion of the trade. Charges are typically calculated on the full notional value at a rate linked to a benchmark interest rate plus a broker spread.
Futures / Futures Contract
A derivative contract that obligates the buyer and seller to exchange an underlying asset at a specified price on a future date. Futures are widely used for speculation, hedging, and trading commodities, indices, currencies, and rates.
G
Gamma
An options Greek measuring the rate of change of delta relative to a one-point move in the underlying asset’s price. High gamma means delta — and therefore the option’s price sensitivity to the underlying — can change rapidly with small price moves, making gamma a key measure of non-linear risk in options positions.
Gap
A price change that creates a ‘disruption’ between the bars in the chart. Gaps are very common for opening a session in the stock market. They are less frequent in the Forex and futures markets since they are open for a longer period of time. There could be a gap up or a gap down.
Gap Down
A price gap that appears when an instrument opens lower than the previous session’s low or close, leaving an empty area on the chart. Gap downs usually signal selling pressure, negative news, or a rapid repricing of risk before trading resumes.
Gap Up
A price gap that appears when an instrument opens higher than the previous session’s high or close, leaving an empty area on the chart. Gap ups often reflect a sudden change in sentiment, news, overnight demand, or aggressive buying before the regular session.
GDP (Gross Domestic Product)
The total market value of all finished goods and services produced within a country’s borders over a given period. GDP is the broadest measure of economic activity and is widely used to assess the health of an economy, influence central bank policy, and drive currency, equity, and bond markets.
Gearing Ratio
A metric expressing the proportion of a company’s financing that comes from debt relative to equity. High gearing amplifies both returns and risk, as earnings must first service debt before benefiting shareholders. Analysed closely by bond investors and credit analysts.
Go to cash / jump out / exit the market
Close all open positions (trades). Sell everything that was bought (opened long). Cover everything that was sold (open short).
Good Till Cancelled (GTC) Order
An order that remains active on the broker’s system across multiple sessions until it is either executed or manually cancelled by the trader, rather than expiring at the end of the day. Useful for setting target entries or exits in advance.
Greeks
A set of risk measures quantifying how an option’s price responds to different factors — delta (underlying price), gamma (delta’s change), theta (time decay), vega (volatility), and rho (interest rates). Collectively they frame options risk management.
Grey Market
Unofficial trading in a security before it has been formally listed on an exchange — most commonly seen before an IPO. Grey market prices reflect early market expectations for the opening trade price and can serve as indicators of likely investor demand.
Grid Trading
An automated strategy that places staggered buy and sell orders at preset intervals above and below a base price, profiting from price oscillations within a range. It performs best in sideways markets.
Gross Margin
The proportion of revenue retained after deducting the direct cost of producing goods or services (COGS), expressed as a percentage. A higher gross margin reflects stronger pricing power or production efficiency and is a primary indicator of business quality.
Guaranteed Stop
A stop-loss order variant that guarantees a position will be closed at precisely the stated price, even during fast-moving markets or price gaps. Brokers typically charge an additional premium for this feature, but it eliminates slippage risk on the downside.
H
Hammer Candle
A single candlestick appearing at the bottom of a downtrend, featuring a small body near the top and a long lower wick. It signals that sellers drove the price down but buyers regained control, suggesting a potential bullish reversal.
Handle
The integer or whole-number portion of a price quotation. In Forex, if EUR/USD is trading at 1.0875, the handle is 1.08; traders discussing the market often refer only to the final digits assuming the handle is understood. The concept also appears in futures and equity markets.
Hanging Man
A bearish reversal candlestick with a small body and a long lower wick, forming at the top of an uptrend. It warns that selling pressure is emerging despite the prevailing rise.
Harami Pattern
A two-candle reversal pattern where a small candle is contained within the body of the preceding larger candle. A bullish harami appears after a downtrend and a bearish harami after an uptrend, both signalling possible trend exhaustion.
Hawks and Doves
Metaphors for two opposing schools of thought among central bankers and economists. Hawks prioritise combating inflation and typically favour raising interest rates or tightening monetary policy. Doves prioritise economic growth and employment and lean toward lower rates and looser policy. Understanding this distinction is essential for interpreting central bank communications.
Head
The central and usually highest peak in the Head and Shoulders chart pattern. It is located between two lower peaks called shoulders and can signal a potential trend reversal.
Heatmap
A way of displaying the activity in the DOM over time. The brighter the level on the price chart – the larger the volume of limit orders placed at this level in the stock exchange stack.
Hedging
A risk-management technique used to reduce the potential impact of an unfavorable price movement. Traders hedge by opening an offsetting position in a related instrument, futures contract, option, or currency pair.
Heikin Ashi
A candlestick charting variant that uses averaged price values — incorporating both the current period’s open/high/low/close and the previous candle’s data — to smooth price noise. Heikin Ashi candles make trends easier to identify visually and reduce false reversal signals.
High
Maximum price. For example, the daily high is the maximum price for the day at which the deal was concluded. To catch the high – to conclude a deal at the maximum price.
High-frequency trading (HFT)
A type of trading in which the period between opening and closing a trade lasts for a fraction of a second. This type of trading is generally carried out using trading robots.
Holding Period
The length of time an investor owns an asset before selling it. The holding period determines whether a gain is taxed at the short-term or long-term capital-gains rate and is central to many tax and strategy decisions.
I
Ichimoku Cloud
A multi-component Japanese technical indicator providing a visual representation of support/resistance, trend direction, and momentum simultaneously. It consists of five lines and a shaded ‘cloud’ (kumo); price trading above the cloud is bullish, below is bearish, and within the cloud signals indecision.
ICO (Initial Coin Offering)
A crypto fundraising method in which a project sells newly created tokens to early backers to raise capital, analogous to an IPO for cryptocurrencies. ICOs carry high potential reward and high risk.
Imbalance
A condition where buying and selling at given price levels are markedly unequal, leaving inefficiencies on the chart. Imbalances often act as magnets that price returns to fill, and are central to order-flow analysis.
Immediate or Cancel (IOC)
An order instruction requiring that any portion available be executed at once, with the unfilled remainder cancelled immediately. Unlike all-or-none, IOC permits partial fills, avoiding the need for manual cancellation of the balance.
In the Money (ITM)
An options term indicating that an option has intrinsic value. A call option is in the money when the underlying asset’s price is above the strike price; a put option is in the money when the underlying is below the strike price. ITM options are more expensive than out-of-the-money options.
Income Fund
An investment fund whose primary objective is generating regular income for investors — typically through dividends, bond coupons, or other yield-producing holdings — rather than maximising capital appreciation. Suited to income-dependent or conservative investors.
Income Statement (P&L)
A financial statement reporting a company’s revenues, expenses, and resulting profit or loss over a defined accounting period. Also called the profit-and-loss statement, it reveals operating performance and is central to fundamental analysis.
Index
A financial indicator. It is the generalized and averaged (by a special formula) price of all financial instruments included in its calculation base. The index reflects the dynamics of the market (stock market, bond market, and so on).
Indicator
One of the tools for working with a chart. Indicators recalculate data and transform it into a convenient form. There are fundamental indicators (predicting based on macroeconomic indicators), technical indicators (predicting based on previous chart movements), and indicators designed to analyze volumes. The purpose of indicators is to help analyze the market and find entry and exit points.
Inflation
A measure of the cumulative increase in the cost of all goods and services in an economy. Over the course of a year, some goods may become slightly cheaper, while others may become slightly more expensive. Moderate inflation is considered a good thing for the economy, while high inflation and deflation (falling prices) are extremely dangerous phenomena.
Inside Bar
A candlestick whose entire range is contained within the previous candle’s range, reflecting consolidation and reduced volatility. Traders watch for a breakout beyond the parent bar to signal the next directional move.
Insiders
Market participants who have real information that is unaccessible to the majority. This information (inside) can influence the prices of exchange instruments. That is why inside knowledge (for example, information about unpublished reports) gives insiders a competitive advantage in the market.
Institutional Investor
An organisation — such as a pension fund, mutual fund, insurer, or hedge fund — that pools large sums to invest in securities and other assets. Institutional investors move significant volume and often receive preferential access and pricing.
Interest Rates
The cost of borrowing money, expressed as a percentage of the principal over a specified period. Central bank rate decisions are among the most influential drivers of currency values, bond prices, equity valuations, and overall credit conditions across the financial system.
Internal Rate of Return (IRR)
The discount rate at which the net present value of all projected cash flows from an investment equals zero. IRR is used to rank and compare the attractiveness of investments: the higher the IRR relative to the cost of capital, the more value-accretive the project.
Intrinsic Value
The true, calculated worth of an asset based on its underlying fundamentals, independent of its current market price. In options, intrinsic value is the immediate exercise value. In equities, it is an estimate of a company’s fair worth based on earnings power, assets, and growth — the cornerstone concept of value investing.
Intrinsic Value (Fundamental)
The estimated true worth of an asset or company based on analysis of its underlying fundamentals — earnings, assets, growth, and qualitative factors — independent of its current market price. Value investors seek assets whose intrinsic value exceeds their market price.
Inverted Hammer
A candlestick with a small body near the bottom and a long upper wick, appearing at the top of an uptrend. It indicates buyers pushed price higher but failed to hold the gains as sellers stepped in, hinting at a possible bearish reversal.
Investment
An activity directed at conserving and augmenting capital. Usually, investments mean inputs into stock markets (buying stocks, bonds, etc.). Investment inputs are performed for a long period, starting from 1 year and longer.
IPO (Initial Public Offering)
The process by which a privately held company first offers its shares to the public on a stock exchange. IPOs allow companies to raise equity capital from a broad investor base and provide a liquidity event for founders and early investors. IPO pricing and post-listing performance are closely watched market events.
Issuer
An organization that issued securities. For example, the company AAPL issued shares for XXX dollars. The issuer can also be the state.
J
Junk Bond (High-Yield Bond)
A bond carrying a credit rating below investment grade, reflecting a higher risk that the issuer will default. To compensate for that risk, junk bonds pay higher yields than safer government or investment-grade corporate debt.
K
Kelly Criterion
A mathematical formula for determining the optimal fraction of capital to risk on a trade based on its win probability and payoff ratio, aiming to maximise long-term growth. It is widely referenced in position sizing.
L
Large Cap
A classification for companies with a large market capitalisation, commonly defined as over $10 billion. Large-cap stocks are typically characterised by greater liquidity, more stable earnings, and broader analyst coverage than smaller companies.
Level 1 Data
The most basic real-time market quote, showing only the current best bid price and best ask price for a security, along with their sizes. It gives a snapshot of the immediate market but no view of orders queued behind the best prices.
Level 2 Data (Market Depth)
A detailed real-time view of the order book showing multiple bid and ask price levels beyond the best quote, along with the share quantities and market participants at each level. Level 2 reveals supply-and-demand depth and is heavily used by active day traders.
Leverage
The ratio between the amount needed to bet and the amount in the trader’s account, also called “leverage.” It helps to make large trades with minimal risk of loss.
Leverage Rate
The multiple by which a broker amplifies a trader’s deposited capital to determine total buying power. US brokers commonly offer 4x on qualifying accounts, while offshore or CFD providers may extend far higher multiples — magnifying both potential gains and losses.
Leveraged ETF
An exchange-traded fund that uses derivatives and borrowing to deliver a multiple — such as 2x or 3x — of an underlying index’s daily return. The daily reset means returns compound in ways that make leveraged ETFs unsuitable for long-term holding.
Liabilities
Financial obligations owed by an individual or company to external parties, including bank loans, bonds payable, accounts payable, and accrued expenses. On a balance sheet, total equity equals total assets minus total liabilities.
Limit Order
An order that is executed at the price specified in it. It may be executed at the best price but not at the worst price. A limit order could be for buying or selling. It could be set higher or lower than the current rate.
Limit Up / Limit Down
Exchange-imposed price movement limits that temporarily halt or restrict trading when a security’s price rises or falls by more than a preset percentage within a session. These circuit breakers are designed to curb extreme intraday volatility and prevent panic-driven crashes.
Line Chart
A chart that connects closing prices into a continuous line. It gives a clean view of the general trend but hides intraperiod details such as highs, lows, and volume.
Liquidation
A forced position closing. This unpleasant event occurs when a trader has no money to support his position. Sometimes, it means that the trader lost his capital completely, and sometimes, it means that he lost it partially.
Liquidity
The popularity of the market. The more operations in the market are, the more traders there are and the less difference between counter-orders is – the higher the market liquidity is.
Liquidity Grab
A sharp move that pushes price beyond an obvious support or resistance level to trigger stop orders and clustered liquidity, before reversing. Large players use liquidity grabs to fill sizeable positions.
Liquidity Seizure
Position building by means of a flow of counter-orders. For example, a major player uses a splash of panic to sell orders and accumulate a long position.
Liquidity Sweep
The act of price sweeping through a zone of resting orders — typically stops above highs or below lows — to capture liquidity before moving in the intended direction. Closely related to the liquidity grab.
Locking
An opening of a position that is opposite to the already existing one and has the same volume. It is allowed in the Forex if a trader has an open buy and he opens a sell. It is a kind of hedging. Locking is not allowed for regular traders in the stock market.
Log (Trader’s log)
A trader’s electronic or paper journal. It records stock exchange operations with prices, reasons for making them, important events, thoughts, ideas, and many other things. A diary helps a trader to keep discipline, find and eliminate mistakes, and better understand his psychology and his actions on the stock market.

Long (Long Position)
The availability of previously bought securities with the purpose of further broking at a higher price.
Long Side Trading
Buying a security in the expectation that its price will rise, profiting from upward movement. A long-side trader holds a positive share balance and is said to hold a bullish position. The opposite of short-side trading.
Loss
A negative financial result from a trade when the exit price is worse than the entry price after costs. Losses can be realised after closing the position or unrealised while the position remains open.
Lot
A standard unit used to measure the size of a transaction or position. The lot size depends on the market and instrument, for example shares, futures contracts, or forex units.
Low
The lowest price reached by an asset during a selected period, session, or candle. Traders use lows to identify support, stop-loss zones, and market structure points.
M
M2 Money Supply
A broad measure of an economy’s money stock that includes physical cash and coins, demand deposits (M1), plus savings accounts, small time deposits, and retail money market funds. Rapid M2 growth can signal future inflationary pressure and is monitored by central banks.
MACD (Moving Average Convergence/Divergence)
A trend-following momentum indicator built from the difference between two exponential moving averages (typically 12- and 26-period). The MACD line crossing above the signal line generates a bullish signal; crossing below generates a bearish signal. Divergences between MACD and price action can foreshadow trend reversals.
Maintenance Margin
The minimum equity level that must be maintained in a margin account to keep leveraged positions open. If the account balance falls below this threshold, the broker issues a margin call requiring the trader to deposit additional funds or face forced liquidation of positions.
Majority Stakeholders
Influential owners of the company stock, who, as a rule, are members of its Board of Directors. They can participate in making important decisions, they have access to inside information, and their votes have special weight at the stockholder meetings.
Manipulator / Puppeteer
A major player in the stock (currency, futures, or other) market who is often suspected of price manipulation.
Margin
The deposit of capital that a trader must place with a broker as collateral to open and sustain a leveraged position. Margin is expressed as a percentage of the full notional trade value and acts as a performance bond rather than a payment for the full position.
Margin Account
A brokerage account that lets a trader borrow against deposited capital, extending credit so that proceeds can be reused immediately without waiting for settlement. Margin accounts enable frequent intraday trading and leverage, but carry interest costs and liquidation risk.
Margin Call
Takes place when the value of an investor’s margin account falls below the required broker’s amount. The margin call is a broker’s requirement for an investor to deposit funds immediately to support the investor’s position.
Margin Deposit
The actual monetary amount placed with a broker when a leveraged position is opened — also called initial margin. It represents the minimum capital required to access the full notional value of the trade.
Margin Lending
A method of buying more on the exchange than you can afford and possibly selling the securities you do not have. Due to the margin lending service, a broker (or exchange) provides you with, you can trade for the amount of USD 1,000 while having only USD 200-300 on the account.
Margin Rate
The interest rate a broker charges for capital borrowed to hold leveraged positions, typically applied only to positions carried overnight rather than closed intraday. The margin rate is a recurring cost that erodes returns on financed positions.
Mark-to-Market
An accounting and valuation practice of recording an asset or liability at its current market value rather than its historical cost. Mark-to-market gives a real-time picture of worth but can introduce volatility into reported values.
Market Analysis
A list of analytical information that can be used to guide you when playing on the stock exchange. This block includes world macroeconomic news and expert forecasts.
Market Data
Real-time and historical price, volume, and depth information for financial instruments, distributed by exchanges and data vendors. Market data encompasses bid/ask quotes, last-traded prices, trade volumes, open interest, and news feeds — the raw material on which all trading decisions are based.
Market Maker
A person who provides services to the exchange to maintain prices and/or trading volume on various financial markets.
Market Order
An order to immediately buy/sell an exchange instrument at the best current market price. It is an aggressive type of trading on the more decisive and dominant market side.
Market Profile
A market analysis tool that shows where trading activity was concentrated over time and price. It helps traders identify value areas, points of control, and zones where buyers or sellers were active.
Market Replay (Replay)
A stock exchange simulator that uses historical data to recreate the course of trades from the past to the present. Figuratively speaking, it is a “time machine” in the trading platform with Play, Pause, and Stop buttons. Replay allows you to practice your chart-reading skills, and create new strategies and/or improve existing ones without risking real capital.
Market Structure Shift (MSS)
A confirmed break in the sequence of highs and lows that defines a trend, signalling a potential change in direction. Market-structure analysis underpins many smart-money and price-action strategies.
Market Taker
A participant who removes liquidity from the order book by executing against existing limit orders with a marketable order. Market takers pay the spread for immediacy, while market makers provide liquidity by placing resting orders.
Market Top
The highest price point reached before a market transitions from a rising (bull) phase to a falling (bear) phase. Tops are typically identifiable only in hindsight and mark the exhaustion of an uptrend.
Market Trend
The general direction in which a market or security moves over time — upward, downward, or sideways. Identifying the prevailing trend is a foundational step in most technical and tactical strategies.
Market Value
The price at which an asset would change hands between willing buyers and sellers in an open market at a given moment. For listed companies, market value equals market capitalisation; for individual securities, it is synonymous with the current quoted price.
Megaphone Pattern
A chart pattern of widening price swings between diverging support and resistance lines, reflecting rising volatility and indecision. Also called a broadening formation, it can precede sharp directional moves.
Merger
A voluntary combination of two companies into a single entity, typically through a mutual agreement and share exchange. Mergers are undertaken to achieve cost synergies, expand market share, or enter new geographies, and often trigger significant price movements in the shares of both companies involved.
MetaTrader
A widely adopted electronic trading platform available in its MetaTrader 4 (MT4) and MetaTrader 5 (MT5) versions, developed by MetaQuotes. It provides charting, technical analysis, automated Expert Advisor trading, and order execution, and remains the most widely used platform in retail Forex and CFD trading.
Mid Cap
A classification for companies with market capitalisation typically between $2 billion and $10 billion. Mid-cap stocks combine elements of the growth potential associated with smaller companies and the relative stability of large caps.
Minority Shareholders
Stakeholders who own small amounts of company stock. They are not included in the company’s Board of Directors and own stock for investing or speculative purposes.
Momentum
A group of technical indicators measuring the speed and strength of a price move and the likelihood it continues. Momentum readings can diverge from price near turning points, hinting that a trend may be weakening.
Momentum Trading
A strategy that buys securities already rising strongly (or shorts those falling sharply), aiming to ride an established trend’s continuation. Momentum traders rely on price and volume signals and exit when the move shows signs of exhausting.
Money Management
A system of capital management. It includes a correct calculation of the working volume, a number of simultaneously opened positions, acceptable risks (drawdowns), guides for goals, etc.
Money Supply
The total amount of currency and liquid instruments circulating in an economy at a given time, spanning cash and various deposit balances. Central banks monitor and influence money supply to manage inflation and growth.
Moving Average
An indicator. It is the average price value for a selected period of time. There are several types of moving average calculations: simple, exponential, and others.
Municipal Bond
A debt security issued by a state or local government to fund public projects such as schools, roads, or utilities. In many jurisdictions the interest paid to investors is exempt from some income taxes, making munis attractive to income-focused investors.
Mutual Fund
A pooled investment vehicle that gathers capital from multiple investors and deploys it across a diversified portfolio of securities under the management of professional portfolio managers. Returns are distributed to investors proportionally to their holdings.
N
Negative Balance Protection
A regulatory or broker-imposed safeguard that prevents a retail trader’s account balance from falling below zero, even when a leveraged position moves sharply against them. The broker absorbs any loss beyond the deposited capital, limiting maximum client loss to the funds on account.
Net Asset Value (NAV)
The per-unit value of a fund, calculated by dividing the total market value of all the fund’s holdings minus any liabilities by the number of units or shares outstanding. NAV is the standard pricing mechanism for mutual funds and is published at the end of each trading day.
Net Change
The difference between a security’s current price and its previous day’s closing price, expressed in absolute terms or as a percentage. Net change gives an immediate read on a security’s daily directional movement.
Net Income
A company’s profit after all operating expenses, interest costs, and taxes have been deducted from total revenue. Net income — also called the bottom line — is the key measure of a company’s overall financial profitability.
Neutral Position
A market stance with no directional bias, taken when a trader expects a security or market to trade within a narrow range. Strategies are built to profit from that sideways, low-movement scenario rather than from a rise or fall.
Non-Farm Payrolls (NFP)
A monthly US Bureau of Labor Statistics report measuring the net number of jobs added or lost across most sectors of the US economy excluding farm workers, government employees, and certain others. NFP is one of the most market-moving economic data releases, impacting the US dollar, Treasuries, equities, and Fed rate expectations.
Non-Fungible Token (NFT)
A unique cryptographic token recorded on a blockchain representing ownership of a specific digital or physical item. Unlike cryptocurrencies, each NFT is one-of-a-kind and non-interchangeable, which makes them far less liquid than conventional securities.
O
On-Balance Volume (OBV)
A cumulative volume indicator that adds total day volume when price closes higher and subtracts it when price closes lower. Rising OBV confirms buying pressure behind an uptrend; OBV diverging from price can foreshadow trend exhaustion or reversal.
OPEC (Organisation of the Petroleum Exporting Countries)
An intergovernmental body of major oil-producing nations — including Saudi Arabia, Iraq, and the UAE — that coordinates member countries’ petroleum production policies to influence global oil prices. OPEC production quota decisions consistently rank among the most market-moving announcements in energy markets.
Open Interest
The value of mutually open positions of buyers and sellers. The value of open interest is broadcast only for crypto exchanges. Other exchanges offer this information only in their weekly reports.
Operating Income (EBIT)
A company’s profit after deducting operating expenses such as cost of goods sold, wages, and rent, but before interest and taxes. Also called EBIT, it measures how efficiently the core business converts revenue into profit.
Option
A contract by which a potential buyer or potential seller of an asset (commodity, security, etc.) obtains the right, but not the obligation, to buy or sell at a previously specified price.
Options Spread
An options strategy constructed by simultaneously buying and selling options of the same type on the same underlying asset but with different strike prices or expiration dates. Spreads cap both maximum profit and maximum loss compared to outright long or short options, reducing cost and risk.
Order
An instruction a trader sends to his broker for execution on the exchange. An example of an order is ‘to buy immediately’ or ‘to sell YY contracts when the price is at the level of USD XX’. All exchange orders are standardized. Every order contains all the necessary information, such as period of validity, money amount, price levels, conditions of execution, etc.
Order Block
A price zone where institutions placed large orders before a strong move, often acting as future support or resistance when price returns. Order blocks are a core element of smart-money and ICT trading strategies.
Order Flow
The real-time flow of market orders, limit orders, trades, and liquidity that shows how buyers and sellers interact at each price level. For ATAS users, order flow analysis is a core method for reading aggression, absorption, and imbalance through tools such as Footprint, DOM, and tape.
Order Routes (Direct Routing)
The specific pathways — named market makers or ECNs such as ARCA, EDGX, or INET — through which a trader’s order can be sent to the market. Choosing a route directly (direct routing) rather than leaving it to the broker can improve execution speed for active traders.
Oscillator
A modification of the technical analysis indicators that show the overbought/oversold areas. They are usually displayed in the form of a bar chart or curve and placed under the price chart.
OTC Trading (Over-the-Counter)
Trading conducted directly between two counterparties without the supervision of a formal exchange. The Forex market, most bonds, and many derivatives are OTC instruments. OTC markets offer greater flexibility and customisation but involve counterparty risk and reduced price transparency compared to exchange trading.
Out of the Money (OTM)
An options term for a call whose strike price exceeds the underlying asset’s current price, or a put whose strike is below it. OTM options have no intrinsic value — only time value — making them cheaper but requiring a larger price move to become profitable.
Overbought
The market is overheated, and prices are too high. The probability of their reduction is growing.
Overexposure
A condition in which a trader or portfolio has disproportionately large risk concentrated in a single position, asset, sector, or market. Overexposure violates diversification principles and means unexpected adverse moves in that area can cause outsized portfolio damage.
Overnight Leverage
The reduced leverage multiple a broker applies to positions held past the close of the trading session — commonly cut to around 2x of cash balance. Lower overnight leverage reflects the higher risk of holding positions through after-hours news and gaps.
Oversold
The market is panicking: prices are too low. The probability of their increase is growing.
Overtrading
Executing an excessive number of trades, often driven by emotion, boredom, or the urge to recover losses, leading to higher costs and poorer results. It is a frequent obstacle to consistent profitability.
P
P/E Ratio (Price-to-Earnings Ratio)
A valuation multiple calculated by dividing a company’s current share price by its earnings per share. The P/E compresses both the current market price and profitability into a single comparable number, allowing investors to gauge whether a stock is expensive or cheap relative to peers and historical averages.
Pairs Trading
A market-neutral strategy that simultaneously buys one asset and short-sells a closely related one, profiting if their price relationship converges or diverges as expected. It is typically applied to historically correlated assets that temporarily decouple.
Paper Profit / Floating P&L
Unrealised profit or loss on an open position — the amount that would become an actual, registered result if the position were closed at the current price. It fluctuates up and down while the position remains open and is not locked in until the trade is closed.
Paper Trading
Practising trades in a simulated environment using virtual money, allowing a trader to test strategies and learn a platform without risking real capital. The term originates from traders rehearsing on paper before committing real funds.
Par Value (Face Value)
The nominal value of a bond that the issuer agrees to repay the holder at maturity, on which coupon interest is calculated. Also called face value or principal, it is distinct from the bond’s fluctuating market price.
Partial Fill
A situation where only a portion of an order’s requested quantity is executed, leaving the remainder open. Partial fills commonly occur with limit orders priced tightly against available liquidity; the unfilled balance must be waited out or cancelled.
Passive Management
An investment strategy that seeks to replicate the returns of a market index by holding its constituent securities in the same proportions, rather than attempting to outperform through active stock selection. Passive funds — such as index funds and ETFs — typically carry lower fees and have outperformed most active funds over long horizons.
Pattern
A repeated price formation that appears on a chart and reflects typical market behaviour. Traders use patterns to build scenarios for continuation, reversal, breakout, or consolidation.
Pattern Day Trader (PDT) Rule
A US regulatory requirement classifying any trader who executes four or more day trades within five business days in a margin account as a pattern day trader, obliging them to maintain a minimum account equity of $25,000. Falling below the threshold restricts further day trading until it is restored.
PCE Price Index (Deflator)
The Personal Consumption Expenditures Price Index, a measure of price changes across consumer goods and services included in US GDP reports. The Federal Reserve favours core PCE as its preferred inflation gauge.
Pending Order
An order to execute a trade under certain conditions. For example, after posting a pending (limit) buy order when reaching the price level of XX, a trader may switch off the monitor since the trade will be executed automatically.
Pennant Pattern
A short-term continuation pattern formed by converging trendlines after a strong price move, resembling a small symmetrical triangle. A breakout in the direction of the prior move signals continuation; pennants can be bullish or bearish.
Penny Stock
A stock that trades at a very low price per share — conventionally under $5 — and often outside major exchanges. Penny stocks are highly speculative, thinly traded, and prone to manipulation, carrying outsized risk and volatility.
Piercing Line
A two-candle bullish reversal pattern in which a down candle is followed by an up candle that closes above the midpoint of the previous body. It signals a potential shift from selling to buying pressure.
Pin Bar Pattern
A single candlestick with a small body and one long wick, signalling a sharp rejection of a price level. A pin bar points to a potential reversal: a long lower wick suggests rejection of lower prices (bullish), while a long upper wick suggests rejection of higher prices (bearish).
Point, Pip
The minimum price change used to measure movement in an exchange-traded asset or currency pair. In forex, a pip usually represents a small standardized change in the quote, while points are used across futures, stocks, and indices.
Portfolio
A set of exchange assets, such as open positions in various markets and free funds on the account.
Position
An open trade that reflects the trader’s current exposure to a market. A position can be long, short, fully open, partially closed, profitable, or losing.
Position Trader
A trader who holds his position for a long period of time. It is the investment style. The trade duration is one year or more.
Post Market
Trading activity occurring after a formal exchange session closes. Post-market hours generally feature lower liquidity, wider spreads, and greater price sensitivity to news — including earnings releases and corporate announcements made after the regular close.
Pre-Market
The trading period before a stock exchange’s official opening. Pre-market activity reflects overnight news, global market movements, and early-released economic data, and can indicate how a security or market is likely to open.
Preference Shares
A class of stock that carries priority over common shares for dividend payments and asset distribution in a liquidation. Preference dividends are typically fixed, making preference shares behave more like bonds than equities. Some preference shares may be convertible into common stock.
Preferred Stock
A class of shares with a priority claim over common stock on dividends and on assets in a liquidation. Preferred dividends are usually fixed, giving these shares bond-like behaviour, though they typically carry no voting rights.
Premium (Options)
The total price a buyer pays to acquire an option contract, comprising intrinsic value plus time value. In fixed income, the term also denotes the amount by which a security’s price exceeds its face value. For option sellers, the premium is the income received.
Price Action
A trading approach that bases decisions purely on raw price movement — candlesticks, levels, and patterns — rather than on lagging indicators. Price-action traders read market structure and momentum directly from the chart.
Price-to-Book (P/B) Ratio
A valuation multiple comparing a company’s share price to its book value per share. A lower P/B can suggest a stock is reasonably or cheaply valued relative to its accounting net worth, though context and industry matter.
Professional Day Trader
A market participant who trades for a living and, from a regulatory standpoint, holds the relevant securities licences (such as the US Series 7 or 63). Licensed professionals typically pay higher market-data fees and are distinguished from retail traders dealing only their own capital.
Professional Market Participants
Licensed organizations and specialists that support the functioning of the securities market. They include brokers, dealers, exchanges, clearing houses, custodians, and other regulated infrastructure participants.
Profit and Loss Statement (P&L)
A financial statement — also called an income statement — summarising a company’s revenues, cost of goods sold, operating expenses, and taxes over a defined period to arrive at net profit or loss. The P&L is one of the three core financial statements analysed in fundamental research.
Proprietary (Prop) Firm Account
An arrangement in which a trading firm provides its own capital for a trader to deploy, often after the trader passes evaluation or licensing requirements and posts a modest deposit. Prop accounts can grant substantial leverage and buying power in exchange for a share of profits.
Proprietary (Prop) Trading
Trading financial instruments with a firm’s own capital rather than client funds, with traders typically sharing in the profits. Prop firms grant access to larger capital and leverage in exchange for meeting performance rules.
Protective Orders
Limit exchange orders used, as a rule, to protect an open position against undesirable losses in the event of unfavorable situation development. More commonly known as stop losses. They are also used to protect paper profits.
Public Float (Free Float)
The portion of a company’s shares freely available for public trading, excluding stock locked up by insiders, controlling investors, or governments. A smaller free float can amplify volatility for a given level of demand.
Pullback
A short-term, temporary price decline within a broader uptrend, often attributed to profit-taking or rebalancing rather than a fundamental change in direction. Pullbacks to key support levels or moving averages can offer tactical entry opportunities for trend-following traders.
Pump and Dump
A form of securities fraud in which promoters inflate a stock’s price through false or misleading hype, then sell their cheaply acquired shares at the elevated price, leaving later buyers with losses as the price collapses.
Purchasing Managers Index (PMI)
A monthly survey-based indicator measuring business conditions in the manufacturing or services sector. A PMI above 50 indicates expansion; below 50 signals contraction. PMI data is released ahead of most official statistics, making it a leading indicator of economic activity closely watched by traders.
Put Option
An options contract granting the holder the right — but not the obligation — to sell a specified amount of an underlying asset at a predetermined strike price before or on the expiration date. Traders use put options to hedge long positions against a price decline or to speculate on falling prices.
Q
Quantitative Easing (QE)
A non-conventional monetary policy tool in which a central bank creates new money to purchase financial assets — primarily government bonds — on the open market. QE lowers long-term interest rates, increases the money supply, and typically supports asset prices, but risks fuelling inflation and asset bubbles.
Quotation currency (counter currency)
The currency in second place in a price quotation. This is a Forex term. For example, the quotation currency in USDJPY is JPY.
Quote (Quotation)
The current price of an exchange instrument, based on the most recently executed trade. The term may also refer to historical price-change data for an instrument. The simpler word ‘rate’ is often used in everyday language.
R
Rally
A sustained, broad-based increase in the price of a financial asset, sector, or market index following a period of decline or consolidation. Rallies can be driven by positive earnings, improving economic data, policy shifts, or changes in investor sentiment.
Random Walk Theory
The financial hypothesis proposing that asset price changes are essentially random and independent of past movements, making future prices impossible to predict from historical data alone. It forms the basis of the Efficient Market Hypothesis and challenges the practical value of both technical and fundamental analysis in its strongest form.
Range
The difference over a certain period of time between the maximum and minimum levels of the asset price.
Rate of Return
The percentage gain or loss on an investment over a defined period relative to the initial cost or value. The rate of return is the universal metric for comparing the profitability of different investments and benchmarking performance.
Re-Quote
A situation when a broker offers another quotation at the moment of the order execution. Re-quotes often occur during periods of accelerated motion in the vigorous market. Sometimes, re-quotes bring even a higher profit.
Reaction
A temporary price movement against the current trend, often appearing after a strong impulse. In an uptrend, a reaction usually means a pullback; in a downtrend, it can appear as a short-lived rebound.
Rebalancing
The periodic adjustment of a portfolio back to its target asset allocation by buying and selling holdings whose weights have drifted. Rebalancing enforces discipline by trimming winners and topping up underweight positions.
Rectangle Pattern
A consolidation chart pattern where price oscillates between horizontal support and resistance levels, forming a rectangle. A breakout beyond either boundary signals the likely next directional move.
Register (Trading Register)
Contains detailed statistics of trading operations. A similar term is a trader’s log. It contains information about how much was bought/sold, at what prices, and what the result was.
Register profit (Loss)
To close the current position (trade). Besides, the paper profit (loss) becomes actual.
Regulatory Structures
Governmental organizations that provide control and management over the activities of brokers, exchanges, issuers, traders, and investors, i.e. all those involved in professional securities trading.
REIT (Real Estate Investment Trust)
A company that owns, operates, or finances income-producing real estate and is listed on a public stock exchange. REITs allow investors to gain exposure to diversified real estate portfolios and are typically required to distribute the majority of taxable income as dividends.
Relative Volume (RVOL)
A ratio comparing a stock’s current trading volume to its average volume over the same period historically. High relative volume signals that a stock is unusually active and ‘in play’, which often improves the reliability of technical setups and follow-through.
Renko Chart
A chart type built from fixed-size price ‘bricks’ that ignore time, plotting a new brick only when price moves a set amount. Renko charts filter out noise and make trends easier to see.
Reserve Currency
A currency, such as the US dollar, held in large quantities by central banks and global institutions as a trusted means of international payment and reserve. Reserve-currency status confers significant economic and financial advantages.
Resistance / Resistance Level
A significant level at which the price usually slows down its growth and starts falling.
Retirement Account (IRA / 401k)
A tax-advantaged investment account designed for long-term saving toward retirement. Trading within these accounts is permitted but restricted — typically no short selling, no leverage, and no access to gains before retirement age without penalty. Roth account growth is generally tax-free.
Return on Equity (ROE)
A profitability ratio calculated by dividing net income by shareholders’ equity, expressing how efficiently management converts equity capital into profit. ROE is widely used to compare the performance of companies within the same industry and to identify businesses with durable competitive advantages.
Reversal
A confirmed change in the prevailing direction of a price trend. A bullish reversal marks the transition from a downtrend to an uptrend; a bearish reversal is the opposite. Reversals are distinguished from temporary corrections by their persistence and are identified using chart patterns, volume analysis, or indicator signals.
Reverse
To change an existing position to the opposite direction. For example, a trader may close a long position and immediately open a short position in the same instrument.
Reverse Stock Split
A corporate action that consolidates multiple existing shares into fewer, higher-priced shares — the inverse of a standard split. A 10-for-1 reverse split converts ten $1 shares into one $10 share. Often used to lift a share price above exchange minimum-listing thresholds.
Rho
An options Greek that measures how much an option’s price is expected to change when interest rates change by one percentage point. Rho is usually more important for longer-dated options and less significant for short-term contracts.
Rho
An options Greek measuring the sensitivity of an option’s price to a 1% change in the prevailing risk-free interest rate. Call options carry positive rho — rising rates increase their value — while put options carry negative rho, declining in value as rates rise. Rho tends to be most significant for long-dated, deep in-the-money options and is generally the least closely watched of the five main Greeks, though it becomes material in high-rate or rate-volatile environments.
Rights Issue
A method of raising new equity capital in which an existing listed company offers its current shareholders the right to purchase additional shares at a price typically set at a discount to the prevailing market price, proportional to their existing holdings. Shareholders who do not participate face dilution of their ownership stake.
Rising Wedge
A bearish chart pattern formed by two upward-sloping converging trendlines. Despite the rising shape, it usually signals weakening buying momentum and a downward breakout.
Risk Management
A set of measures directed at limiting losses, keeping them under control, and preserving capital. Mathematical models are used to achieve this goal.
Risk Premium
The extra return an investor demands for holding a risky asset over a risk-free benchmark such as a short-dated government bond. It represents compensation for bearing additional risk and underpins asset-pricing models.
Risk Tolerance
The degree of investment risk an individual is willing and able to accept, shaped by financial situation, goals, and temperament. Risk tolerance guides whether a portfolio is built conservatively or aggressively.
Risk/Reward Ratio
A measure comparing a trade’s potential profit to its potential loss, helping evaluate whether a setup is worth taking. A favourable risk/reward ratio allows profitability even with a moderate win rate.
Rollover
The process of extending an expiring futures or derivatives position into the next contract period by closing the near-term contract and simultaneously opening the equivalent position in a further-dated contract. In Forex, rollover refers to the swap credit or debit applied to positions held past the daily cut-off.
Round Numbers
Psychologically significant price levels ending in round figures (such as 100 or 1.2000) where orders tend to cluster. They frequently act as support, resistance, or targets due to collective trader behaviour.
RSI (Relative Strength Index)
A momentum oscillator developed by J. Welles Wilder that measures the speed and magnitude of recent price changes on a scale from 0 to 100. Readings above 70 conventionally signal overbought conditions; readings below 30 indicate oversold territory. RSI is among the most universally applied indicators in technical analysis.
S
S&P 500 Index
A stock-market index tracking 500 of the largest US-listed companies, weighted by market capitalisation. One of the most followed equity benchmarks in the world, it is widely used as a proxy for the overall US stock market.
Scaling In / Scaling Out
The practice of entering or exiting a position in several partial increments rather than all at once. Scaling in builds a position across multiple price points to refine the average entry; scaling out locks in profit or reduces risk gradually as price moves favourably.
Scalping
A short-term trading strategy focused on profiting from very small price increments by executing a large number of trades within seconds or minutes. Scalpers prioritise tight spreads, minimal slippage, and fast order execution, and almost always close all positions within the same trading session.
SEC (Securities and Exchange Commission)
The primary federal regulator of securities markets in the United States. The SEC enforces securities laws, oversees exchanges, brokers, investment advisors, and public companies, and works to protect investors against fraud and market manipulation.
Secondary Offering
The sale of additional shares by a company after its initial public offering. Each subsequent sale is still termed ‘secondary’ regardless of how many occur. It raises fresh capital but increases the share supply, typically diluting and depressing the existing share price.
Sectors
Broad groupings of companies operating in related industries, used to classify and compare equities and analyse economic trends. Standard classifications include Technology, Healthcare, Financials, Energy, Consumer Staples, and Industrials. Sector rotation — the movement of capital between sectors — is a key driver of equity market dynamics.
Securities
Tradeable financial assets representing claims on future cash flows or ownership — including stocks (equity), bonds (debt), ETFs, and derivative contracts. Securities are regulated instruments whose issuance, trading, and disclosure are governed by securities laws.
Securities Lending
A transaction in which the owner of securities temporarily transfers them to a borrower — typically a short seller or institution requiring delivery — in exchange for collateral plus a lending fee. Securities lending generates incremental income for long-term holders and provides the supply necessary for short-selling activity.
Settled Cash
The portion of cash in a brokerage account that has completed the post-trade settlement cycle and is fully available to reuse. Proceeds from a recent sale remain ‘unsettled’ until settlement, during which their use may be restricted.
Share Buyback
A corporate action in which a company repurchases its own outstanding shares from the open market using available cash or debt. Buybacks reduce the share count, boosting earnings per share and often the share price, and are frequently interpreted as a signal of management confidence in the company’s value.
Sharpe Ratio
A measure of risk-adjusted return, calculated as the excess return of an investment over the risk-free rate divided by its volatility. A higher Sharpe ratio indicates more return earned per unit of risk taken, allowing fair comparison between strategies.
Shooting Star
A bearish reversal candlestick with a small body near the low and a long upper wick, appearing at the top of an uptrend. It shows buyers pushed price up but sellers regained control, hinting at a downward reversal.
Short ETF
An exchange-traded fund constructed to deliver the inverse of the daily performance of a target index or asset, allowing investors to gain bearish exposure without directly short-selling securities. Short ETFs use derivatives and are designed primarily for short-term hedging or tactical trades.
Short Interest
The total number of a stock’s shares currently held short across the market, often expressed as a percentage of the float. Elevated short interest — typically above 30% — indicates crowded bearish positioning and raises the potential for a short squeeze.
Short Position
A selling operation. If you see that the price is ready to fall, you can even sell assets you don’t own (borrowed from a broker). You short the market with the goal of buying back the stock later at a lower price and capitalizing on the difference. A downside play.
Short Sale Restriction (SSR)
A regulatory rule triggered when a stock falls 10% or more from the prior day’s close, after which short sales may only be executed on an uptick (at a rising price). Designed to prevent aggressive short selling from accelerating a decline.
Short Squeeze
Closing short positions in a bull market at any price. This process strengthens the upward momentum even more.
Shortfall Risk
The probability that an investment portfolio will fail to achieve a minimum required return or value necessary to meet a specific financial objective — such as retirement income or a funding target. Shortfall risk is central to goals-based investing and pension fund management.
Simple Moving Average (SMA)
A moving average calculated as the unweighted mean of a security’s price over a set number of periods, giving each data point equal weight. SMAs smooth out short-term noise to reveal the broader trend, though they respond more slowly than exponential averages.
Size
The volume of an order, position, or market activity. In trading, size determines how much capital is exposed and how strongly a position affects account risk.
Slippage
The difference between the price at the moment of order posting and the price at which this order will be executed. Slippage is most common for vigorous markets when sharp price increases and an order flow from traders occurs on the exchange.
Smart Money Concept (SMC)
A trading framework built around how institutional ‘smart money’ accumulates and distributes positions, using ideas like liquidity, order blocks, and market structure shifts. Popularised by the ICT methodology, it seeks to trade in line with large players.
Smart Order Router (SOR)
Automated technology used by brokers and trading systems to evaluate multiple trading venues simultaneously and direct each order to the location offering the best available price and liquidity at the moment of execution.
Smart tape
An enhanced Time Sales (tape reading) module, native to the ATAS platform, that reassembles the fragmented prints exchanges split large orders into back into their true original size — revealing the real scale and direction of market activity. Built-in volume filters let traders isolate large institutional orders from retail noise, making an otherwise fast and hard-to-read tape practical to follow and trade from directly.
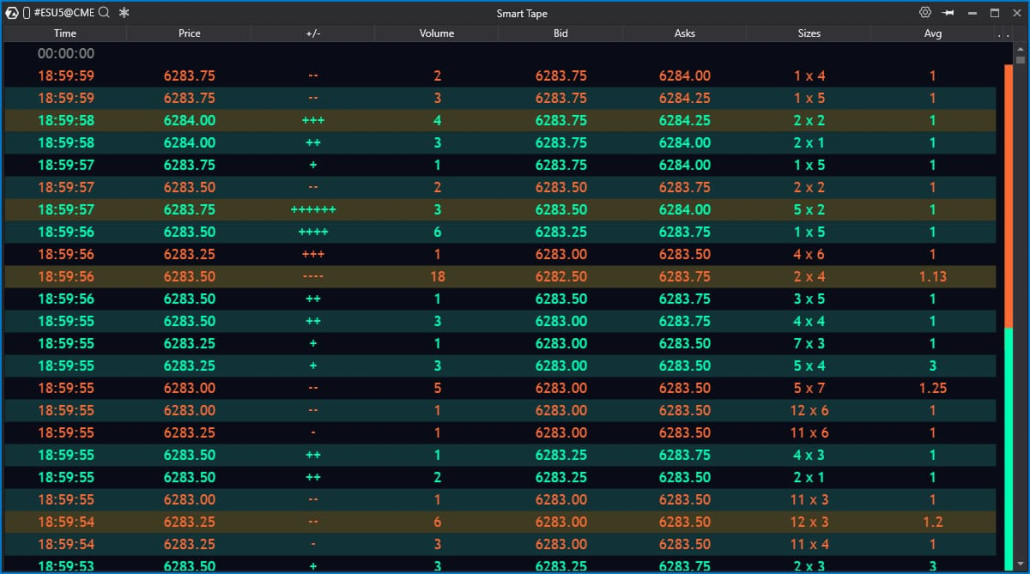
Smart Routing
An automated order-routing service in which the broker selects the execution venue it deems best, rather than the trader choosing one. Convenient for most users, though the broker’s preferred route — sometimes chosen for cost reasons — may not always yield the best fill for the trader.
Socially Responsible Investing (SRI)
An investment approach that integrates environmental, social, and governance (ESG) considerations alongside financial analysis. SRI investors screen out companies involved in harmful activities and favour businesses with positive societal and environmental profiles.
SOFR (Secured Overnight Financing Rate)
A daily benchmark interest rate measuring the cost of borrowing cash overnight collateralised by US Treasury securities, calculated and published by the Federal Reserve Bank of New York. SOFR has become the primary replacement for USD LIBOR across derivatives and loan markets.
Spike
A price quotation that stands out from the current general context. It may form a significant break in the price with a further return to the previous level. As a rule, spikes are the consequence of a technical malfunction.
Spinning Top
A candlestick with a small body and long upper and lower wicks of similar length, reflecting indecision between buyers and sellers. It often signals a pause or potential reversal in the prevailing trend.
Spoofing
A manipulative tactic of placing large orders with no intent to execute them, to create a false impression of supply or demand and mislead other traders. Spoofing is illegal in regulated markets.
Spot
A market for immediate exchange and settlement of currencies, commodities, or other assets. Spot trades usually reflect the current cash price of the underlying instrument.
Spot Price
The current market price at which a financial asset or commodity can be bought or sold for immediate settlement. Spot prices are the real-time benchmark against which futures prices and other forward values are measured.
Spread
The difference between the best buying price and the best selling price. In other words, the distance between the nearest Ask and Bid. Small spreads are characteristic of popular liquid markets.
Spread Betting
A leveraged derivative product allowing traders to speculate on price movements by placing a financial stake per point of movement in an instrument’s price — without owning the underlying asset. Gains or losses equal the stake multiplied by the number of points the market moves. In certain jurisdictions, spread betting profits may be exempt from capital gains tax.
Staking
Locking up cryptocurrency to support a blockchain network’s operations in exchange for rewards, similar to earning interest. Staking is common on proof-of-stake networks.
Stochastic
A technical analysis oscillator that compares the current closing price with a recent price range. Traders use the Stochastic indicator to identify potential overbought and oversold conditions.
Stock Market
An exchange market where transactions with securities are made: stocks, bonds, and shares.
Stock Screener
A software tool that filters the universe of stocks against trader-defined criteria — such as price, volume, float, percentage change, or relative volume — to quickly surface candidates that match a strategy. A core part of the daily pre-market routine for active traders.
Stock Split
A corporate action that multiplies the number of outstanding shares while proportionally lowering the price per share, leaving total market value unchanged. A 7-for-1 split turns one $700 share into seven $100 shares. Splits increase the float and can improve liquidity and affordability.
Stockholder
A person or institution that owns shares of a company. Stockholders may benefit from price appreciation, dividends, and voting rights depending on the share class.
Stocks
Securities that indicate that their owner has contributed to the capital of the company. For example, Apple stock. There could be ordinary and registered stocks. A stock gives its owner the right to receive some benefit from owning it, such as dividends, voting at shareholder meetings, and claiming an interest in the company’s property.
Stop Loss
A protective order designed to help prevent capital losses. It is used to severely limit possible capital losses in case the market has gone the wrong way.
Stop Market Order
An order that becomes a market order the moment a security’s price reaches a defined stop level, then executes at the best available price. Buy stops are placed above the current ask and sell stops below the current bid; execution price is not guaranteed.
Stopping out
A price movement, the purpose of which is seen as activating protective stop orders.
Straddle
An options strategy constructed by simultaneously buying both a call and a put option on the same underlying asset with identical strike prices and expiration dates. A long straddle profits when the underlying makes a large move in either direction — making it a bet on volatility rather than directional movement.
Strike Price
The fixed price at which an option can be exercised — allowing the holder to buy the underlying asset (for a call) or sell it (for a put). The relationship between the strike price and the current market price determines whether an option is in, at, or out of the money and strongly influences its premium.
Supernova Pattern
A dramatic, news- or hype-driven explosion in a stock’s price that creates rapid opportunities to buy on the way up and short on the collapse. Supernovas carry extreme volatility and risk, especially for traders who enter late in the move.
SuperTrend Indicator
A trend-following indicator plotted over price that flips between bullish and bearish based on volatility (ATR). It provides clear trend direction and trailing stop levels.
Supply and Demand Zones
Price areas where strong selling (supply) or buying (demand) previously emerged, often producing sharp moves. Traders expect these zones to act as future resistance or support when revisited.
Support (Support Level)
A significant level at which the price usually slows down its fall and starts to grow.
Swap
A value that influences open trader positions, which are rolled overnight. If a trader leaves a trade open the next day, a swap is charged for rolling over and holding the position.
Swing Trading
A trading style that holds positions for longer than a single session — from one night to several weeks — to capture medium-term price swings. It sits between intraday trading and long-term investing, and typically combines both technical and fundamental analysis.
System Trading
A rules-based trading approach in which entries, exits, risk, and position management follow a predefined plan. System trading reduces impulsive decisions and allows the strategy to be tested on historical data.
T
Take A Position
To open a trade by buying or selling an exchange-traded asset. After taking a position, the trader has market exposure and must manage risk, stop-loss, and exit conditions.
Take Profit
The price value at which the planned profit fixing takes place. It is used for capital management.
Target
A planned price level where a trader expects to take profit or evaluate the next decision. Targets are often based on support and resistance, measured moves, volatility, or volume levels.
Tariff
A government-imposed tax on imported goods, usually a percentage of the price paid to a foreign seller and remitted by the importing company. Tariffs affect trade flows, corporate costs, and inflation, with market-wide implications.
Tax-Loss Harvesting
The practice of selling a losing investment to realise a capital loss that offsets capital gains or a limited amount of ordinary income, reducing the tax bill. Investors must avoid wash-sale rules when repurchasing similar securities.
Technical Analysis
A stock exchange science, a set of methods for analyzing price movement. It aims to determine the price movement that is more likely to occur.
Thematic Investing
An approach that selects investments based on long-term structural trends — such as clean energy, AI, or demographics — grouping relevant companies under an overarching theme rather than by traditional sector or geography.
Thick Market
A highly liquid market or stock crowded with participants, characterised by large float, tight spreads, and slow, orderly price movement. Thick markets suit lower-risk and long-term strategies but offer fewer rapid opportunities for day traders.
Thin Market
A market or individual stock with few active participants and limited market-making, resulting in low liquidity and wide bid-ask spreads. Thinly traded, low-float stocks can move violently on modest demand, making them both opportunity-rich and risky.
Tick / Tick Chart
Represents the quantitative price change within a time frame unit. One tick is equal to one price fluctuation. In the ATAS platform, a tick can represent one trade, or the minimum possible change in the instrument’s price.
Tilt
An emotionally compromised state — borrowed from poker — in which a trader makes irrational, often revenge-driven decisions after losses. Recognising and stepping back from tilt is essential for discipline.
Time and Sales Tape
An instrument for analyzing just-executed trades. It allows monitoring of what takes place ‘now and here’.
Time Decay (Theta)
The rate at which an option loses value due to the passage of time, all other variables remaining constant. As expiry approaches, the time value embedded in an option’s premium erodes — accelerating sharply in the final weeks before expiration. Theta benefits option sellers and penalises option buyers.
Time Horizon
The expected length of time before an investor needs to access invested funds. Longer horizons generally permit more risk because there is more time to recover from downturns, shaping asset allocation choices.
Time Stop
An exit rule that closes a position after a predefined period regardless of price, used when a trade fails to perform as expected within the anticipated timeframe. It limits exposure to stagnant positions.
Time Value
The portion of an option premium that exceeds intrinsic value, reflecting the probability that the option will move further in the money before expiry. Time value is a function of time to expiration, implied volatility, and interest rates, and decreases to zero at the moment the option expires.
To be in the market (to have a position)
To have an open position and therefore be exposed to price movement. While in the market, a trader’s profit or loss changes as quotes move.
To be out of the market (to have no position)
To have no open position in the selected market. A trader may stay out of the market to wait for a clearer setup, avoid risk, or preserve capital.
Tokenomics
The study of the economic design of a cryptocurrency or token — including supply, distribution, incentives, and utility — used to assess its long-term value and viability.
Tom-Next
Short for ‘tomorrow-next’, a foreign exchange transaction involving the simultaneous sale of a currency for value tomorrow and purchase of the same currency for value the next business day (or vice versa). Tom-next forms the mechanical basis for rolling Forex positions overnight and calculating the swap charge or credit applied to open positions.
Trade
An action that a trader undertakes on the exchange, such as buying/selling stock or closing a position. It is the realization of a trading plan.
Trader
A specialist who trades financial instruments on the exchange. He can buy and sell securities on behalf of his customers or on his own behalf. As a rule, a trader acts based on a developed strategy.
Trading
A commercial activity on the exchange. Trading as such is an analysis of the current market situation, the execution of trades, and the observation of risk management rules.
Trading Plan
A written framework defining a trader’s approach to the market, specifying entry and exit criteria, position sizing rules, risk per trade, daily loss limits, and review procedures. A consistent trading plan promotes disciplined decision-making and reduces emotional trading errors.
Trading Platform
Software for analyzing the market and executing trades. An advanced platform gives a competitive advantage in exchange trading.
Trading Session
A period during which trading on exchanges takes place. For example, on NASDAQ a trading session starts at 13:30 and ends at 20:00 UTC.
Trailing Stop-Loss
A type of stop-loss, an order for sequential automatic fixation of growing profit on an open position in case of a favorable price movement. The desired level of restriction is set, and the program moves it independently. The trailing stop is set for an open position and works only when the terminal is enabled.
Treasury Inflation-Protected Securities (TIPS)
US government bonds whose principal adjusts with inflation as measured by the Consumer Price Index, and which pay interest twice a year at a fixed rate on that adjusted principal. TIPS protect investors’ purchasing power against rising prices.
Treasury Stock
Shares that a company has previously issued and subsequently repurchased from public investors but not yet cancelled. Treasury stock carries no voting rights, receives no dividends, and reduces the total number of shares outstanding. It may be reissued, used for employee compensation plans, or eventually retired.
Trend
A stable price movement with a focused character. There could be an up (bullish) trend or a down (bearish) trend.
Trend Line
A line segment, half line, or continuous line built through the price extreme points in the chart. The trend line is an important level of resistance or support. It helps to find the position opening/closing moments and judge about the market strength/weakness and mood change.
Trending Shares
Stocks experiencing an unusually high volume of trading interest, price momentum, or search activity at a given moment, often triggered by earnings announcements, news events, viral social media activity, or inclusion in an index or thematic fund.
Triple Top / Triple Bottom
Reversal chart patterns formed by three peaks (triple top) or three troughs (triple bottom) at a similar level. They indicate strong resistance or support and a likely trend reversal once the pattern completes.
Triple Witching
The simultaneous expiration of stock-index futures, stock-index options, and single-stock options on the third Friday of March, June, September, and December. The overlap drives sharply elevated volume and volatility in the final trading hour.
U
U.S. Dollar Index (DXY)
An index measuring the value of the US dollar against a basket of six major currencies — the euro, yen, pound, Canadian dollar, Swedish krona, and Swiss franc. It is a key barometer of broad dollar strength.
Unborrowable Stock
A security that is unavailable for borrowing through brokers, making short-selling impossible for most market participants. This situation typically arises when short interest is exceptionally high, the float is very small, or lending agreements have been restricted — a condition that can contribute to short squeezes.
Underlying Security (Underlying Asset)
The primary financial instrument — such as a stock, bond, commodity, or index — from which a derivative like an option or future draws its value. The price behaviour of the underlying directly determines the derivative’s worth.
Underwriter
A bank or financial institution that manages the pricing, sale, and distribution of shares in an initial public offering. The underwriter works with the issuing company to set the IPO price and date, earning fees and often a portion of the shares.
Unfinished Auction
A market-profile concept describing a price extreme that ends with multiple trades rather than a single print, suggesting the auction was left incomplete. It often signals price will revisit that level.
Unit Investment Fund (UIF)
An investment method in which the fund participants’ money funds are accumulated and invested in valuable exchange assets.
Up-bar
A bar, the price of closing which is higher than the price of closing the previous bar (or than the price of its opening).
Upthrust
A VSA price-action pattern in which price spikes above a resistance level then closes back below it, trapping buyers. It signals weakness and a likely move lower, often engineered by larger players.
Uptrend
A sustained upward price movement in which each major swing is usually higher than the previous one. Traders describe it as a sequence of higher highs and higher lows.
V
Value at Risk (VaR)
A statistical risk measure estimating the maximum loss a portfolio is likely to experience over a defined time horizon at a specified confidence level. For example, a one-day VaR of $500,000 at 99% confidence means there is a 1% probability of losing more than $500,000 on any given day.
Vega
An options Greek measuring the change in an option’s price for every 1% increase in the implied volatility of the underlying asset. High-vega options are more sensitive to volatility shifts, making vega management central to strategies that trade on volatility expectations rather than pure directional movement.
VIX (CBOE Volatility Index)
A real-time index representing the market’s expectation of 30-day implied volatility for the S&P 500, derived from the prices of a wide range of S&P 500 options. Nicknamed the ‘fear gauge’, rising VIX signals investor anxiety and market stress; falling VIX reflects calm and risk appetite.
Volatility
A property (ability) of the price to change or deviate from its established value easily. A volatile market is one where significant expanded price fluctuations are observed.
Volume
A trading activity indicator. It can be calculated in contracts, money, or ticks. It can also be calculated for a unit of time (for example, a volume for 1 hour) and used for non-standard chart types. An increase in the volume in the direction of price movement usually shows the strength of this movement.
Volume Analysis
A type of technical analysis that focuses on the interaction between the price of a financial asset and the volume of concluded transactions. It is an effective approach to forecasting price movements. Volume analysis is based on studying supply and demand forces, which are the drivers (reasons) for quotation growth and decline.
Volume Profile
A charting tool that displays traded volume horizontally across price levels rather than over time, revealing where the most activity occurred. High-volume nodes act as support/resistance, while low-volume areas tend to be crossed quickly.
VWAP (Volume-Weighted Average Price)
The average price at which a security has traded during a session, calculated by weighting each transaction by its volume. VWAP is a benchmark widely used by institutional traders to assess execution quality — buying below VWAP is generally considered favourable; selling above it is preferable.
W
Warrant
A derivative instrument issued by a company (or third party) that gives the holder the right to purchase the company’s shares at a fixed price before a specified expiration date. Unlike options, warrants are issued by the company itself, and new shares are created upon exercise, potentially diluting existing shareholders.
Wash Sale
A tax rule disallowing a loss deduction when an investor sells a security at a loss and buys the same or a substantially identical one within a 30-day window before or after the sale. It prevents harvesting losses while maintaining the position.
Wave Analysis
Based on the idea that price movements follow specific patterns or waves. In trading, wave analysis is often associated with the Elliott Wave Theory, but it can also include other approaches and techniques, including David Weiss’ Wave and Volume Analysis.
Weis Wave
A volume-based adaptation of Wyckoff wave analysis that aggregates volume within price waves to reveal the effort behind moves. Rising wave volume confirms strength; shrinking volume warns of weakness.
West Texas Intermediate (WTI)
A grade of light, sweet crude oil produced in the United States and traded on the NYMEX exchange, serving as the primary benchmark for North American oil prices. WTI and Brent Crude together underpin the pricing of the majority of global oil contracts.
Witching Hour
The final hour of stock trading, from 3 to 4 p.m. Eastern, which can see elevated volatility as positions are squared before the close. It is most pronounced on days when derivatives expire.
Wolfe Wave
A naturally occurring five-wave chart pattern that, once identified, projects a target price and reversal zone. Traders use Wolfe Waves to anticipate where a trend is likely to terminate and reverse.
Working Order
Any buy or sell order that has been submitted to the market but remains unexecuted — waiting for the specified price conditions to be met. Working orders include limit orders, stop orders, and other conditional instructions still active in the order book.
Y
Yield
The income generated by an investment expressed as a percentage of its current price or original cost. For bonds, yield reflects the annual coupon relative to the bond’s market price; for equities, it reflects dividends relative to share price. Yield is the primary return metric for income-oriented investors.
Yield Curve
A graph plotting the yields of bonds of equal credit quality across different maturities. Its shape — normal, flat, or inverted — reflects market expectations for interest rates and growth, and is closely watched as a recession signal.
Yield to Maturity (YTM)
The total annualised return an investor earns by holding a bond until it matures, accounting for all coupon payments plus any difference between the purchase price and par value. It is the standard measure for comparing bond returns.
0–9
10-K
A comprehensive annual report that US publicly traded companies must file with the SEC, detailing financial performance, business operations, risk factors, and management analysis. It is far more detailed than the glossy annual report sent to shareholders.
10-Q
A quarterly financial report that US public companies must file with the SEC, covering performance for the preceding three months. Less detailed and unaudited compared with the annual 10-K, it lets investors track results between annual filings.