Boundless Charting
ATAS allows you to analyze any chart type—from familiar candlestick and line formats to advanced cluster layouts. Footprint charting unlocks a completely new level of market data detail. While a standard candlestick shows only the open, close, and extremes, a footprint chart acts like an X-ray: it lets you look inside the bar to see the actual battle between buyers and sellers that drove the price movement.
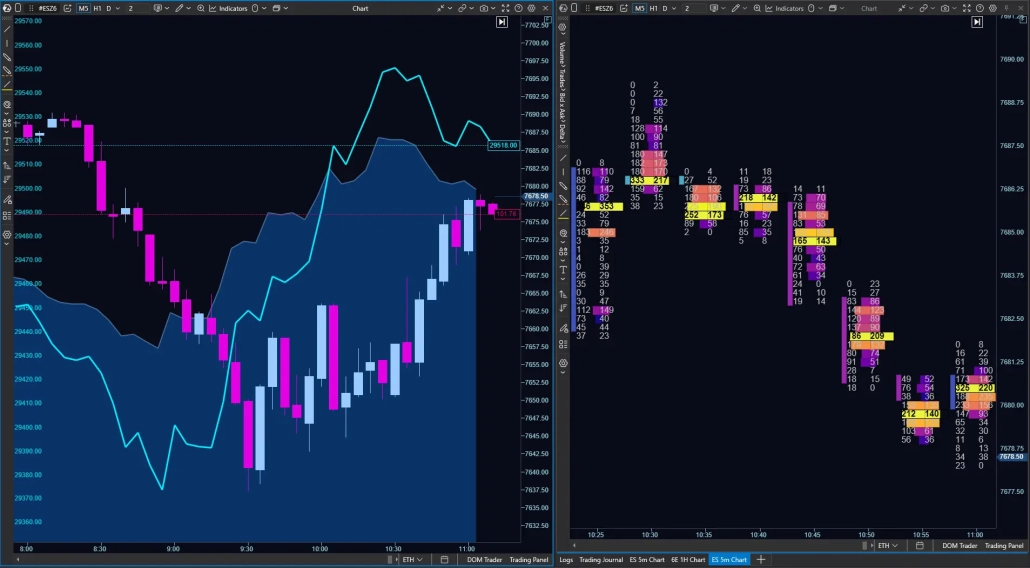
ATAS gives you far more than standard candles. Analyze professional trading charts using footprint modes: evaluate not just price, but the real confrontation between buyers and sellers at every level.
400+
Footprint Configurations
Choose the exact data mode inside the bar: Volume, Delta, Bid × Ask, Trades, Profile, or Heatmap. Highlight imbalances, filter Bid x Ask sizes, and display total bar volume. Configure displays as numbers, histograms, or combined layouts. Adjust transparency, fill gradients, and font colors. The best charting platforms are those that adapt entirely to your analytical needs.
14 Timeframe Types
Configure classic time periods (from 1S, 1M, and 1H to custom intervals). Filter out market noise by building advanced trading charts based on price movement: Range (including X, XV, Z, US), Renko, or Reversal. Alternatively, use non-time-based frames like OrderFlow, where a new bar opens based on the contract or trade count: Volume, Tick, Delta, Cumulative Trades, and Order Flow.
Comprehensive Analysis
Overlay market profiles for any selected period directly onto the chart to view value areas and strong support/resistance zones. Complement your traditional chart analysis software with professional volume analysis tools (Big Trades, Cluster Search) and multiple delta views (Delta, CVD, CVD Pro).