
A liquidity sweep occurs when price moves through a visible liquidity zone—often beyond a prior high or low where stop orders may be concentrated—and then rejects that area. In the Smart Money Concept (SMC), traders study this behavior to understand how price interacts with pools of buyside and sellside liquidity.
In this guide, you will learn how liquidity zones and BSL/SSL work, how to identify and confirm a liquidity sweep, how to build a liquidity sweep trading setup, and how these patterns appear in forex and crypto examples. We will also cover the main risks, including false breakout signals and cases where a sweep does not lead to a reversal.
Disclaimer. ATAS is not affiliated with Michael Huddleston (Inner Circle Trader, ICT) and does not promote his strategies. This article provides an overview of key market liquidity concepts and liquidity sweeps, along with ATAS platform tools that may be useful for traders studying the Smart Money Concept.
Start now!
Try ATAS free with no time limit
What Is Liquidity in Trading?
A liquid market is one with many active participants willing to buy and sell at any moment.
Example. The screenshot below displays the footprint chart of the E-mini S&P 500 futures contract with volume analysis indicators that help assess liquidity.
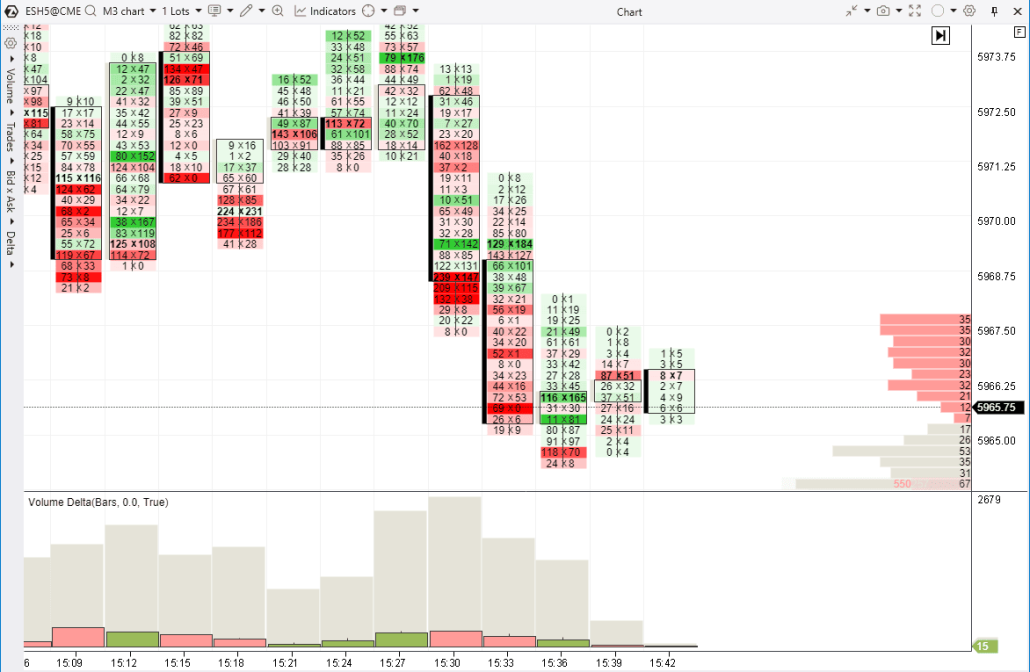
The footprint chart shows that, based on historical data, trades were executed at every price level. The market depth indicator (the horizontal histogram on the right) reveals dozens of buy and sell contracts at each minimum price increment. This indicates that the market remains sufficiently liquid even outside the main trading session.
Liquidity as Resting Orders in the Market
Liquidity is directly linked to the volume of pending orders:
- above the current price → Sell Limits + Buy Stops.
- below the current price → Buy Limits + Sell Stops.
These are sometimes called resting orders because they remain pending until market conditions trigger their execution.
Liquidity is not distributed evenly across price levels. A common example is round-number levels, such as $100,000 for Bitcoin. Traders often place orders at these psychological price points, and this applies not just to cryptocurrencies but to other markets as well.
Is there an indicator for stop-loss orders? While limit orders on exchanges can be analyzed using the Depth of Market (DOM) indicator, identifying the exact locations of stop orders is not possible. However, some believe that certain CFD brokers may provide data on the placement of stop orders of their clients in forex and other markets.
What Are Liquidity Zones?
In the Smart Money Concept (SMC), price levels with high concentrations of orders are known as liquidity zones. While this term is similar to demand and supply zones (which we cover in a separate article), it has a different meaning.
Since SMC focuses on institutional traders, liquidity zones are particularly important to them, as they provide opportunities to execute large orders efficiently.
Example. The screenshot below features a chart where Michael Huddleston, the creator of the Smart Money Concept, illustrates liquidity zones.
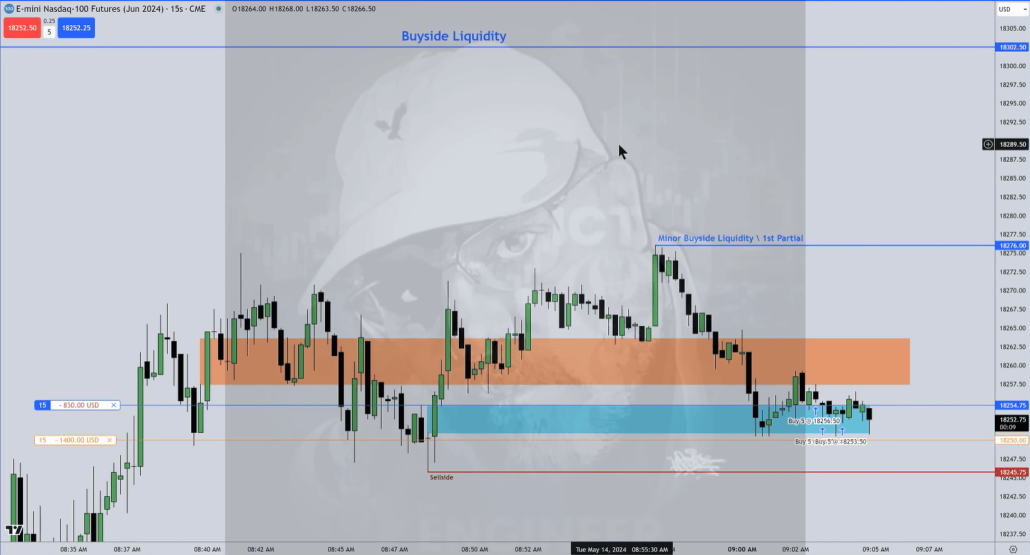
The blue lines labeled buyside liquidity highlight two levels where, according to the author, liquidity zones formed by buy orders are located. These zones consist of buy stop orders, which include:
- stop-loss orders placed by short sellers;
- entry orders from breakout traders.
The red line marks a local low, behind which lies a liquidity zone formed by sell orders.
Liquidity zones are often said to “pull the price in like a magnet.” That is why, in ICT market structure analysis, they are typically used as key target levels for price movement.
How to Spot Liquidity Zones on a Chart
The most obvious places to form liquidity zones are price levels beyond the extremes that are visible to all market participants. These are typically where retail traders place their stop orders, often following advice from popular trading textbooks.
However, there are other price levels worth considering as well:
- Psychological levels, as mentioned earlier.
- High-volume levels on the profile. These are areas where a large number of positions have been opened, and when the price tests these levels, traders may either close their positions or take other actions, leading to a surge of orders.
- Trendlines and channel boundaries. When the price approaches a key trendline, it tends to trigger activity from traders, increasing liquidity and attracting the attention of Smart Money.
Other methods for identifying liquidity zones may include margin levels, large volumes in options markets, and other specific strategies.
It is often suggested that Smart Money can “see both sides of the market,” implying the ability to monitor stop-losses. However, this is likely an oversimplified view of market trading. With that in mind, we now turn to the key concept of this article—a liquidity sweep.
What Is a Liquidity Sweep?
A liquidity sweep is a move through a price level where pending orders are expected to cluster, followed by rejection or a failure to continue in the breakout direction. The move can trigger stop-losses and breakout orders, creating a burst of liquidity that larger participants may use to execute positions.
The key point is that the sweep itself is not a reversal signal. Price can take liquidity and continue in the same direction, so traders should look for confirmation—such as rejection back through the level, weakening momentum, a market structure shift, or supporting volume and footprint evidence—before treating the move as a reversal setup.
✓ Who performs a liquidity sweep? The large players, commonly known as “Smart Money.”
✓ Whose liquidity is it? The orders of retail traders, who often trade based on emotions and simple technical analysis rules.
✓ Why do they do this? To implement their strategies and execute large-volume orders.
Large market participants have a deep understanding of the behavior of their counterparts — mainly less experienced traders. This behavior shows up on the charts and can be used when developing trading strategies.
Example of Liquidity Sweep
On Monday, February 3, the market opened unusually, as over the weekend, the U.S. President signed an executive order imposing tariffs on goods from Canada, Mexico, and China. This was viewed as a sign of a global trade war and a potential threat of stagflation.
Example. In the S&P 500 futures chart, the first candle after the bearish gap was particularly wide. In the following hours, the price consolidated, providing an opportunity to use the high and low of the opening candle to establish levels:
- BSL – Buyside Liquidity, suggesting a cluster of buy-stop orders behind this level.
- SSL – Sellside Liquidity, following the opposite logic.
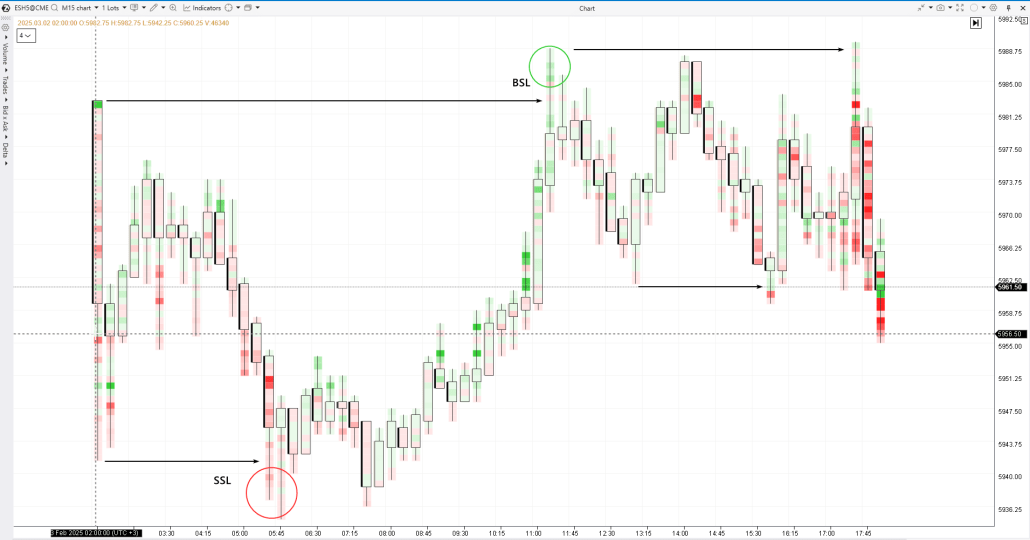
Footprint charts make the process of exchange trading more transparent by showing what happens when the price reaches a liquidity zone:
- Red circles indicate market sells.
- Green circles mark the price’s entry into the buyside liquidity zone.
A trader using footprint charts could gain more confidence and switch to a minute time frame (or apply another method) to identify a more precise entry point.
For more information on this topic, refer to the article “Who Is Triggering Your Stop Losses, and Why?” While not directly related to the Smart Money concept, its content aligns with this topic, explaining the same processes in different terms.
How to Identify Liquidity Sweeps in the Market
Suppose you have identified a zone where a cluster of stop orders is likely located. When the price reaches this potential liquidity zone, how can you confirm that a liquidity sweep is taking place?
Buyside Liquidity Sweep
A buyside liquidity sweep occurs when price trades above a visible high or BSL zone, activates buy stops and breakout orders, and then shows rejection instead of holding above the level. A return below the swept high can strengthen the reversal idea, but it should still be confirmed with market structure, volume, or footprint data.
Sellside Liquidity Sweep
A sellside liquidity sweep is the opposite setup: price trades below a visible low or SSL zone, activates sell stops and breakout orders, and then rejects the move. A recovery back above the swept low can be a useful confirmation signal, especially when it aligns with market structure and order-flow evidence.
The most effective way is through volume analysis tools:
- Footprint charts.
- Volume indicators, such as Delta, Speed of Tape, Market Profile, and others.
- Non-standard chart types.
- Market structure analysis, for example, if the price enters a BSL zone, confirmation can come from observing price dynamics: upward waves may lose momentum, the slope may flatten, and buying volume may start to decline.
It is important to understand that a liquidity sweep alone does not necessarily lead to the development of a trend. For example:
- The price reaches the BSL.
- A surge in market buy orders occurs.
Next, it is important to see the price decline. In this case, the triggering of short-sellers’ stop-losses is not a strong enough driver to overcome resistance levels.
Liquidity Sweep vs Liquidity Grab
In the Smart Money strategy, in addition to a liquidity sweep, there is also the term a liquidity grab. Both concepts are similar not only in name but also in meaning: they describe the moment when the price reaches a liquidity zone — an area where retail traders’ stop-losses are clustered. This enables large players (“smart money”) to capture the necessary volume of opposing orders to execute their strategies.
What is the difference between a liquidity sweep and a liquidity grab? In their size.
Let’s assume the price rises to the BSL zone:
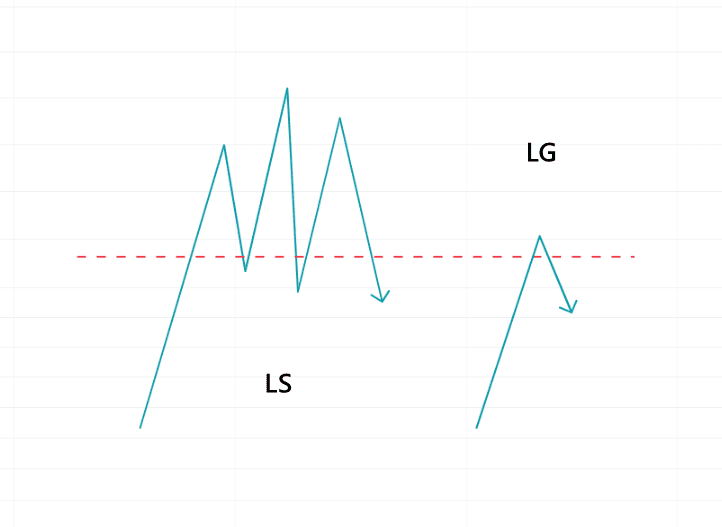
- Option 1. If the price moves deeply into the liquidity zone and lingers there for a while, creating multiple up-and-down fluctuations and fully clearing out the liquidity, it is considered a liquidity sweep (LS).
- Option 2. If the price makes a quick move into the liquidity zone, targeting only a small number of pending retail orders, it is a liquidity grab (LG).
It is important to understand that size in chart analysis is a relative concept. The distinction between a liquidity sweep and a liquidity grab can vary depending on the chosen time frame and chart settings. As a result, the same price reversal might be interpreted differently—some traders may see it as a liquidity sweep, while others might classify it as a liquidity grab.
With that in mind:
- Subjectivity plays a role, and certain patterns described as liquidity sweeps in this article might be viewed as liquidity grabs by experienced Smart Money Concept traders. However, debating the terminology is unnecessary—the underlying principle remains the same.
Example of a Liquidity Sweep in Forex
Below is a cluster chart of euro futures based on CME data. Since currency futures are closely tied to the spot interbank market, we can use this as an example of a liquidity sweep in forex. Additionally, cluster charts offer valuable insights when analyzing exchange-traded currency assets.
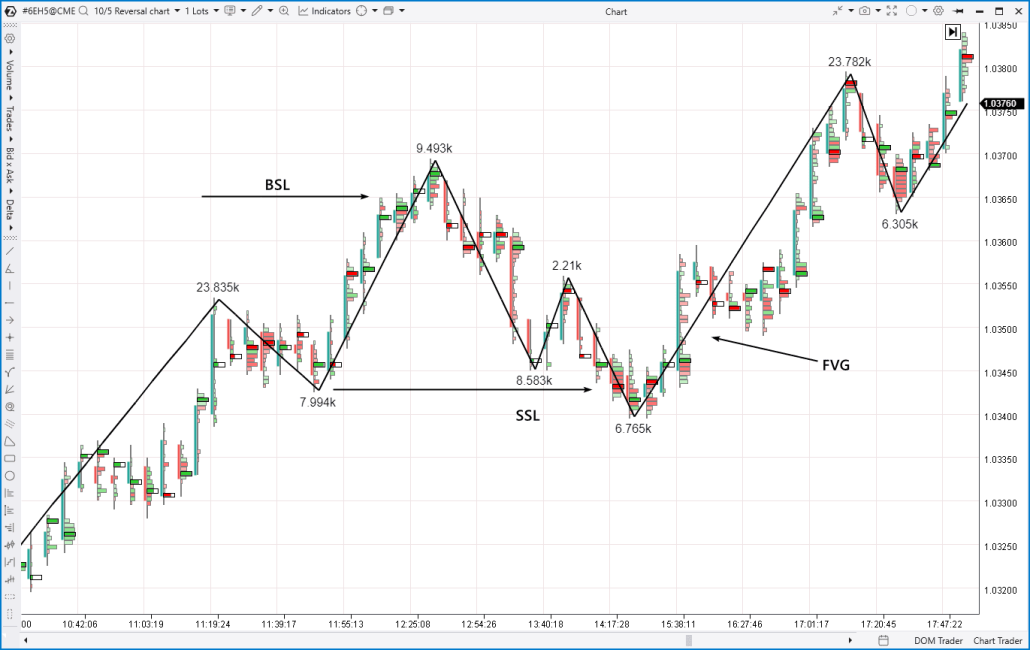
The left side of the chart shows a bullish structure. The price moved up toward the BSL zone, located near the previous day’s high. The sharp increase in market buying activity (visible in the bright green clusters) suggests that short sellers’ stop-losses were being triggered—an opportunity that Smart Money used to partially lock in profits on long positions before the retracement began.
As shown, the pullback ended when the price entered the SSL zone. The bright red clusters indicate stop-losses of buyers following the uptrend being hit. Meanwhile, the formation of a lower low (LL) could be interpreted as a Change of Character (ChoCh). However, as discussed in our article on ChoCh, this pattern can sometimes lead to a trend continuation (as seen in this case with the uptrend).
Using the Smart Money Concept methodology, traders could identify the Fair Value Gap and join the trend continuation during the FVG test.
Example of a Liquidity Sweep in Crypto
The screenshot below displays a Reversal chart from the ATAS platform, applied to Bitcoin futures. Below the price area, we can see the Speed of Tape indicator. It provides an interesting way to track liquidity sweeps.
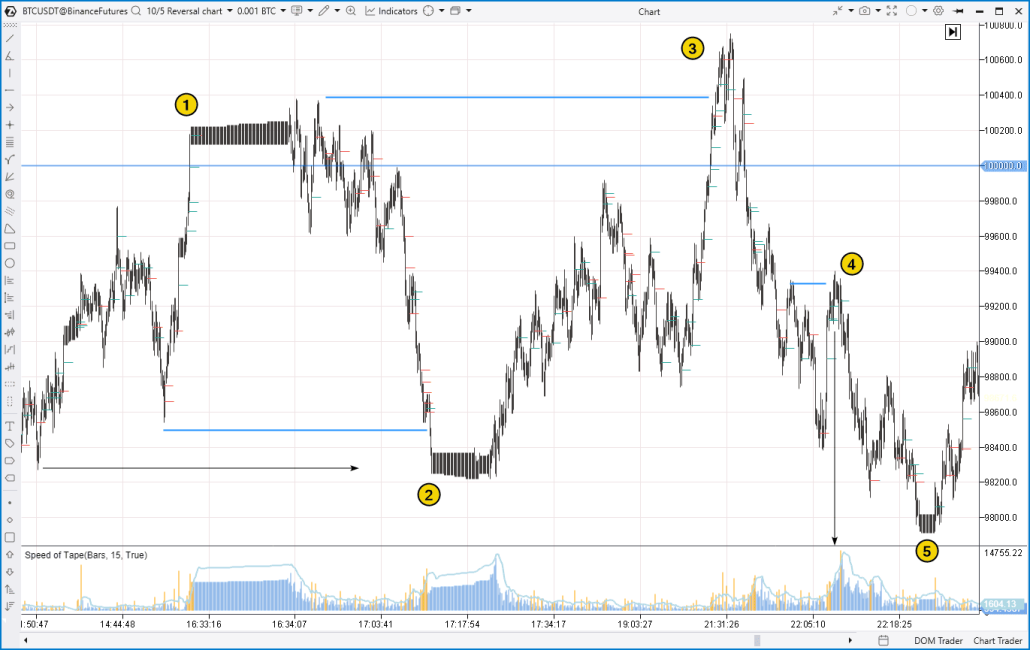
(1) As the price broke above a psychological level, we can see an anomaly: candles formed rapidly (confirmed by the Speed of Tape indicator), creating a pattern that looks like a “fence” or “accordion.” This likely resulted from a spread expansion, triggered when the price hit a cluster of short-sellers’ stop-losses positioned above what seemed to be strong resistance at the $100K psychological level. In other words, the price moved into a buyside liquidity zone, giving Smart Money an opportunity to adjust their positions before the subsequent price drop.
(2) A similar but mirrored event occurred when the price dropped below the previous local low.
(3) The price moved into the BSL zone, but this time, the “fence” or “accordion” pattern did not appear. However, it is unlikely that the area above the previous high was free of short sellers’ stop-loss clusters.
(4) A brief move into the BSL zone above the previous local high before continuing downward toward the SSL zone (5).
Liquidity Sweep Trading Strategy
The Smart Money Concept (SMC) methodology is a comprehensive approach in which a liquidity sweep is just one component for a deeper analysis of price reversals, the role of stop-losses, and the interaction between institutional and retail traders.
To identify entry points, it is advisable to incorporate other SMC elements, including Structure Analysis, Fair Value Gaps, Order Blocks, and more. It is also important to apply supply and demand principles and look at cause-and-effect relationships.
For a liquidity sweep trading setup, treat the sweep as context rather than an automatic entry. Confirmation can come from price rejecting the swept level, a Market Structure Shift (MSS), or supporting footprint and Delta behavior. An entry can then be considered on a retest of the confirmed area, such as an Order Block or Fair Value Gap.
- Stop-loss: place it beyond the sweep extreme or another level that clearly invalidates the setup.
- Take-profit: use the next meaningful liquidity zone or an opposite-side liquidity pool as a logical target.
- Invalidation: if price accepts beyond the swept level and continues in the breakout direction without rejection, the reversal thesis is weakened or invalidated.
Example. The screenshot below shows an ES futures chart. Using the SMC approach, where would be a reasonable place to enter long and short positions?
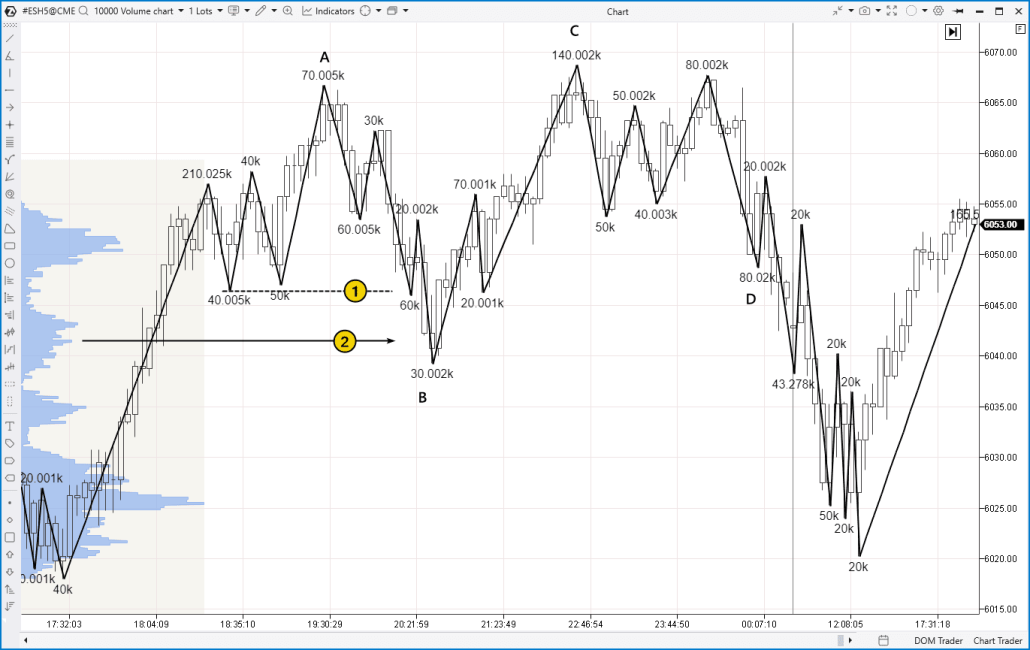
A long entry is visible when the price drops below level (1). This area likely contained stop-losses from buyers – in other words, the price visited the SSL liquidity zone. Smart money took out this liquidity, using it to open long positions:
- the stop-losses of buyers were placed below the local lows. The lows appeared reliable when the price rose to peak A;
- the stop-losses of buyers were located in the break-even zone for positions opened around 18:04 at the convexity level on the profile (2).
During the rise from the low at point B, traders could switch to a lower time frame to look for an entry point, such as a test of an Order Block or an FVG.
It can be seen that the high at point C barely exceeds the high at point A – a sign that the bullish trend is losing momentum. From the SMC perspective:
- the rise to C represents an entry into the BSL liquidity zone;
- the decline to the low at point D signals a bearish ChoCh, which then evolved into a bearish Market Structure Shift (MSS).
This setup looks reasonable for a short entry. However, it was nighttime on the chart. The entry opportunity appeared later (below is the same market with data from the following day and a footprint profile):
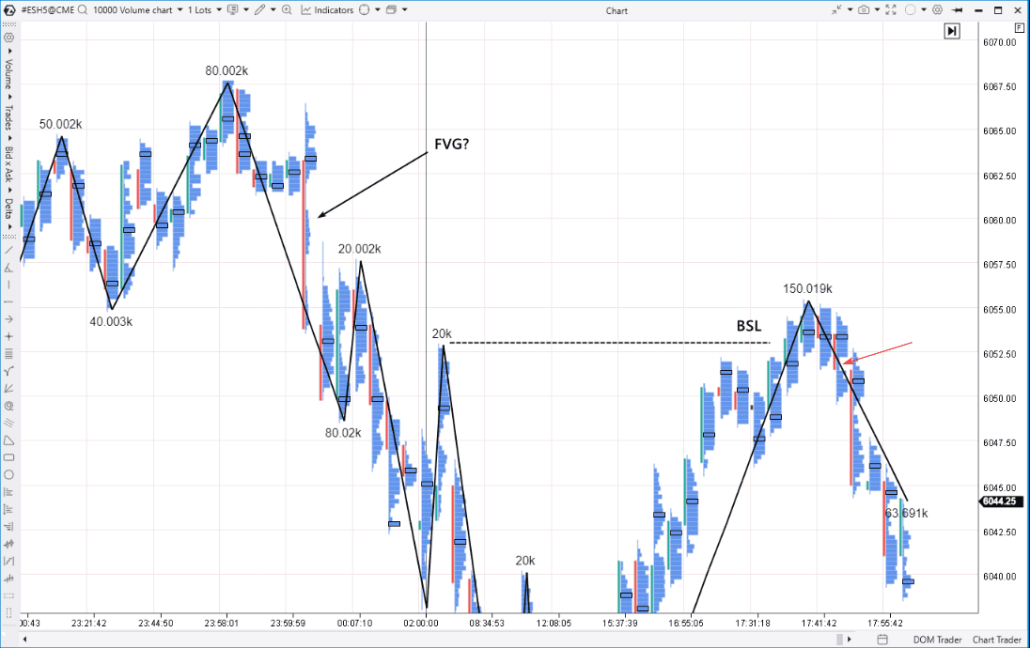
The arrow points to a gap that occurred during the price drop. However, we have marked it with a question mark because there is some doubt about whether this can be considered a valid FVG, given that it formed in low volatility during the session transition at midnight.
However, there is little doubt when it comes to the validity of the liquidity sweep pattern, where the price rose above the high of the Asian session, entering the buyside liquidity zone and giving traders (with increased confidence, considering the price behavior in the previous session) a reason to look for a short entry. The entry point is visible on the profile (marked by the red arrow) – likely, on lower time frames, more clear signs of an FVG would appear.
How to Trade a Liquidity Sweep Step by Step
Let’s summarize the steps for trading based on the liquidity sweep signal.
Step 1. Identifying the trend direction
- Analyze higher time frames.
- Review the daily market profiles.
- Assess the market structure.
Step 2. Locating liquidity zones
Identify potential liquidity zones as reference points for price movement targets, focusing on:
- swing lows and highs;
- volume indicator readings;
- other market analysis tools available on the ATAS platform.
Then, wait for the price to visit the liquidity zone.
Step 3. Observing order blocks and fair value gaps
When there are confirmations (for example, from footprint analysis), plan the trade entry, aligning it with the intentions of the institutional players.
According to the Smart Money Concept methodology, it is important to focus on:
- Market structure shifts to confirm the accuracy of your analysis.
- FVG as a potential entry zone when it gets tested.
- Order Blocks as another option (but not the only one) for entering the trade.
Step 4. Executing Trades
- Enter only after the sweep has been confirmed by the chosen market structure or volume signal.
- Set a take-profit target near the opposite liquidity zone.
- Place a protective stop-loss beyond the sweep extreme or another level that invalidates the setup.
- Treat sustained acceptance beyond the swept level as invalidation rather than assuming that every sweep must reverse.
After that, monitor your position, adding volume if needed or adjusting the stop-loss to lock in profits.
Learning to Trade Liquidity Sweep
Trading based on a liquidity sweep requires considerable experience to confidently identify liquidity zones in different market conditions. The ATAS platform provides all the tools you need to improve your market analysis and gain a competitive edge when trading with the Smart Money Concept strategy:
- Historical data and market visualization. ATAS enables you to load detailed tick history and study price and volume patterns during trend reversals in liquidity zones.
- Advanced indicators for confirmation. Use ATAS tools like footprint charts, cumulative delta, and vertical and horizontal volumes to confirm that institutional players are “sweeping liquidity.” These tools also help you identify the best entry points.
- Market replay training. Practicing with a market simulator is one of the best ways to hone your skills. Use ATAS’s Market Replay feature to replay historical data in real time, track liquidity sweeps, trade them on a demo account, and analyze your mistakes without risking your capital.
To try the simulator, download the ATAS platform for free, install, and launch it, and then:
- Open a chart of a financial instrument.
- Click on the Market Replay button in the main ATAS menu.
- Activate the Replay mode (the icon should turn green).
- Adjust settings (date and data type).
- Start the replay and practice analyzing liquidity zones, simulating real-time market trading.
- Spotted a setup? Trade it!
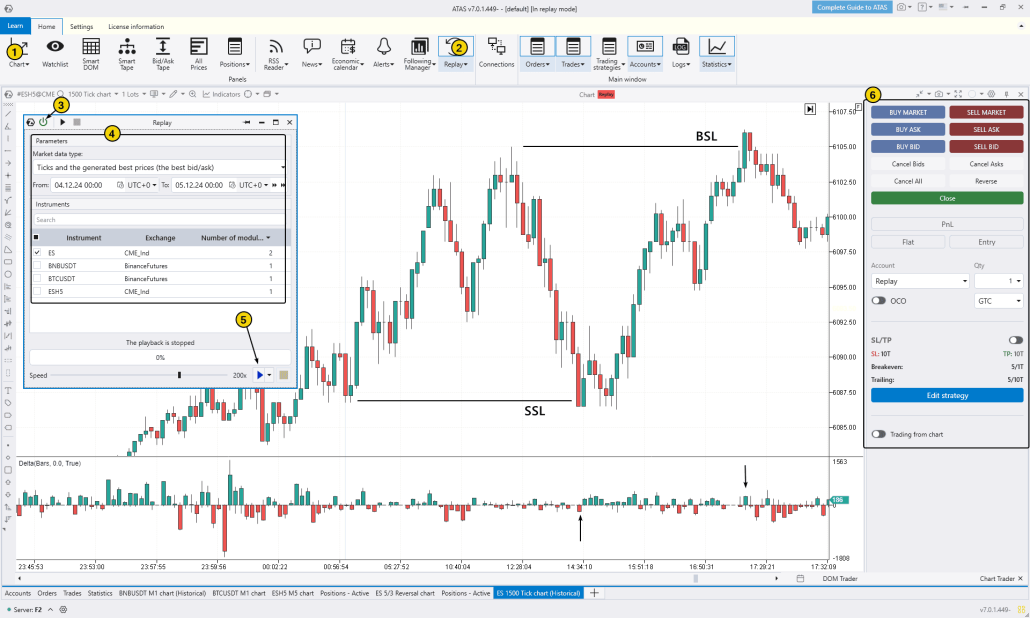
The chart above shows two more examples of the liquidity sweep pattern:
- Bullish, when the price dropped below the low of the Asian session;
- Bearish, when the price broke the day’s high.
You can confirm this using the Delta indicator (as highlighted by the arrows)—in the first case, a negative delta does not lead to further downward movement, and in the second case, a positive delta does not lead to a continuation of the upward trend.
We hope this article was helpful, and now you have a clear understanding of what the liquidity sweep is.
FAQs on Liquidity Sweep
Liquidity is a fundamental concept in trading, and we have covered it in detail in our article: What Is Liquidity in Trading? In the Smart Money Concept, a liquidity sweep occurs when price moves beyond a level where stop orders are likely concentrated, such as a previous high or low, and then rejects that area. Traders use the sweep as context for a potential reversal, but confirmation from market structure, volume, or order flow is still required.
In the ICT (Inner Circle Trader) strategy, major players look for liquidity in areas where retail traders’ stop orders are clustered. These zones are typically found beyond swing highs, swing lows, and key support or resistance levels. Since market movements are algorithmic, the price is drawn to these zones to trigger stop orders, create a liquidity surge, and provide Smart Money with optimal entry opportunities.
A liquidity sweep occurs when price moves through a level where orders are concentrated, such as above a previous high or below a previous low, and triggers those orders. Price may then reject the level or continue in the same direction, so traders typically look for additional confirmation before treating the sweep as a reversal setup.
- Wait for price to reject the swept level instead of entering immediately after the breakout.
- Look for confirmation from market structure, footprint data, Delta, or another method used in your trading plan.
- Consider an entry on a confirmed retest, and define the stop-loss, target, and invalidation level before entering the trade.
Traders following the Smart Money Concept look for liquidity sweeps as potential reversal points in the market. To spot these, they watch for the price breaking key swing highs or lows, then losing momentum and forming reversal signs after a false breakout. Once the liquidity sweep has been found, traders are advised to wait for a Market Structure Shift (MSS). The entry is often made on a retest of an Order Block or Fair Value Gap (FVG).
The processes we described above are known as a liquidity sweep, but the term liquidity grab is also used to refer to the same concept.
That said, there are some nuances. Some sources highlight a difference between a liquidity sweep vs a liquidity grab:
- A liquidity grab happens when the price quickly breaks through a level containing liquidity.
- A liquidity sweep occurs when the price enters a liquidity zone and stays there for a while, forming a trading range.
The distinction between these terms is not always clear, especially depending on the chosen timeframe.
There is no single best timeframe for liquidity sweeps. Higher time frames can help identify the broader market structure and important liquidity zones, while lower time frames can provide more detailed confirmation and entry timing. The most suitable combination depends on the instrument, volatility, and the trader’s strategy.
ICT (Inner Circle Trader) is the alias of Michael Huddleston, an American trader who runs a popular YouTube channel focused on trading education. He developed the Smart Money Concept (SMC) strategy, which revolves around analyzing market structure and the actions of major market players. This method places particular focus on liquidity zones, Fair Value Gaps (FVG), Order Blocks, and the idea that price movements follow algorithmic patterns.
You can learn more about this in the article: What Is the Smart Money Concept and How Does the ICT Trading Strategy Work?
Pros and Risks of Liquidity Sweep Trading
Pros
|
Risks
|
Conclusion
Using the liquidity sweep pattern helps traders better understand the intentions of major players (Smart Money) and gain insight into the causes and mechanisms behind price reversals. Recognizing a liquidity sweep on a chart can be a strong basis for entering positions at the start of new trends or taking profits.
With access to detailed tick history, Market Replay, footprint charts, and market profile tools, ATAS gives traders a significant edge in analyzing the liquidity sweep pattern. These tools enable traders to closely study the relationship between price movement and trading volume, sharpening their skills to identify high-potential entry points. ATAS’s analysis features offer a deeper understanding of market behavior, helping traders confidently track price action from one liquidity zone to another.
Download ATAS. Once you install the platform, you will automatically get the free START plan, which includes cryptocurrency trading and basic features. You can use this plan for as long as you like before deciding to upgrade to a more advanced plan for additional ATAS tools. You can also activate the Free Trial at any time, giving you 14 days of full access to all the platform’s features. This trial allows you to explore the benefits of higher-tier plans and make a well-informed purchasing decision.
Information in this article cannot be perceived as a call for investing or buying/selling of any asset on the exchange. All situations, discussed in the article, are provided with the purpose of getting acquainted with the functionality and advantages of the ATAS platform.
Subscribe
Get the latest ATAS news delivered conveniently