Basics of Volume Analysis
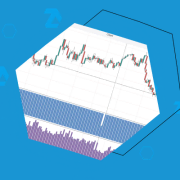
Tick Charts in Simple Terms
/in Basics of Volume Analysis, Volume AnalysisTick volume is one of the volume indicators that provides a deep understanding of market dynamics, giving a competitive advantage in the market. This article delves into the nuances of using tick volume and tick charts within the ATAS platform. Read more: What Is Tick Volume? The Tick Volume Indicator What Is a Tick Chart? […]
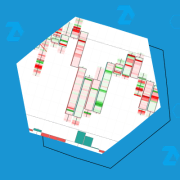
How to Read Footprint Charts and Use Clusters
/in Basics of Volume Analysis, Volume AnalysisFootprint is a format of the exchange chart that accurately displays information about executed trades, including time, price, volume of buys and sells. This article aims to help traders gain a competitive advantage using footprint charts. Beginners will be able to quickly progress along the learning curve, while more experienced traders will find new ideas […]
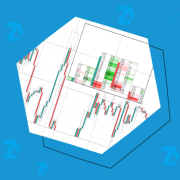
Cluster Analysis in Layman’s Terms
/in Basics of Volume Analysis, Volume AnalysisThis long read is dedicated to cluster analysis and is aimed at beginners. In the article, you will find a simple explanation of cluster analysis of market volumes, its purposes and applications. Read more: What Is Cluster Analysis in Trading? Special Features of Cluster Analysis Settings of Cluster Charts How to Analyze Cluster Charts Cluster […]
CVD Pro. How to Use the Cumulative Volume Delta
/in Basics of Volume Analysis, Volume AnalysisDuring one of the updates in the ATAS platform in 2023, the Market Power indicator was renamed to CVD Pro. The full name of the indicator is Cumulative Volume Delta. It is widely used by traders when analyzing volumes. Read this article to find out: The core aspects of delta and cumulative delta Comparison of […]
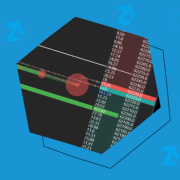
What Does the Depth of Market Indicator Show?
/in Basics of Volume Analysis, Volume AnalysisThe indicator name is Depth of Market. It is also known as Market Depth, Level 2, or Order Book. It is a powerful market analysis tool in trading. How it can be useful to you, and how to work with it in ATAS – read this article: The core concept of the Depth of Market […]
Pros and cons of volume analysis
/in Basics of Volume Analysis, Volume AnalysisVolume analysis is an important tool in a trader’s arsenal, but it requires a deep understanding of how to interpret volume dynamics in relation to price. If you are a beginner trader and have not yet tried volume analysis, this article will help you decide whether you should study it (spoiler: definitely yes). What do […]
Trading volume levels with the Maximum Levels indicator.
/in Basics of Volume Analysis, Volume AnalysisHow to learn how to read footprints from scratch
/in Basics of Volume AnalysisThis article is mostly for those traders who have just started to study trading by cluster charts. A beginner should develop own understanding of how to read footprint correctly. We speak here both about training of visual perception, that is, how to find necessary information in the chart, and about training of analytical skills in […]