
The Fixed Range Volume Profile indicator is a derivative of the market volume profile. It builds a histogram that displays the distribution of traded volumes across price levels over a fixed time range.
The Fixed Range Volume Profile is widely used in professional trading for precise volume analysis within a selected period and is, of course, included in the ATAS platform’s toolkit. This article provides a detailed overview of its features and potential applications in trading.
Start now!
Try ATAS free with no time limit
Fixed Range Volume Profile Explained
In the ATAS analytical platform interface, the Fixed Range Volume Profile (FRVP) indicator is referred to as the Anchored Volume Profile. This name was chosen to distinguish it from a similarly named tool — Fixed Market Profile & TPO. This distinction will become clearer later when we compare the different types of available volume profiles.
The Fixed Range Volume Profile is an analytical tool that displays how trading volumes were distributed across price levels over a specified period of time. The data is presented on the chart as a horizontal histogram.
The term Fixed Range means that the user manually selects two points on the chart:
- the starting point of the profile;
- the ending point of the profile.
Fixed Range Volume Profile vs Visible Range Volume Profile
The key difference between Fixed Range Volume Profile and Visible Range Volume Profile is how the analyzed period is defined. FRVP remains tied to the start and end points manually selected by the trader, so the same market segment stays under analysis regardless of how the chart is displayed.
Visible Range Volume Profile, by contrast, automatically recalculates the volume distribution based on the part of the chart currently visible on the screen. When the trader scrolls or zooms the chart, the analyzed range changes as well. This makes FRVP particularly useful when the goal is to keep focusing on one specific price move or trading period.
When Traders Use Fixed Range Volume Profile
Traders use the Fixed Range Volume Profile when they want to isolate volume activity within a specific market segment. Typical examples include a completed trend leg, a consolidation range, a strong news-driven impulse, a previous trading session, or a pullback within an existing trend.
By fixing the profile to these boundaries, traders can examine where the largest volumes were concentrated and identify important areas such as POC, HVN, and LVN within that particular move. These levels can then provide additional context when analyzing future price reactions, support and resistance, or the possible continuation of a trend.
Example of Fixed Range Volume Profile
Below is an example of how the indicator appears on a chart of Nasdaq 100 futures:
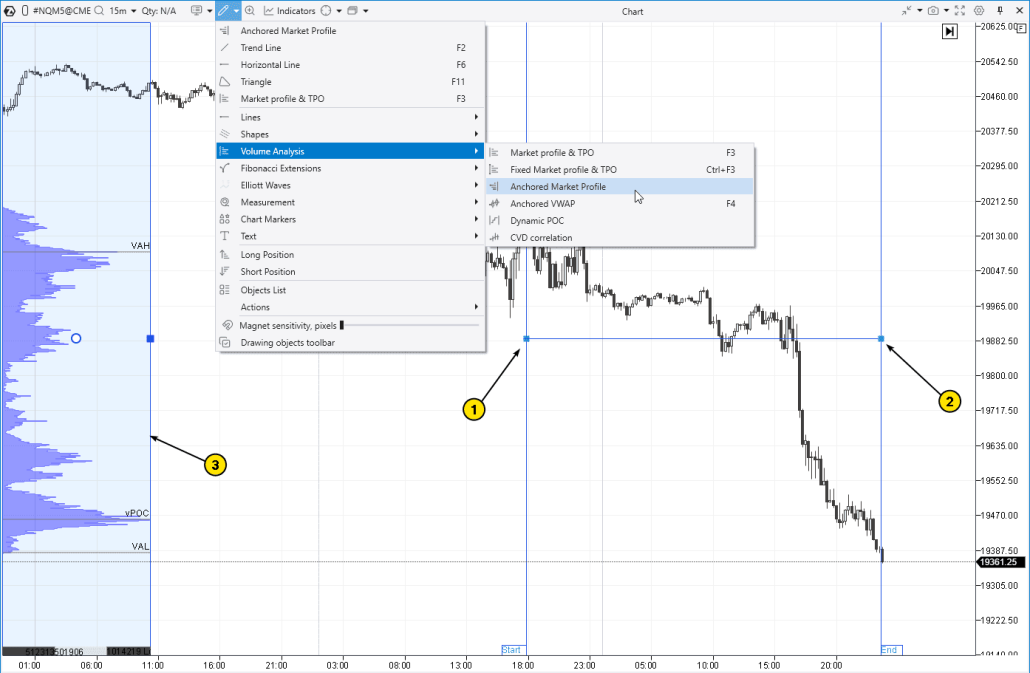
In this case, the Anchored Market Profile tool is used to build a volume profile over a fixed time range. The profile covers a section of the chart during a decline in the futures price.
The FRVP indicator is used for analyzing stocks, futures, and cryptocurrencies across various time frames.
How to Add Fixed Range Volume Profile to a Chart
- Open the Drawing Objects menu on the top panel of the chart.
- In the Volume Analysis section, select the Anchored Market Profile tool.
Then:
- Use the mouse to set the starting point — Begin (the left boundary of the range, point 1).
- Then set the ending point — End (the right boundary, point 2).
The platform will display the profile (3) on the left side of the chart. You can move it to any convenient position on the chart and adjust its settings as needed. The boundaries can be moved with the mouse — the profile will automatically update accordingly.
A key feature of the Fixed Range Volume Profile indicator. An important feature of the Anchored Market Profile is that the profile remains fixed on the screen. You can scroll the chart left or right, and the histogram will stay in place, as if on its own “layer.” In other words, it is not “attached” to the candlesticks. This offers greater flexibility in analyzing how the profile interacts with different chart scales. For example, FRVP allows you to keep a profile from a key time range of the previous day visible on today’s chart, which can be helpful in various situations.
How to remove the FRVP indicator? Simply select the indicator and press Delete; alternatively, you can use Delete from the context menu (right-click).
How Fixed Range Volume Profile Calculates Volume at Price
The accuracy of constructing the Fixed Range Volume Profile using the Anchored Market Profile drawing tool is a distinctive advantage of the ATAS platform. When creating the histogram, tick data is used, capturing every individual trade. If enabled in the settings, the volume is broken down into bid and ask trades.
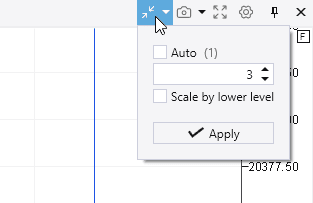
If the level of detail in the Fixed Range Volume Profile is too high, you can use the Scale tool (located on the right side of the top chart panel) to combine multiple price levels into one (in other words, to adjust the price step).
The speed of construction is another advantage you gain with this tool if you download the ATAS platform.
Components of the Fixed Range Volume Profile
The main element of the indicator is a horizontal histogram. The length of the bar at each price level represents the trading volume: the longer the bar, the higher the volume traded at that level. This format helps quickly assess where market activity was concentrated during the selected time period.
- Histogram peaks, also called High Volume Nodes (HVN), indicate high trading activity across several adjacent price levels.
- Thin profiles or Low Volume Nodes (LVN) represent levels where trading activity was low.
By default, the histogram displays:
✔ Point of Control (POC) — the price level with the highest trading volume within the selected range.
✔ Value area boundaries — the upper boundary (VAH) and the lower boundary (VAL).
✔ Statistics — displayed at the bottom of the indicator.
✔ Histogram background — improves visual clarity.
These elements play a key role in interpreting the Fixed Range Volume Profile, which we will explore in more detail below.
| Component | Meaning | How Traders Use It |
|---|---|---|
| Point of Control (POC) | The price level with the highest traded volume within the selected range. | Highlights a key area of market activity that traders may monitor for future price reactions. |
| Value Area (VA) | The price range where most of the trading volume was concentrated. | Helps identify the main area of price acceptance within the analyzed range. |
| Value Area High / Low (VAH / VAL) | The upper and lower boundaries of the Value Area. | Used as reference levels when analyzing support, resistance, breakouts, and returns into the value area. |
| High Volume Node (HVN) | A profile area with relatively high trading volume. | Shows zones where trading activity was concentrated and where price may slow down or react. |
| Low Volume Node (LVN) | A profile area with relatively low trading volume. | Highlights zones where price previously moved with less trading activity and may move through more quickly. |
Comparison of FRVP with Other Indicators
The ATAS platform provides several tools for working with the market profile. Although all of them are based on the same principle — displaying volume at price levels — each is designed to solve a specific analytical task.
To choose the most suitable tool, it is important to understand the characteristics of each. Below, we will review the main types of volume profiles available in ATAS and explain when and how each one should be used.
| Tool | What It Shows | Range | Best Suited For |
|---|---|---|---|
| Fixed Range Volume Profile (FRVP) | Volume distribution across price levels. | Manually selected start and end points. | Analyzing a specific trend leg, consolidation, impulse, pullback, or other selected market segment. |
| Volume Profile | Volume traded at different price levels. | Depends on the selected profile settings or chart area. | Identifying POC, Value Area, HVN, LVN, and important volume zones. |
| Session Volume Profile | Volume distribution within an individual trading session. | Usually resets for each session. | Comparing session structure, value areas, POC, and intraday reference levels. |
| Market Profile | Market activity organized by price and time. | Typically built for predefined periods or sessions. | Studying market structure, balance, acceptance, and distribution over time. |
| TPO | How much time the market spent at different price levels. | Built from predefined time periods. | Analyzing price acceptance and market structure rather than traded volume alone. |
| Footprint | Detailed traded volume, bid/ask activity, and other order-flow data inside individual bars. | Displayed bar by bar. | Examining order flow and confirming activity at specific price levels with greater detail. |
| Anchored VWAP | The volume-weighted average price calculated from a selected starting point. | Anchored to a specific event or point on the chart. | Tracking the average traded price from a swing, breakout, session start, or other important event. |
Fixed Range Volume Profile and Other Profile Drawing Tools
To create a Fixed Range Volume Profile on the chart, you should use the drawing tool called Anchored Volume Profile.
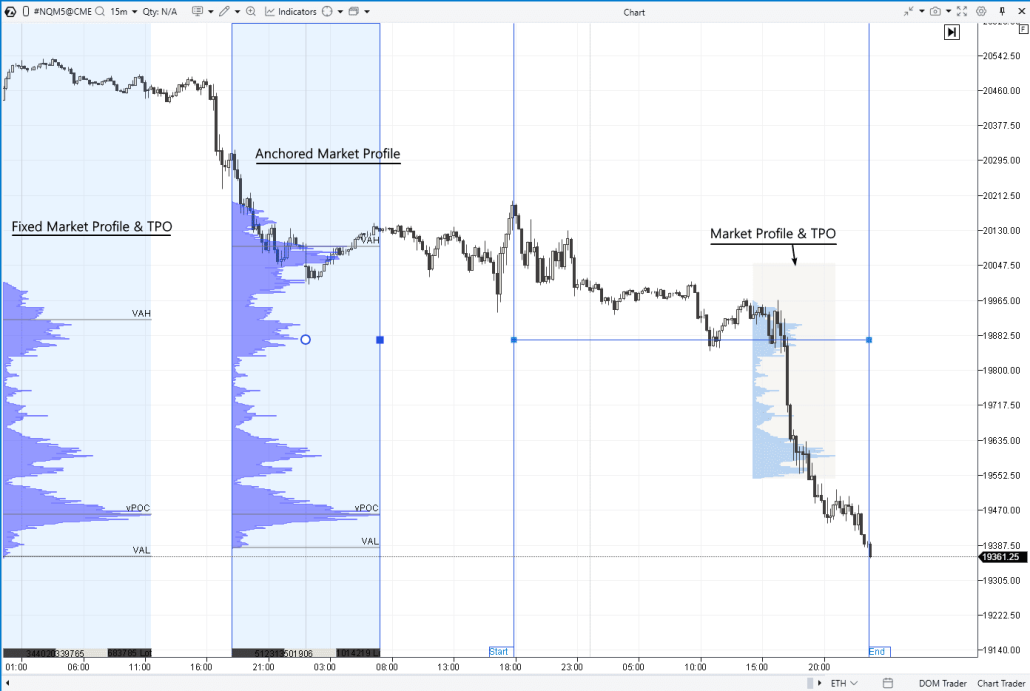
The screenshot above shows three profile drawing tools used on the same chart:
✔ Anchored Volume Profile allows you to build the Fixed Range Volume Profile using two anchor points — one on the left and one on the right.
✔ Fixed Volume Profile is, by default, anchored to the left side of the chart and creates a profile for the current day. Shortcut key — Ctrl+F3.
✔ Volume Profile is a dynamic and very user-friendly tool. It can be activated with the F3 hotkey and quickly creates an accurate profile for any area you simply highlight with your mouse.
You can add as many profiles to the chart as needed. Each profile created using the drawing tools can be further customized. A detailed guide is available in the Knowledge Base, explaining how to work with profiles, including accessing settings, copying, deleting, and other operations.
Fixed Range Volume Profile: Comparison with Other Profiles and the Footprint
In the screenshot below, in addition to the Anchored Volume Profile, the following tools are also displayed:
- profiles within candles — to enable them, switch the chart to footprint mode (press Shift+K or stretch the chart along the time axis with your mouse);
- standard Volume Profile & TPO indicator — it is added via the indicator manager (Ctrl+I or through the menu on the top chart panel).
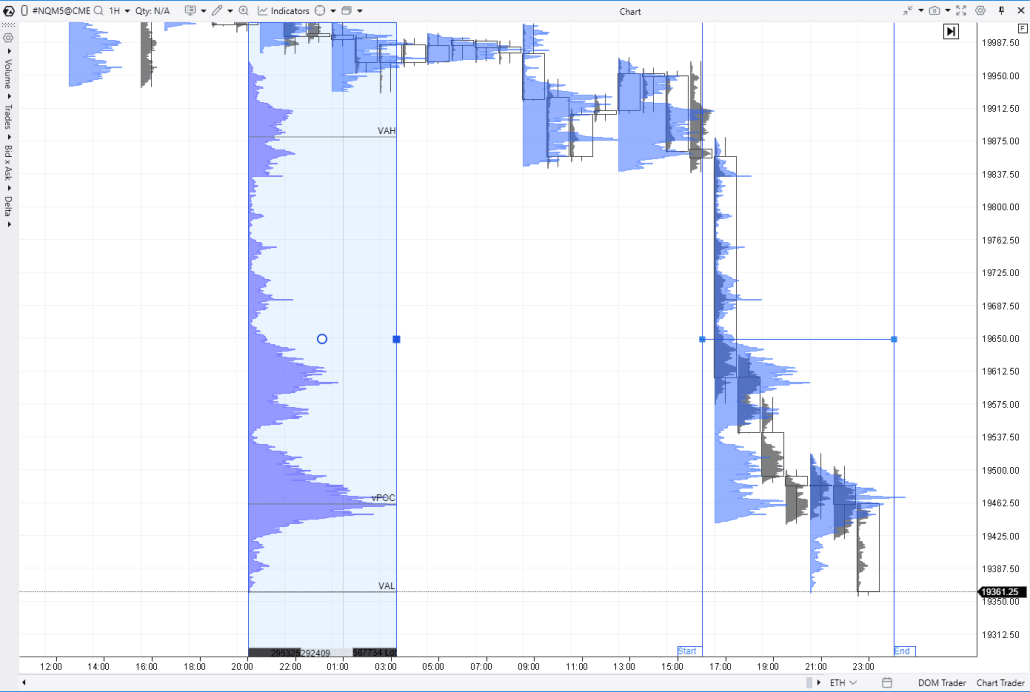
You can select the most appropriate tool based on the specific analytical tasks related to volume distribution across price levels.
The Anchored Volume Profile is a valuable option when you want to focus on a specific key range of the chart and manually define its boundaries. For this purpose, the standard Volume Profile & TPO may be less effective, as it automatically builds multiple profiles at equal time intervals.
FRVP Settings Configuration
The Anchored Volume Profile offers the same comprehensive set of settings as the standard Volume Profile & TPO indicator in the ATAS platform.
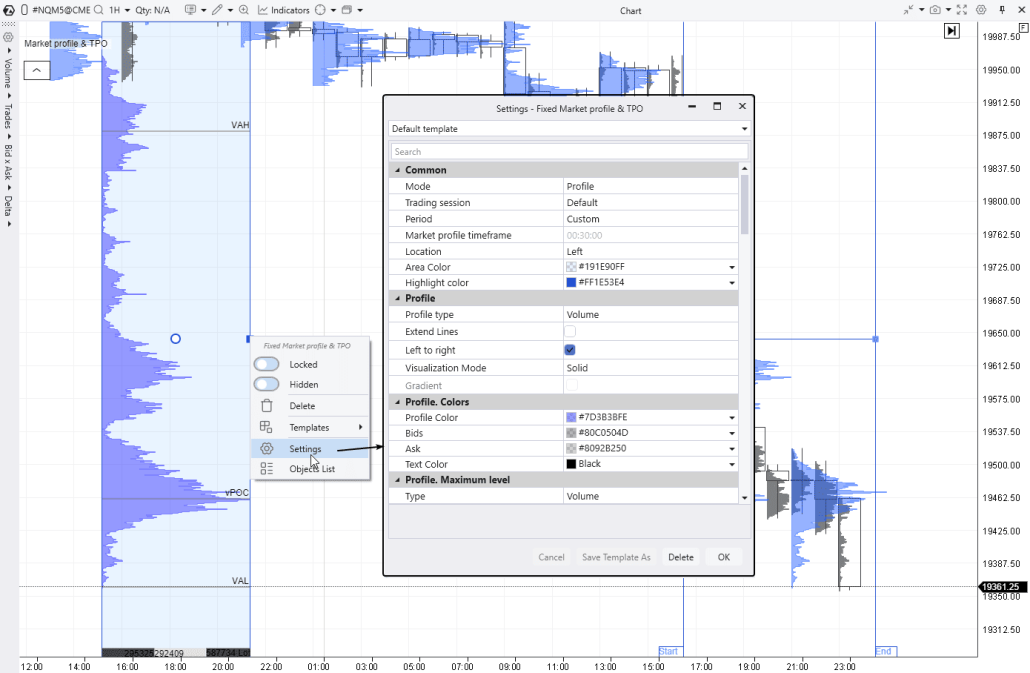
We have previously covered these settings in detail — you can review them in the relevant materials.
- Video: Overview of Market Profile & TPO Indicator Settings
- How the Market Profile Indicator Works
- Description of Market Profile & TPO Settings in the Knowledge Base
Now, let’s proceed to the most interesting part — the practical application of the Anchored Volume Profile in making trading decisions.
How to Read Fixed Range Volume Profile Signals
The volume profile of exchange-traded activity highlights price areas, helping traders identify zones of high and low trading activity and analyze where the market has spent significant time versus where price has moved quickly.
By observing how the profile evolves, traders gain valuable insights into how the market transitions from a trending phase to a consolidation phase.
Interpreting the Volume Profile
If a bulge appears on the volume profile — known as a High Volume Node (HVN) — it may indicate the following:
- The market is flat. Time is passing, but there are no strong drivers for price movement. Buyers and sellers remain inactive, adopting a wait-and-see approach and trading in minimal volumes.
- Both buyers and sellers are active, but the current price suits both sides equally. The efforts of supply and demand balance each other out, resulting in a high number of trades at this price and a corresponding increase in total volume.
A narrow (thin) profile, also referred to as a Low Volume Node (LVN), often indicates imbalances, since if one side dominates, the price is unlikely to remain at those levels for long.
Fixed Range Volume Profile Trading Strategies
Traders can analyze the market profile in conjunction with price and time to form assumptions about the dynamics of market sentiment and, based on these insights, develop trading ideas.
In general, building a strategy is a personal process that may lead to unique results depending on the trader’s individual approach. Below is a series of useful articles dedicated to volume profile trading strategies:
- How to Trade Using the Market Profile Indicator
- Trading by Levels with the Market Profile
- How to Start Using Volume Profile
- Trading Strategy: Test Mini-POC
Let’s now explore a few examples of trades using the FRVP indicator.
Using FRVP for Support and Resistance Trading
The FRVP indicator provides valuable insights into how price reacts to:
- HVN protrusions, including peak values (local POCs);
- LVN dips, where the profile is narrow;
- Sharp shifts (“steps”) in the profile.
Such observations offer traders strong arguments for developing trading ideas, including the use of HVN and LVN zones for support and resistance trading.
Example. The chart below displays the Fixed Range Volume Profile capturing a period of decline in the NDX futures contract (on the left side of the chart). Let’s explore how the prominent features of this profile acted as resistance levels when the downtrend transitioned into a temporary recovery.
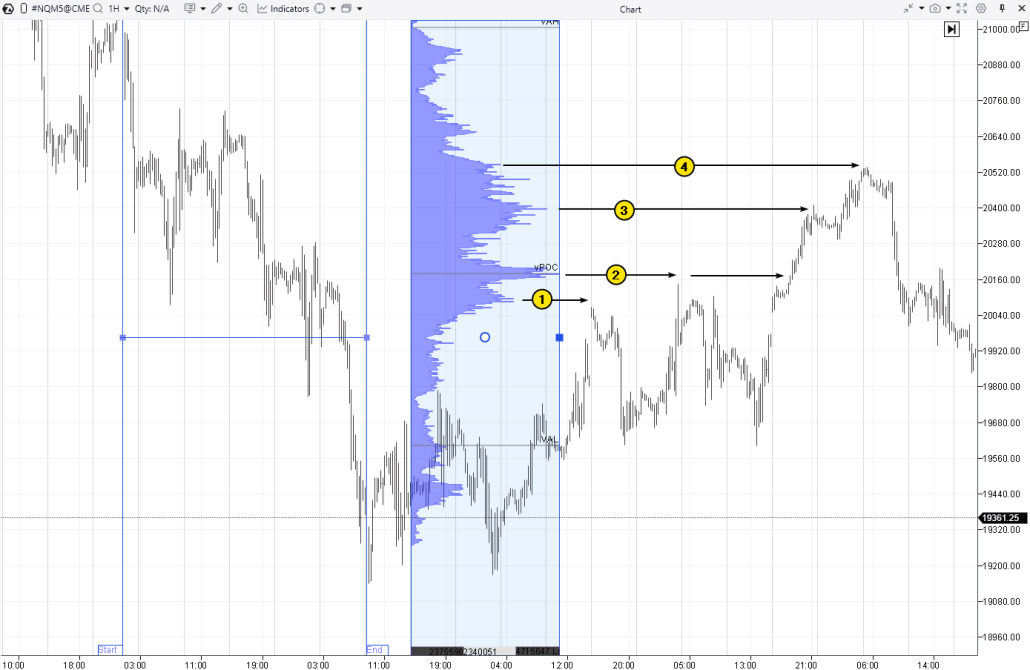
Number (1): The local POC acted as resistance at the market open following a bullish gap after the weekend.
Number (2): A classic example of how the Point of Control can influence price movement.
Number (3): The local POC stopped the price rise at the end of the “bullish day.”
Number (4): The step (a sharp drop on the profile) served as resistance and led to a subsequent price decline. This suggests that the rally from the breakout at the point marked by arrow 2 up to the peak near 20,520 was largely driven by the closing short positions opened during the price decline on the left side of the chart. Once that support faded, you can see what happened next.
POC Rejection Strategy
Although the example marked by arrow (2) on the chart above demonstrates how price can react to Point of Control levels identified using the Fixed Range Volume Profile indicator, it is worth emphasizing this pattern separately. It illustrates the effectiveness of horizontal volume analysis and is particularly helpful for beginner traders due to its clear and simple visual representation.
Example. DAX stock index futures.
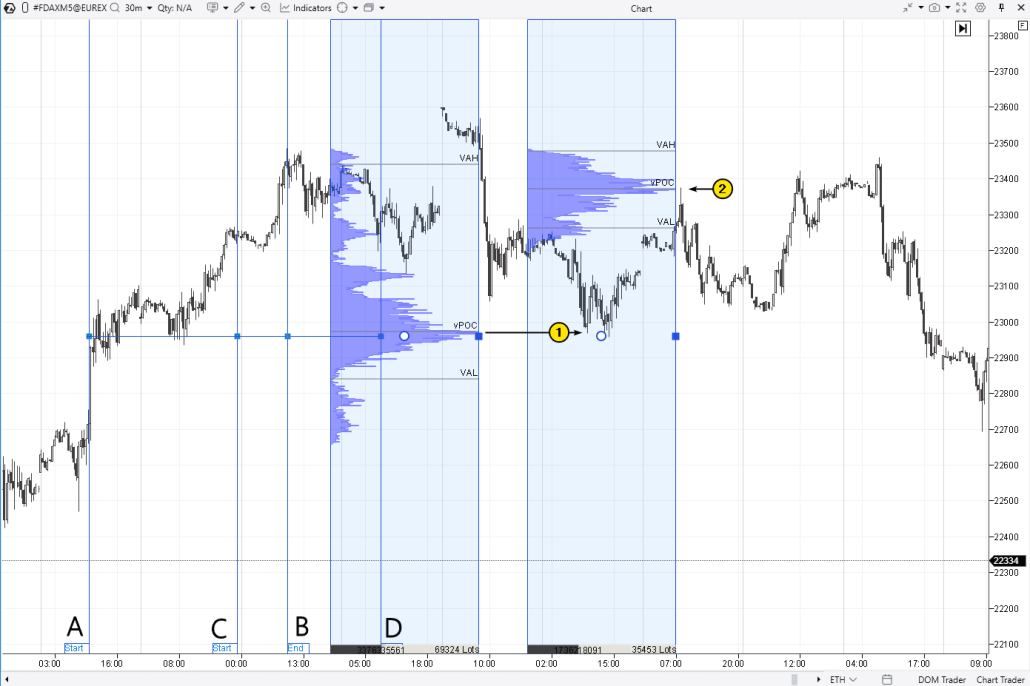
The Point of Control of the Fixed Range Volume Profile from A to B helped identify the entry level (1) for long positions. The Point of Control of the Fixed Range Volume Profile from C to D helped identify the entry level (1) for short positions.
Using the FRVP in Trending Markets
Trend trading is one method of using the market profile to identify favorable entry points that align with prevailing market sentiment. For example, during a sustained bullish trend, a trader may:
- use the market profile to identify support levels,
- wait for a pullback to confirm the setup,
- enter a position in the direction of the trend, anticipating the end of the pullback.
Example of trading. The screenshot below shows the gold price chart during a period of bullish sentiment amid geopolitical tensions. At this time, gold futures reached the historic milestone of $3,000 per ounce for the first time.
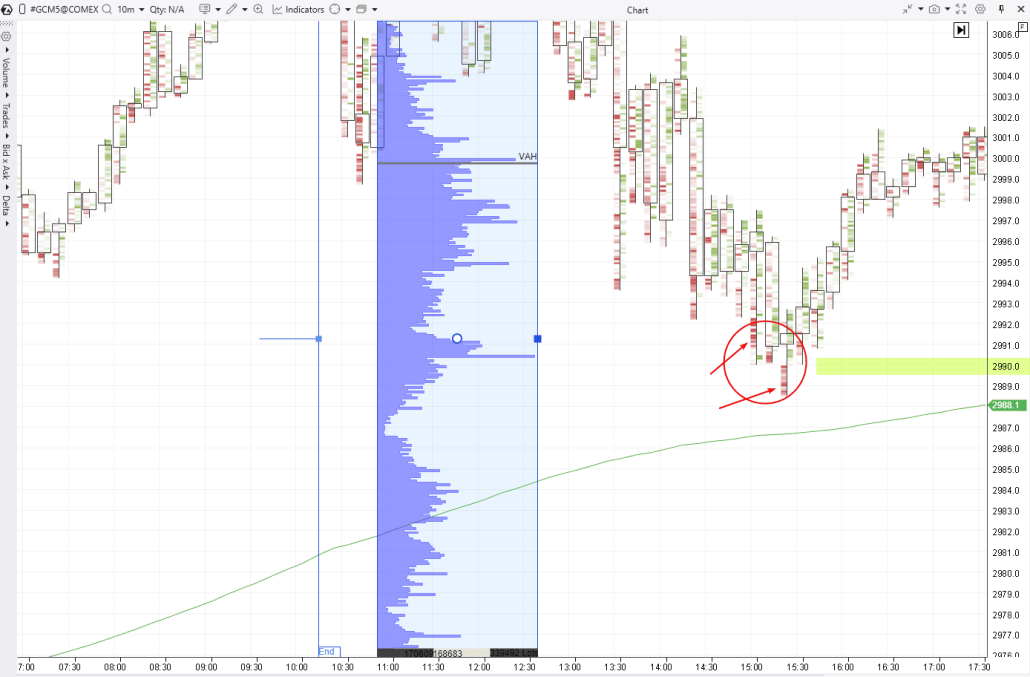
In this case:
- the moving average confirms the bullish trend based on data located beyond the left side of the chart;
- the anchor marked “End” indicates the right boundary of the time range (Fixed Range) used to build the profile.
Note that the HVN bulge around the 2990 level acted as support, which could be considered a valid level to anticipate a continuation of the uptrend. Here are the arguments supporting this approach:
- The 2990 level is a round number divisible by 10 and may act as a psychological level (with stop-losses from buyers placed below it).
- Bright red clusters on the lower wicks suggest stop-losses from buyers were triggered.
In this case, keeping the FRVP profile built for the prior price rally (outside the visible area of the chart) makes it easier to track the dynamics on the cluster chart and use them to identify the end of the correction.
Useful articles:
- The 50% Pullback in Trading: Reasons and How to Use It
- How to Identify the End of a Correction
- How to Read a Footprint Chart
- Trading Footprint Patterns
- Who Activates Your Stop-Losses, Why, and How
Common Mistakes When Using the Fixed Range Volume Profile Indicator
No trading tool can guarantee profits, and the FRVP indicator is no exception.
Poor Anchor Selection
The usefulness of the Fixed Range Volume Profile largely depends on where the starting and ending anchors are placed. If the selected range does not correspond to a meaningful market phase, the resulting profile may contain unnecessary noise and make important volume levels more difficult to interpret.
For clearer analysis, traders typically anchor the profile to well-defined market structures, such as a completed trend move, consolidation range, strong impulse, or trading session. Very short or arbitrarily selected ranges should be treated with caution, as a limited sample can distort the profile and cause levels such as the POC to change significantly.
Over-reliance on Historical Data
Let’s say you have identified a prominent Point of Control level on the chart. Expecting the price to bounce off this level (especially with tick-level precision) is a misconception. While price reactions to the POC are often accompanied by reversals, such behavior is neither guaranteed nor highly predictable.
Example. Bitcoin futures chart from BinanceFutures.
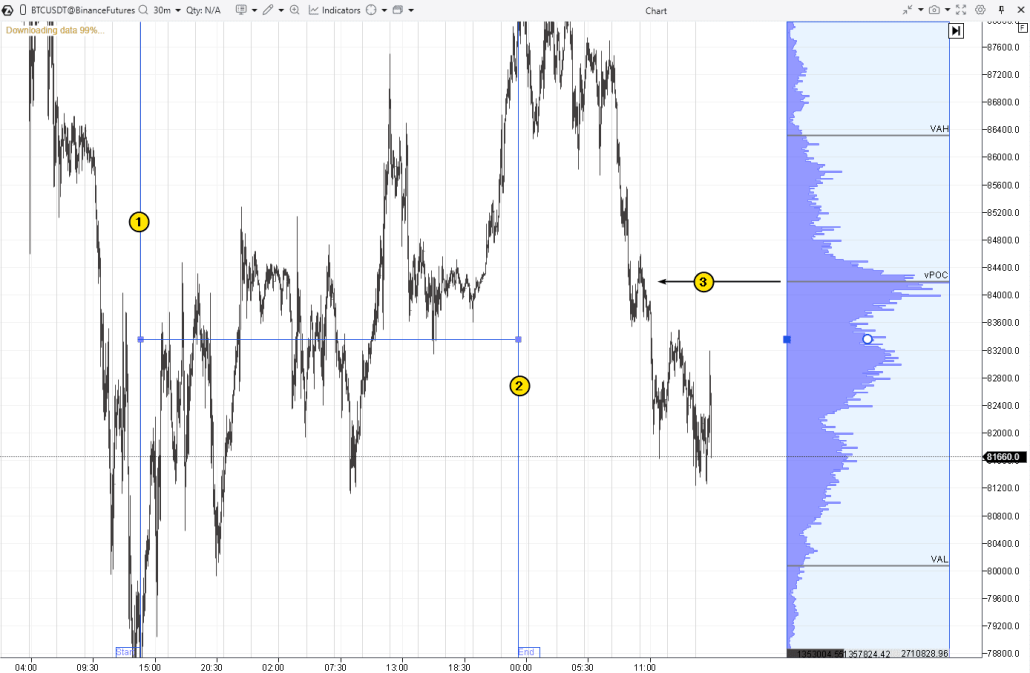
The volume profile for the range between Anchors (1) and (2), during which the price was rising, indicated a high-volume level (3). However, as you can see, during the subsequent decline, the price did not find significant support there. Instead of the expected rebound, only a zigzag movement followed, and the bears continued to exert pressure.
Misinterpretation of Volume Nodes
The volumes displayed in the histogram represent statistical data reflecting actual trading activity. Analyzing volumes is inevitably connected to forming hypotheses aimed at answering questions like: who is buying or selling (a strong or weak participant), and with what motives? In reality, it is impossible to be absolutely certain that any hypothesis is correct. However, consistent and diligent chart analysis helps develop skills that enhance the accuracy of interpreting irregularities in the FRVP profile.
Neglecting Other Market Indicators
The Fixed Range Volume Profile, like other tools used to build histograms showing the distribution of trading volumes across price levels, is a valuable instrument. However, this does not mean that other indicators are unnecessary.
The FRVP works well in combination with:
- vertical volumes (for example, the Cumulative Delta indicator);
- indicators such as the Speed of Tape, Big Trades, DOM levels, and others.
Combine indicators in a way that provides the most comprehensive understanding of how the market picture forms within a broader context.
More about ATAS indicators:
- A Brief Overview of 240 Indicators Available on the ATAS Platform
- Volume Indicators in Trading: How to Use Them
How to Avoid Mistakes
No trader can avoid losses entirely. A loss is not necessarily a mistake but an inherent part of trading. However, to raise your professional level and thereby reduce the frequency of losses, you can use the ATAS Market Replay feature, which enables you to practice in real market conditions without any risk.
Advantages of Market Replay in ATAS:
- Built-in demo account. It enables you to replay historical data, simulating a live market environment. This is an excellent way to learn trading and test strategies without risking real money.
- Database. ATAS supports loading detailed tick history, including market depth data (Level II), for stocks, futures, and cryptocurrencies.
- Advanced tools. Use ATAS’s advanced features, such as Anchored Volume Profile, to gain a real trading advantage and analyze market dynamics more precisely.
To launch Market Replay in ATAS:
First, download the ATAS platform for free, install and launch it, and then:
- Open a chart of a financial instrument.
- Click on the Market Replay button in the main ATAS menu.
- Activate the Replay mode (the icon should turn green).
- Adjust settings (date and data type).
- Start the replay and analyze the profiles.
- Have you spotted the setup? Trade using the Chart Trader panel.
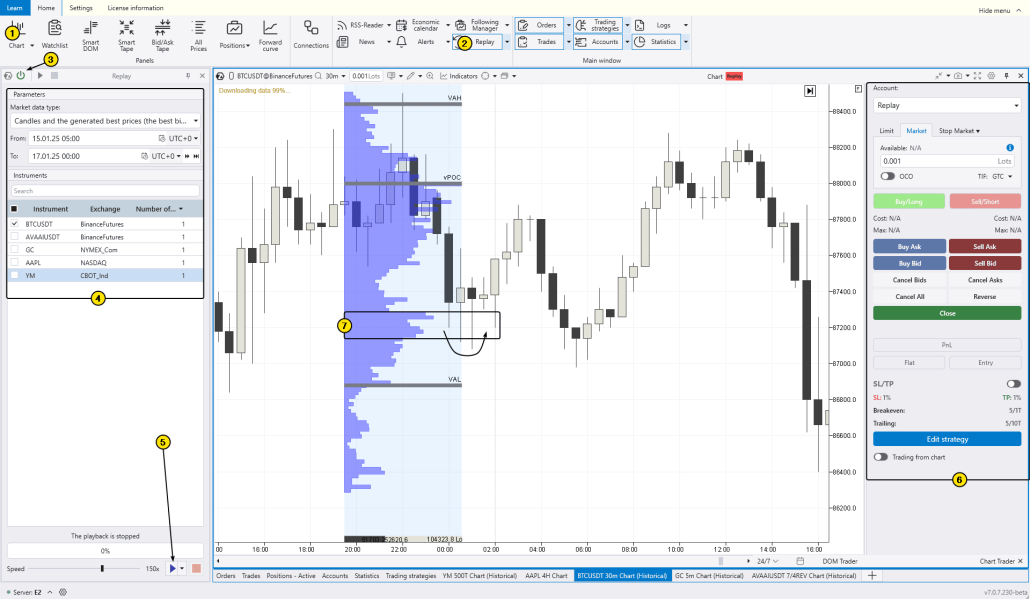
The chart above shows the FRVP indicator displaying the profile for a short-term price increase period on the left. Then, the price retraced to the HVN area (7) on the profile, where it found support (as indicated by the arrow). Do you think you could have profited from this reversal?
FAQ on the Fixed Range Volume Profile Indicator
Why does Fixed Range Volume Profile matter for support and resistance?
Volume is an additional dimension alongside time and price. Analyzing volume helps to understand price behavior within the context of trading activity, providing deeper insight into supply and demand dynamics. This elevates a trader’s approach and offers an advantage over many retail participants who rely on simple techniques like lagging indicators or make decisions based on emotions.
What is volume profile?
Volume profile is a volume analysis tool used by professional traders. It appears as a horizontal histogram that shows how trading volume (expressed, for example, in the number of contracts) is distributed across price levels over a specified period.
The logic is simple: the longer the bar on the histogram, the higher the volume traded at that price level; the shorter the bar, the lower the volume. This makes reading the volume profile on a chart visually convenient, quick, and, most importantly, insightful.
To begin using volume profile, refer to the articles on the ATAS blog, for example: How to Start Using Volume Profile in Trading
Market Profile and Volume Profile: what is the difference?
Both concepts relate to analyzing trading activity across price levels, but there is a slight conceptual difference.
- Market Profile originated in the 1980s when Peter Steidlmayer introduced the idea of visualizing price movement throughout the trading day using TPOs (Time Price Opportunities). Each TPO represents a mark showing that the price traded at a specific level during a certain time.
- Volume Profile, in contrast, is based on the trading volumes at different price levels. It is a more modern and widely used concept, as advances in technology have produced volume analysis tools that demonstrate high effectiveness and attract many traders.
In short, Volume Profile focuses solely on volume (sometimes broken down into bid and ask volumes), while Market Profile generally relies on time-based data and is more academic. In our article on the Session Volume Profile indicator, we provided a list of classic literature on the topic.
Final Thoughts on Using FRVP in Trading
The Anchored Volume Profile indicator in the ATAS platform displays the Fixed Range Volume Profile (FRVP). The range boundaries are manually set using two anchors: Begin and End. The profile is not attached to individual candles, which can be convenient when combining different time frames.
This provides greater flexibility for traders who incorporate volume profile histograms into their strategies, for instance, making trading decisions when the price interacts with Point of Control levels, value area boundaries, HVN and LVN zones, and other profile features. The tools available in the ATAS platform fully support the implementation of volume-based trading strategies.
Information in this article cannot be perceived as a call for investing or buying/selling of any asset on the exchange. All situations, discussed in the article, are provided with the purpose of getting acquainted with the functionality and advantages of the ATAS platform.
Start now!
Try ATAS free with no time limit