
Order Flow trading is a specialized trading approach that focuses on how buy and sell orders are executed, how liquidity changes, and how these interactions affect price. It helps traders assess current buying and selling pressure and gain deeper insight into short-term market dynamics.
By analyzing Order Flow, traders can get a clearer picture of the supply-demand balance, evaluate the strength of each side of the market, and anticipate potential moves. This analysis helps traders form a view of possible near-term price scenarios, though price movement can never be predicted with certainty.
In this article, we will explore the Order Flow tools available on the ATAS platform, which is built for professional volume analysis. We will also provide simple explanations of how each tool works and why it can be valuable for traders.
Start now!
Try ATAS free with no time limit
What is Order Flow in Trading?
Order flow trading is a method of analyzing how market and limit orders interact in real time and how their execution affects price. Traders study executed volume, bids and asks, order-book liquidity, and buying versus selling pressure to understand current market behavior and identify where price may react next.
✔ The goal of Order Flow analysis (one of the main ones) is to spot the actions of major market players and anticipate their intentions to forecast potential price direction.
Order Flow Trading vs Technical Analysis
Technical analysis primarily interprets historical price and volume patterns to identify trends, levels, and setups. Order flow trading focuses on current order execution and liquidity: which side is trading aggressively, where passive orders are absorbing pressure, and how price responds. The two approaches can be used together rather than treated as substitutes.
How Order Flow Trading Works: Orders, Liquidity, Bid and Ask
Every trade requires a buyer and a seller. Market orders are aggressive: they execute against limit orders resting in the order book. A market buy trades against the ask, while a market sell trades against the bid. By tracking where this activity occurs, how much liquidity is available, and how price responds, order flow trading helps traders judge which side is applying more pressure.
Advantages of Order Flow Analysis
Focus on real price drivers. Order Flow provides insight into the actual behavior of market participants, distinguishing between large and small players based on trade volumes.
More accurate level identification. This method may help identify more precise entry points, although it does not eliminate market risk.
Early trend change detection. Order Flow tools signal shifts in market sentiment before they become obvious.
Key Order Flow Concepts
Before we dive into the tools and analysis examples, let’s go over some essential trading principles that are important for understanding Order Flow. We will also provide links to articles with more in-depth explanations.
Orders that traders place on the exchange can be of two types:
- Passive, or limit orders.
- Aggressive, or market orders.
Limit orders can also be classified into two types:
- Asks – sell orders placed above the current price.
- Bids – buy orders placed below the current price.
The main job of the exchange is to match buy and sell orders in a trade.
There are two types of trades:
- Market buys – trades where market-buy orders are matched with limit-sell orders (asks).
- Market sells – trades where market-sell orders are matched with limit-buy orders (bids).
We will return to this later and illustrate the process in the chart below.
Order Flow Trading Tools: DOM, Footprint, Delta, Tape and Volume Profile
To effectively use Order Flow analysis, you will need:
- A professional desktop platform like ATAS, which offers over 400 indicators and specialized tools for Order Flow analysis. Basic platforms for beginners with simple indicators like RSI and MACD are not suitable for this purpose.
- Reliable data sources. For example, ATAS provides users with detailed historical data for each trade across cryptocurrency, stock, and futures markets. Additionally, ATAS is equipped with connectors that allow integration with exchanges and market data providers, ensuring real-time data access.
Let’s take a quick look at the Order Flow analysis tools on ATAS, using data from the Binance Futures exchange for the BTC/USDT market.
Order Book and DOM in Order Flow Trading
Depth of Market Indicator (Level II, or Order Book) is a fundamental indicator that is automatically added when you open a chart in ATAS. It shows all the current limit buy (bids) and sell (asks) orders at different price levels.
In the chart below, you can see:
- the Order Flow indicator, represented by a jagged line with circles, which filters out large trades (you can adjust the filter in the indicator settings).
- the Depth of Market indicator (on the right side of the chart);
Because displayed liquidity can be added or canceled quickly, traders should avoid treating single order-book events as definitive signals. Patterns such as iceberg orders and suspected spoofing require confirmation from executed trades and price response.
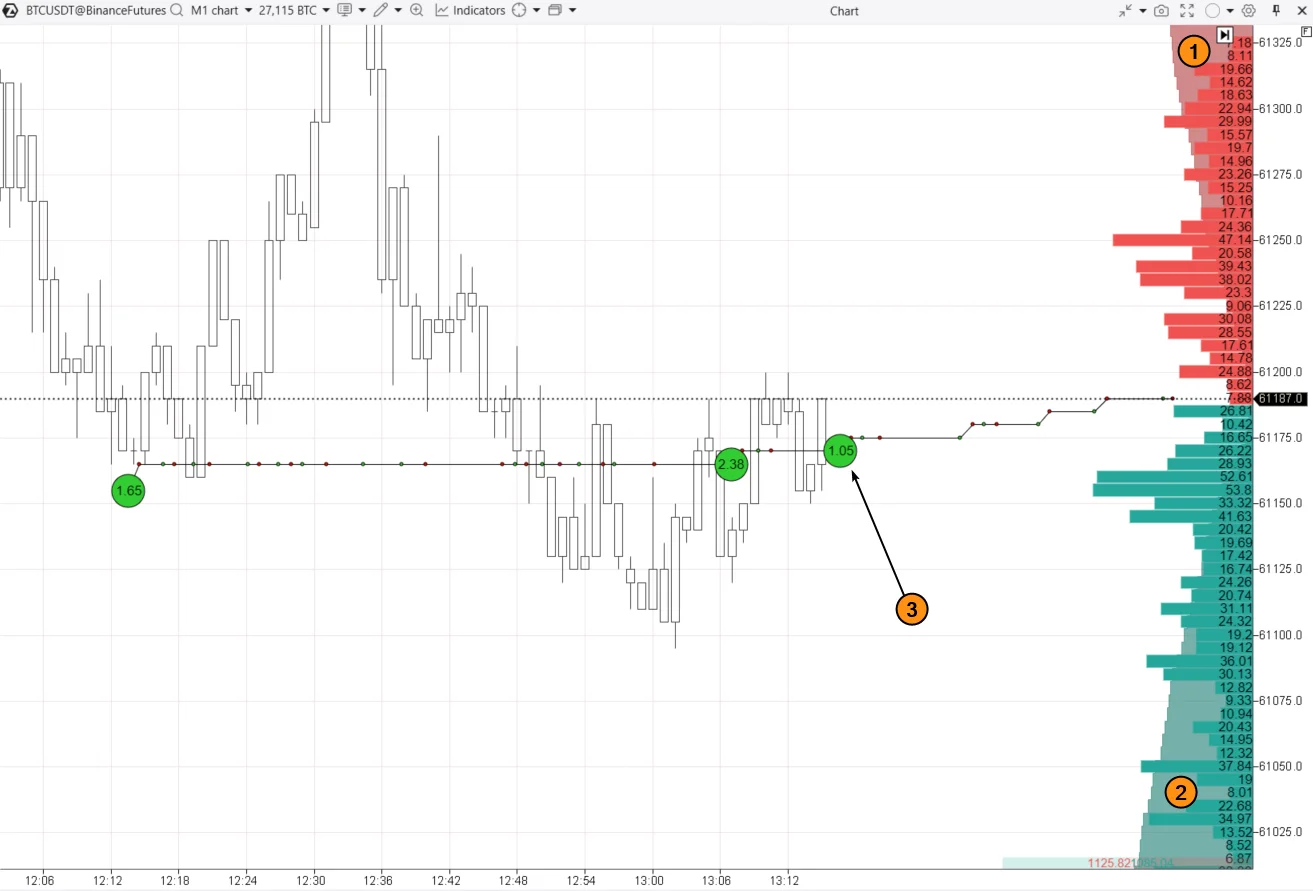
The numbers show:
- (1) limit sell orders (asks);
- (2) limit buy orders (bids).
- a market buy order of 1.06 Bitcoin. This trade is displayed in green because it matches a market-buy order with a limit-sell order. Notice how large buy orders push the price upwards.
Speed of Tape and Order Flow Rhythm Indicators
These indicators show the pace of trades, indicating how quickly transactions are happening.
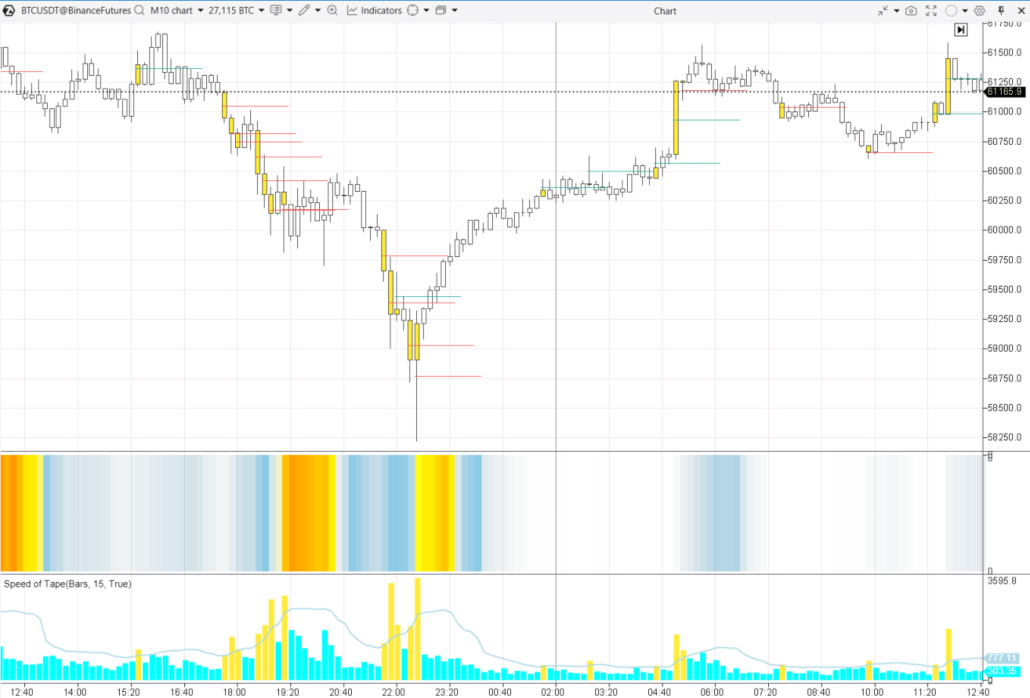
Candles that form when trades are executed more frequently can signal:
- breakouts of support and resistance levels;
- climaxes and subsequent trend reversals.
Volume, Delta, Bid and Ask: How to Interpret Buying and Selling Pressure
While Volume is a classic vertical volume indicator used since the early 20th century for market analysis, it is also valuable in Order Flow analysis. It is particularly effective when breaking down total volume into its components: market buys and market sells.
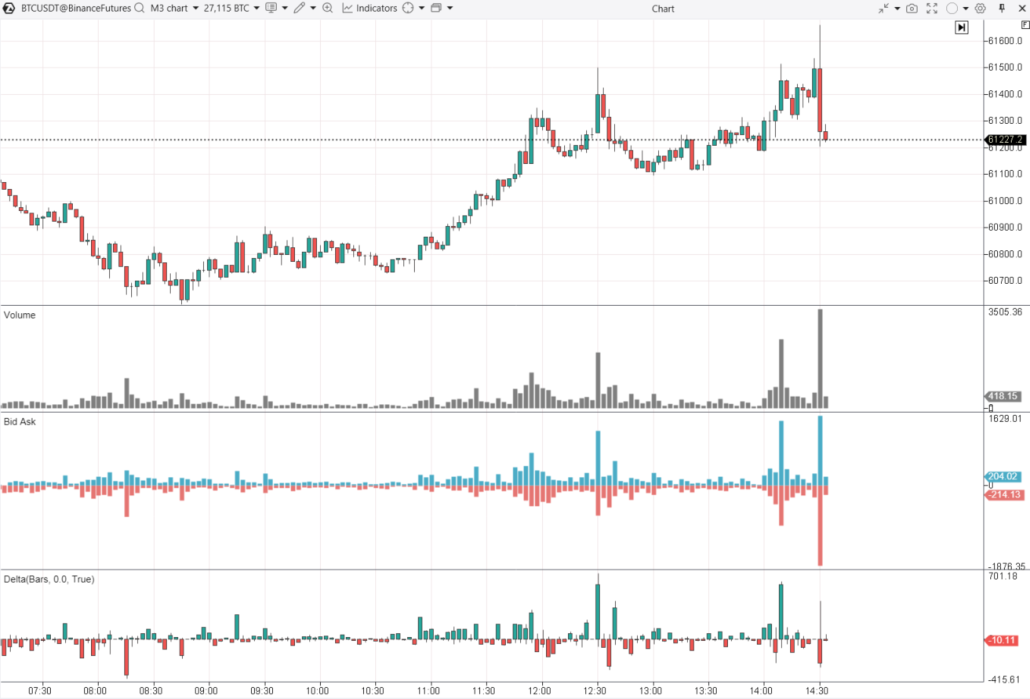
On the chart above, below the price area, the following indicators are displayed:
- Vertical Volumes (Volume).
- Bid Ask. Market sells are shown in red, and market buys in green.
- Delta. This indicator shows the difference between market buys and market sells.
A related metric is cumulative volume delta (CVD), which accumulates delta over time to show whether aggressive buying or selling pressure is building across multiple bars.
For instance, if the delta shows high positive values but the price does not rise, it could indicate market weakness (bulls struggling to push the price higher despite their efforts) and may signal a potential price drop.
Horizontal Volume Indicators
Also known as Market Profiles.
Market profiles highlight key levels where a large number of trades have taken place, revealing popular price points among traders. In ATAS, these levels can be identified based on the total volume of trades or the number of orders placed, with a breakdown between buys and sells.
ATAS provides a powerful set of tools for working with market profiles:
- fixed profile;
- profile indicator for a specific time frame;
- profile construction for any section of the chart.
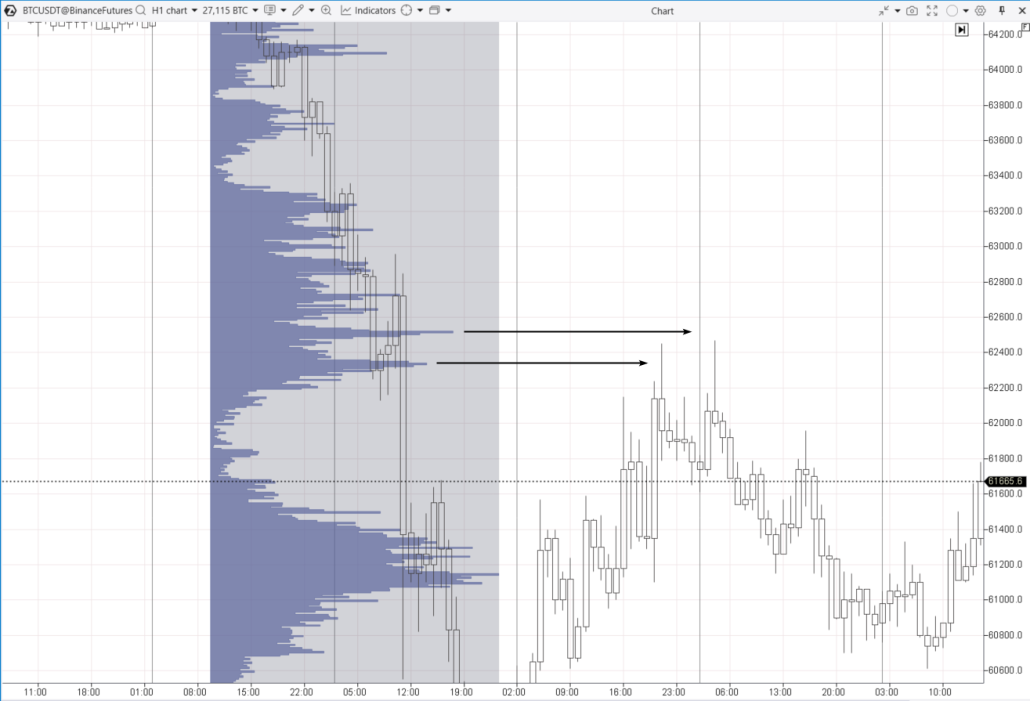
The example above shows, with arrows, levels where high volumes of trades took place as the price dropped. Buyers tried to “catch the bottom,” while others were actively selling, expecting the bearish trend to continue – and they were right. As the arrows indicate, these levels, where many orders with large volumes were processed, often turn into support or resistance levels later on.
Recommended reading:
Footprint Charts in Order Flow Trading
Footprint (or cluster chart) is a versatile chart type that enables you to “look inside” traditional candlesticks for a more detailed volume analysis, using profiles or other settings.
The Footprint combines both vertical and horizontal volumes, making it a flexible tool for analyzing executed orders.
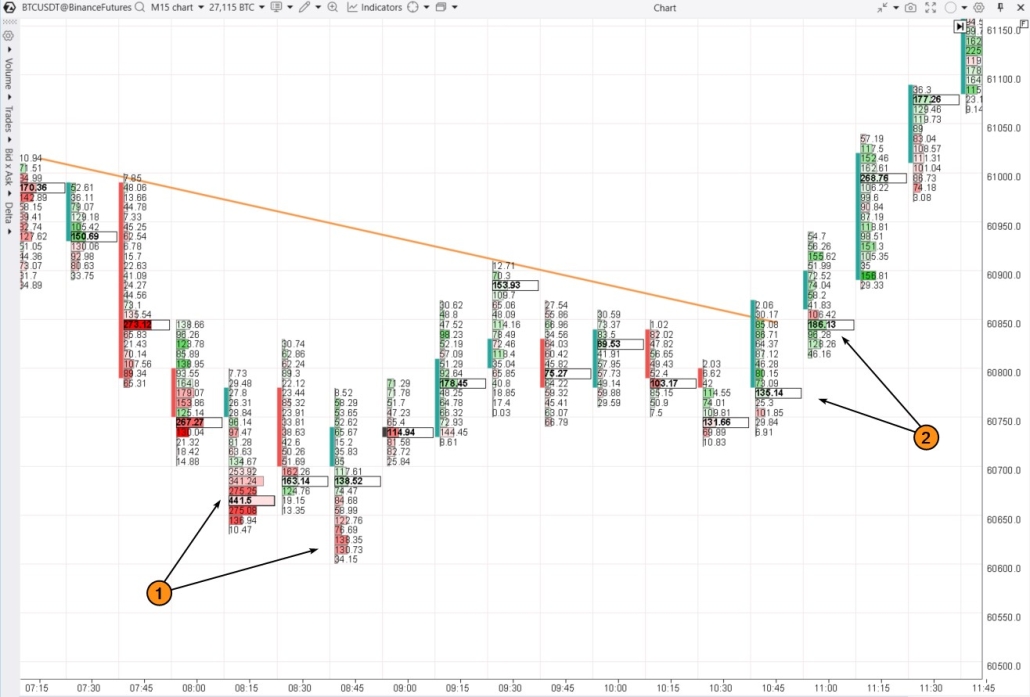
The Footprint chart above illustrates how to analyze order flow (follow the numbered arrows):
- Executed sell market orders did not result in a continued price decline. The price closed higher than the levels where a significant flow of sell orders had occurred, indicating the end of the downtrend.
- Executed buy orders pushed the price higher. The bright green cluster at 11:00 shows strong buying activity as the price breaks through the resistance line (the descending trend line), signaling a bullish market.
DOM Trader Mod
The DOM Trader mode brings together a range of features, offering users an intuitive interface for Order Flow analysis and intraday trading.
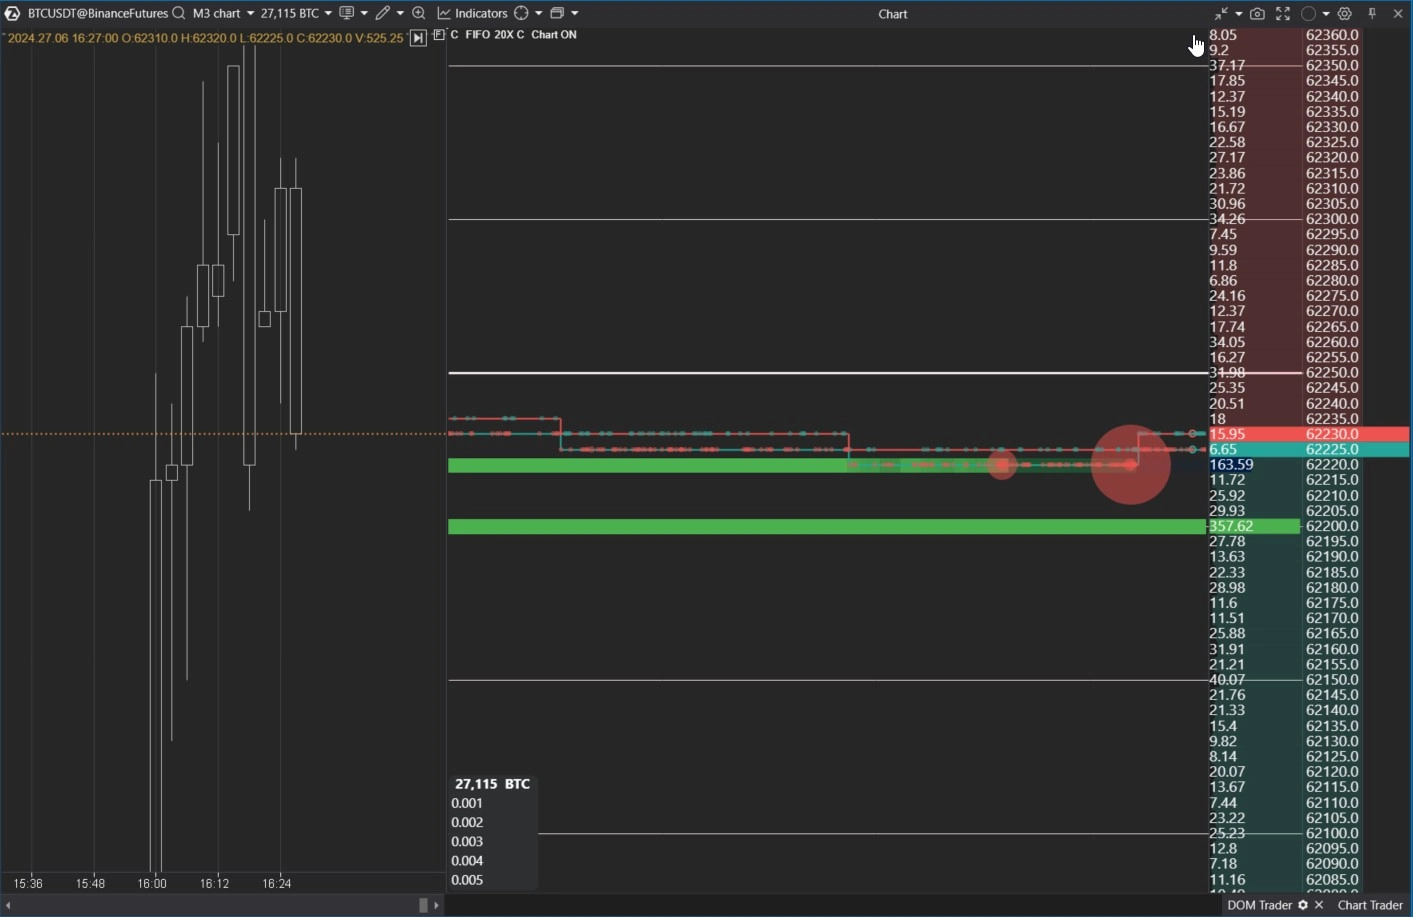
It includes:
✔ a section for analyzing the liquidity map (showing the flow of executed orders);
✔ a section for visualizing the order book (showing active limit orders);
✔ trading features;
✔ flexible settings.
Learn more: Overview of the DOM Trader mode in the ATAS Knowledge Base.
DOM Levels Indicator
This innovative indicator enables you to assess the historical price reaction to significant volume levels in the order book.
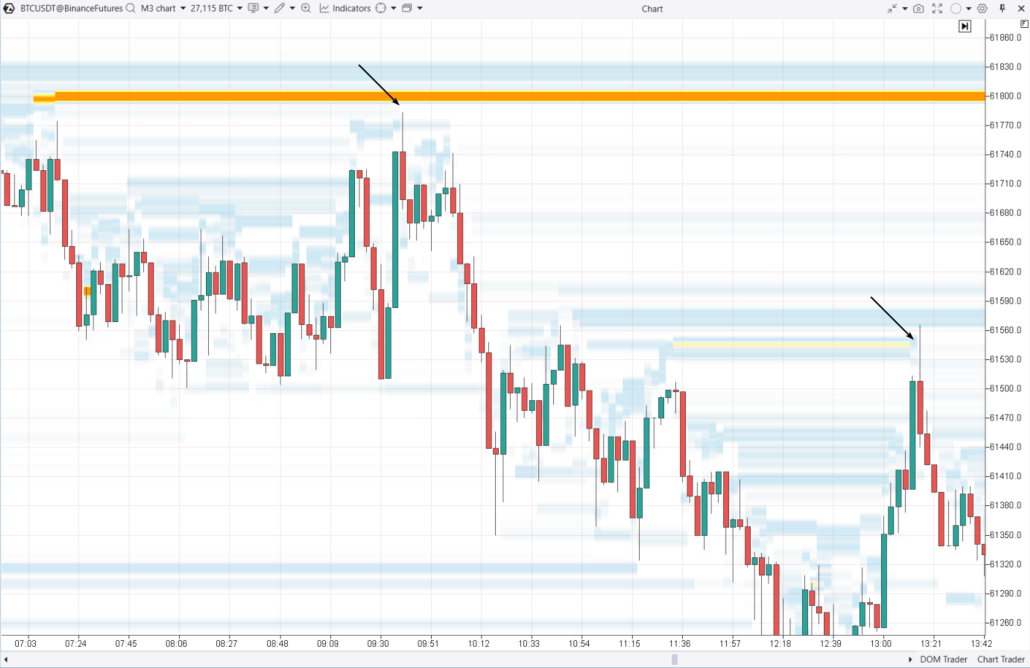
The example above shows two price reversals downward from the levels where large sell orders were placed.
Viewed historically, these liquidity levels can function as a heatmap of where notable limit-order concentrations appeared and how price reacted.
For more details on how the indicator works, visit the knowledge base.
Smart Tape Module
This module is also known as Time and Sales or Order Tape.
Smart Tape (shown below, to the right of the chart) displays a real-time flow of recently executed trades as continuously updating bars.
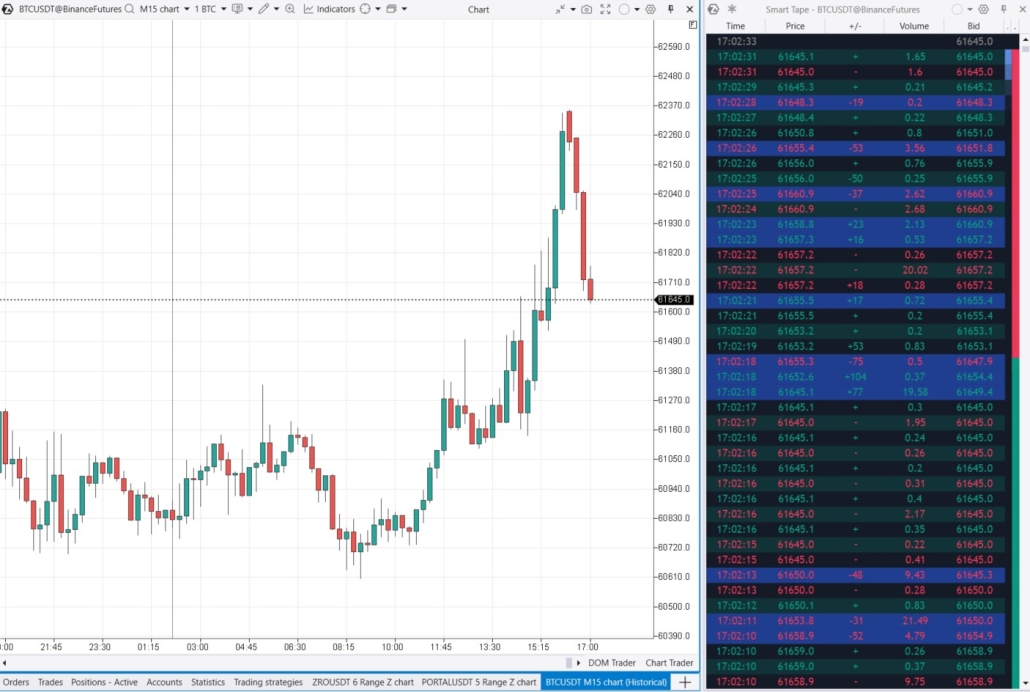
Some of the main features of Smart Tape include:
- the ability to analyze the flow for selected candles on any part of the historical candlestick chart;
- trade aggregation (making the tape easier to read);
- Min/Max filters;
- tape speed indicator;
- highlighting trades outside the spread (which can signal a trend reversal).
Imbalance Indicator
Stacked Imbalance shows:
- areas with a higher concentration of buyers are shown in green;
- areas with more sellers are marked in red.
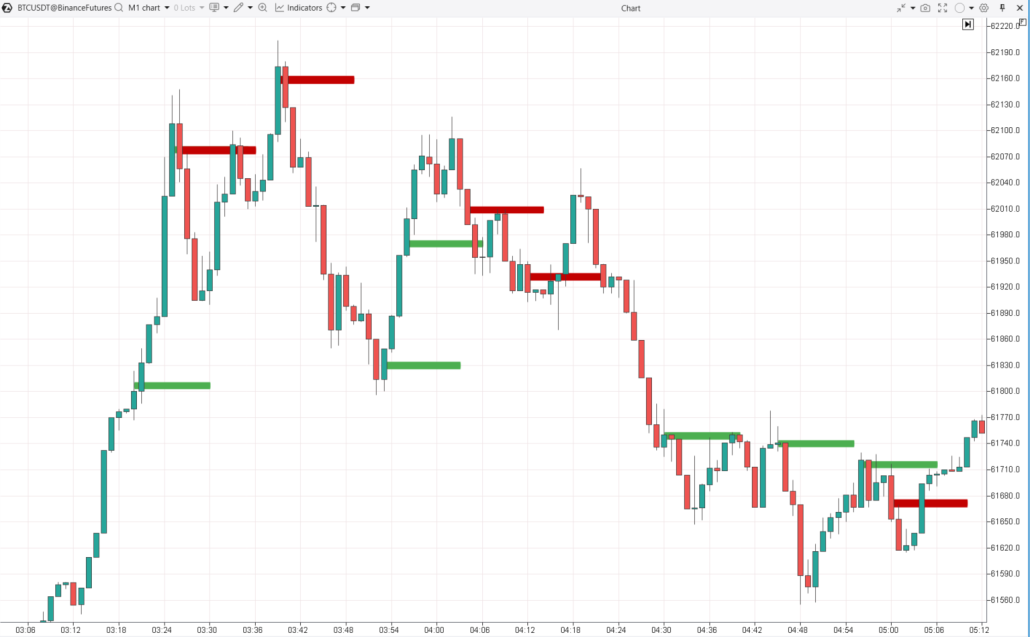
These levels often highlight zones where a trend might accelerate or reverse.
For instance, if the buyer dominance is largely due to an influx of small traders’ buy orders, this could signal a potential trap for these traders, leading to a downward price reversal.
Recommended reading:
How to Analyze Order Flow
Order flow analysis requires more advanced skills and is significantly more complex than identifying moving average crossovers.
When analyzing Order Flow, an analyst considers:
- the effort from one side of the market compared to the achieved result;
- market participants’ psychology;
- price and volume behavior near key support and resistance levels;
- market participants’ psychology,and other factors, using logical reasoning to form a personal judgment on the market’s current character.
Example. A trader examined a Bitcoin price decline (1) on the 30-minute chart, observing a dip below the psychological $60k level, followed by a recovery (2). Using market profile, they identified a zone with two levels showing high order volume (3) and hypothesized that the recovery could encounter resistance at those levels.
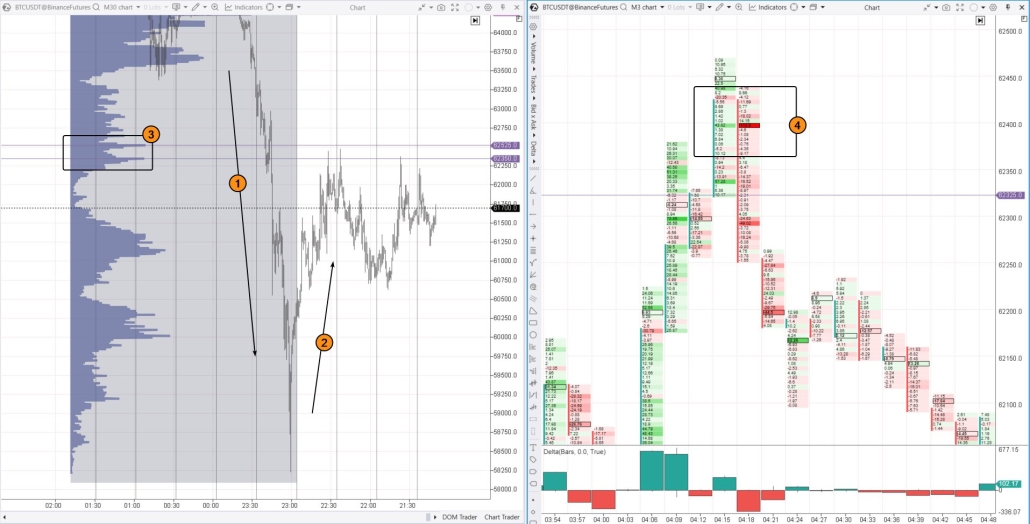
To get confirmation, the trader switched to the 3-minute chart and, using the footprint, noticed a sharp shift in market sentiment (4) at the 62,400 level. Exhausted buying at the 4:15 bar was followed by a surge in seller activity at 4:18. In other words, the order flow dominated by market buys ended, giving way to an order flow dominated by market sells.
Order Flow Trading Strategies
Breakout Confirmation with Order Flow
Instead of treating every break of support or resistance as valid, traders can use a footprint chart, delta, and tape speed to check whether aggressive orders support the move. If price breaks a level while executed volume and delta expand in the same direction, the breakout may have stronger confirmation. A weak response or immediate rejection can warn of a false break.
Reversal Trading with Absorption
Absorption occurs when aggressive market orders hit a price level but fail to move price further because passive liquidity is taking the other side. In order flow trading, traders may watch for heavy selling with little downside progress, or heavy buying with little upside progress, then seek confirmation before considering a reversal.
Scalping and Intraday Order Flow Trading
Scalpers and intraday traders can use order flow trading to monitor short-term changes in bids, asks, delta, tape speed, and liquidity around important levels. The goal is not to react to every fluctuation, but to identify moments when order execution and price response show a temporary imbalance.
Combining Order Flow with Technical Analysis
Technical analysis can define the broader context—trend, support and resistance, and chart structure—while order flow trading can help evaluate what is happening at those levels in real time. A trader may first mark a technical level, then use a footprint chart, delta, or DOM behavior to confirm or reject the setup.
FAQ
Order Flow analysis is essential for forecasting price movements in the market. This analysis is conducted by observing how orders of different sizes are placed and executed, and how prices respond to aggressive trades and key levels.
Typically, no. Real-time exchange data and specialized professional software with advanced analysis tools often require a fee. However, these costs can be worthwhile, given the valuable insights Order Flow analysis can provide.
Yes. By analyzing horizontal and vertical volumes, broken down into bids and asks, as well as examining orders in the order book, you can uncover the real forces driving market trends.
Order Flow analysis can be applied to any market. Since it focuses on the mechanics of trading, it can be used to predict prices in cryptocurrencies, stocks, and futures. However, it is particularly valuable for active intraday traders, as it focuses on the finer details that might be less relevant for swing traders.
How to learn Order Flow analysis?
First, you will need a professional program for analyzing Order Flow on cryptocurrency and traditional exchange markets, with features such as:
- The ability to analyze charts down to individual trades.
- Footprint or cluster charts..
- Vertical volume indicators with delta breakdowns.
- Market Profiles.
- Order book analysis tools.
✔ The ATAS platform, with its Order Flow tools described above, is a professional platform for this purpose, and you can download it for free here. By the way, ATAS was originally called OFT (Order Flow Trading).
✔ Second, you will need data from exchanges. Order flow data from cryptocurrency exchanges is usually available for free. However, there may be a small fee for order flow data from futures or stock exchanges.
✔ Third, you will need to dedicate time to learning. While it might take a few months, the skills you acquire will serve you for a lifetime.
For effective Order Flow training in ATAS, the following resources are available:
- Market Replay simulator for traders;
- learning materials in the Learn section of the platform;
- statistics analysis and demo account;
- educational articles on our blog.
Conclusion
Order Flow trading is a method that can help traders better understand short-term market dynamics; results depend on individual skill and market conditions.
It focuses on the real drivers of price movements, with supply and demand reflected in the orders placed on the exchange. This approach helps traders spot shifts in market sentiment early and make more informed trading decisions.
Download ATAS. It is free. Once you install the platform, you will automatically get the free START plan, which includes cryptocurrency trading and basic features. You can use this plan for as long as you like before deciding to upgrade to a more advanced plan for additional ATAS tools. You can also activate the Free Trial at any time, giving you 14 days of full access to all the platform’s features; after the trial period ends, continued access is billed according to the plan selected, with the option to cancel at any time. This trial allows you to explore the benefits of higher-tier plans and make a well-informed purchasing decision. Do not miss the next article on our blog.
Information in this article cannot be perceived as a call for investing or buying/selling of any asset on the exchange. All situations, discussed in the article, are provided with the purpose of getting acquainted with the functionality and advantages of the ATAS platform.
Subscribe
Get the latest ATAS news delivered conveniently